Technology
Visualizing the State of 5G Networks Worldwide
View the full-size version of this infographic.
Visualizing the State of 5G Networks Worldwide
View the high resolution of this infographic by clicking here.
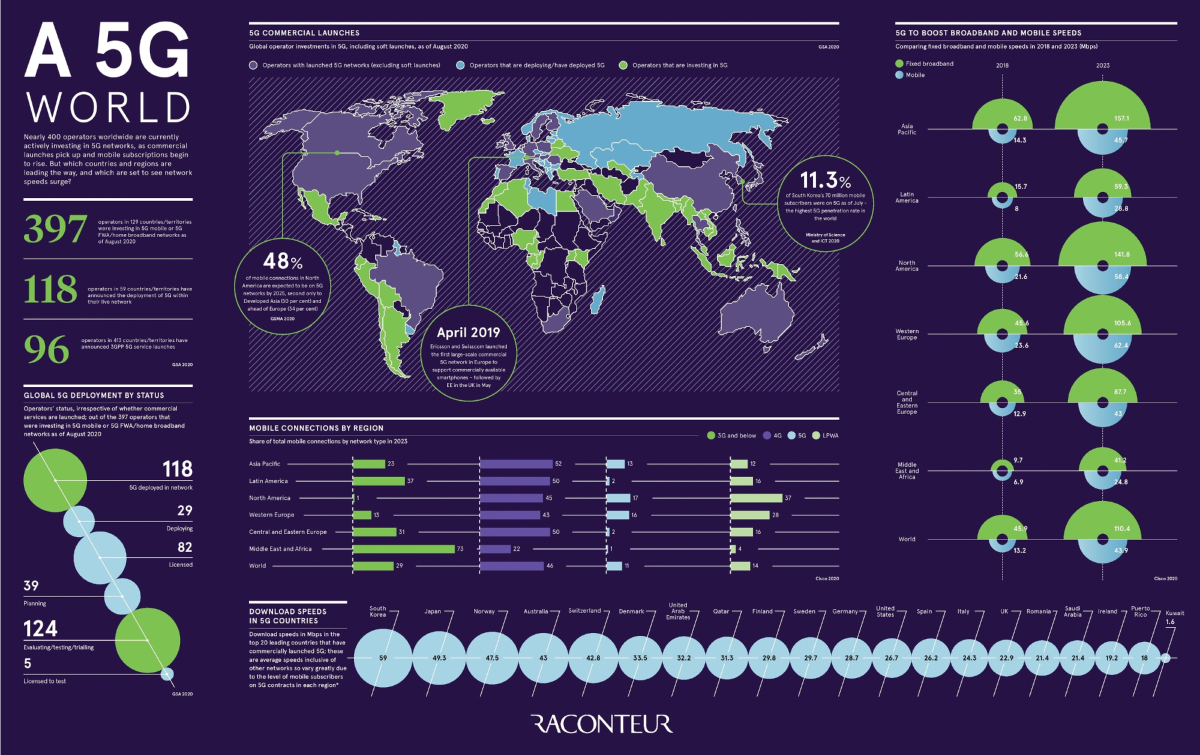
By 2025, the world will reach 1.8 billion 5G connections—led by Developed Asia and North America, two regions that could each see nearly half of mobile connections operating on 5G networks.
This sweeping rollout relies on infrastructure capacities, and many operators are buying in big to usher in 5G adoption. This infographic from Raconteur covers where we are on the roadmap towards 5G becoming mainstream, and which regions are leading the way in connectivity.
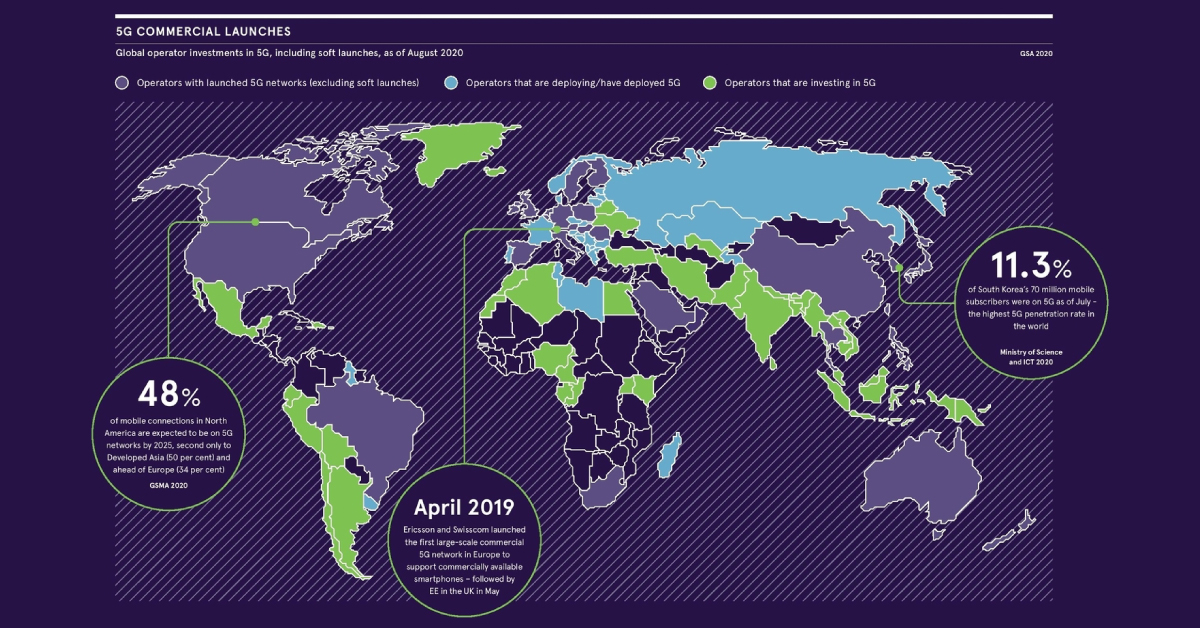
Commercial Launches of 5G Networks
From its earliest iterations to the Internet of Things, we’ve surpassed three generations of wireless networks. Now, 5G is at a tipping point.
5G is unique in that in order to actually start using the network, you need a device that works on it—unlike previous generations where they could simply switch over. Moreover, carriers need to invest in the infrastructure to optimize network access and the density of devices using it.
As more operators buy into the technology, the latter is finally beginning to happen in some areas. Here’s how the total numbers break down across the world, as of mid-September 2020:
- 397 operators are investing in 5G mobile or 5G fixed wireless access/home broadband networks
- 118 operators have announced the deployment of 5G within their live network
- 96 operators have announced 3GPP (protocols for mobile telecomms) 5G service launches
Major phone operators and even tech companies are behind accelerating this change, from Vodafone to Verizon—and most recently, Microsoft has entered the playing field.
Cross-Generational Mobile Connections, By Region
As Cisco highlights, there’s more room to grow yet. By 2023, North America will have the highest share of 5G networks, at 17% within the region.
| Region | ≤ 3G | 4G | 5G | LPWA |
|---|---|---|---|---|
| Asia Pacific | 23% | 52% | 13% | 12% |
| Latin America | 37% | 50% | 2% | 16% |
| North America | 1% | 45% | 17% | 37% |
| Western Europe | 13% | 43% | 16% | 28% |
| Central & Eastern Europe | 31% | 50% | 2% | 16% |
| Middle East & Africa | 73% | 22% | 1% | 4% |
| World | 29% | 46% | 11% | 14% |
*Low-power wide-area (LPWA) networks are a generic type of network that can coexist across 2G, 3G, and 4G. Network shares may not add up due to rounding.
Meanwhile, the Middle East and Africa could have the most catching up to do, with 73% of the region still operating on 3G networks or less in 2023. The good news? Commercial 5G trials in Nigeria may signal the potential of networks leapfrogging ahead.
Need for Speed
As the number of 5G networks tick up, there will be an undeniable boost to mobile and broadband speeds (Mbps) across regions by 2023. In particular, Asia Pacific will have the fastest broadband speeds at 157 Mbps while Western Europe will lead with 62 Mbps on mobile.
| Region | Mobile (2018) | Mobile (2023) | Broadband (2018) | Broadband (2023) |
|---|---|---|---|---|
| Asia Pacific | 14.3 | 45.7 | 62.8 | 157.1 |
| Latin America | 8.0 | 28.8 | 15.7 | 59.3 |
| North America | 21.6 | 58.4 | 56.6 | 141.8 |
| Western Europe | 23.6 | 62.4 | 45.6 | 123.0 |
| Central & Eastern Europe | 12.9 | 43.0 | 35.0 | 87.7 |
| Middle East & Africa | 6.9 | 24.8 | 9.7 | 41.2 |
| World | 13.2 | 43.9 | 45.9 | 110.4 |
Faster speeds is one of several factors catapulting the promise of 5G networks to unlock transformations across entire industries, from manufacturing to healthcare.
What further advancements could dial reach region’s share of 5G networks all the way up?


Technology
All of the Grants Given by the U.S. CHIPS Act
Intel, TSMC, and more have received billions in subsidies from the U.S. CHIPS Act in 2024.


All of the Grants Given by the U.S. CHIPS Act
This was originally posted on our Voronoi app. Download the app for free on iOS or Android and discover incredible data-driven charts from a variety of trusted sources.
This visualization shows which companies are receiving grants from the U.S. CHIPS Act, as of April 25, 2024. The CHIPS Act is a federal statute signed into law by President Joe Biden that authorizes $280 billion in new funding to boost domestic research and manufacturing of semiconductors.
The grant amounts visualized in this graphic are intended to accelerate the production of semiconductor fabrication plants (fabs) across the United States.
Data and Company Highlights
The figures we used to create this graphic were collected from a variety of public news sources. The Semiconductor Industry Association (SIA) also maintains a tracker for CHIPS Act recipients, though at the time of writing it does not have the latest details for Micron.
| Company | Federal Grant Amount | Anticipated Investment From Company |
|---|---|---|
| 🇺🇸 Intel | $8,500,000,000 | $100,000,000,000 |
| 🇹🇼 TSMC | $6,600,000,000 | $65,000,000,000 |
| 🇰🇷 Samsung | $6,400,000,000 | $45,000,000,000 |
| 🇺🇸 Micron | $6,100,000,000 | $50,000,000,000 |
| 🇺🇸 GlobalFoundries | $1,500,000,000 | $12,000,000,000 |
| 🇺🇸 Microchip | $162,000,000 | N/A |
| 🇬🇧 BAE Systems | $35,000,000 | N/A |
BAE Systems was not included in the graphic due to size limitations
Intel’s Massive Plans
Intel is receiving the largest share of the pie, with $8.5 billion in grants (plus an additional $11 billion in government loans). This grant accounts for 22% of the CHIPS Act’s total subsidies for chip production.
From Intel’s side, the company is expected to invest $100 billion to construct new fabs in Arizona and Ohio, while modernizing and/or expanding existing fabs in Oregon and New Mexico. Intel could also claim another $25 billion in credits through the U.S. Treasury Department’s Investment Tax Credit.
TSMC Expands its U.S. Presence
TSMC, the world’s largest semiconductor foundry company, is receiving a hefty $6.6 billion to construct a new chip plant with three fabs in Arizona. The Taiwanese chipmaker is expected to invest $65 billion into the project.
The plant’s first fab will be up and running in the first half of 2025, leveraging 4 nm (nanometer) technology. According to TrendForce, the other fabs will produce chips on more advanced 3 nm and 2 nm processes.
The Latest Grant Goes to Micron
Micron, the only U.S.-based manufacturer of memory chips, is set to receive $6.1 billion in grants to support its plans of investing $50 billion through 2030. This investment will be used to construct new fabs in Idaho and New York.

-

 Debt1 week ago
How Debt-to-GDP Ratios Have Changed Since 2000
-

 Markets2 weeks ago
Ranked: The World’s Top Flight Routes, by Revenue
-

 Countries2 weeks ago
Population Projections: The World’s 6 Largest Countries in 2075
-

 Markets2 weeks ago
The Top 10 States by Real GDP Growth in 2023
-

 Demographics2 weeks ago
The Smallest Gender Wage Gaps in OECD Countries
-

 United States2 weeks ago
Where U.S. Inflation Hit the Hardest in March 2024
-

 Green2 weeks ago
Top Countries By Forest Growth Since 2001
-

 United States2 weeks ago
Ranked: The Largest U.S. Corporations by Number of Employees