Finance
Every Company In and Out of the Dow Jones Industrial Average Since 1928
View the full-size version of this infographic.


Every Company In and Out Of The Dow Since 1928
View the high resolution of this infographic by clicking here.
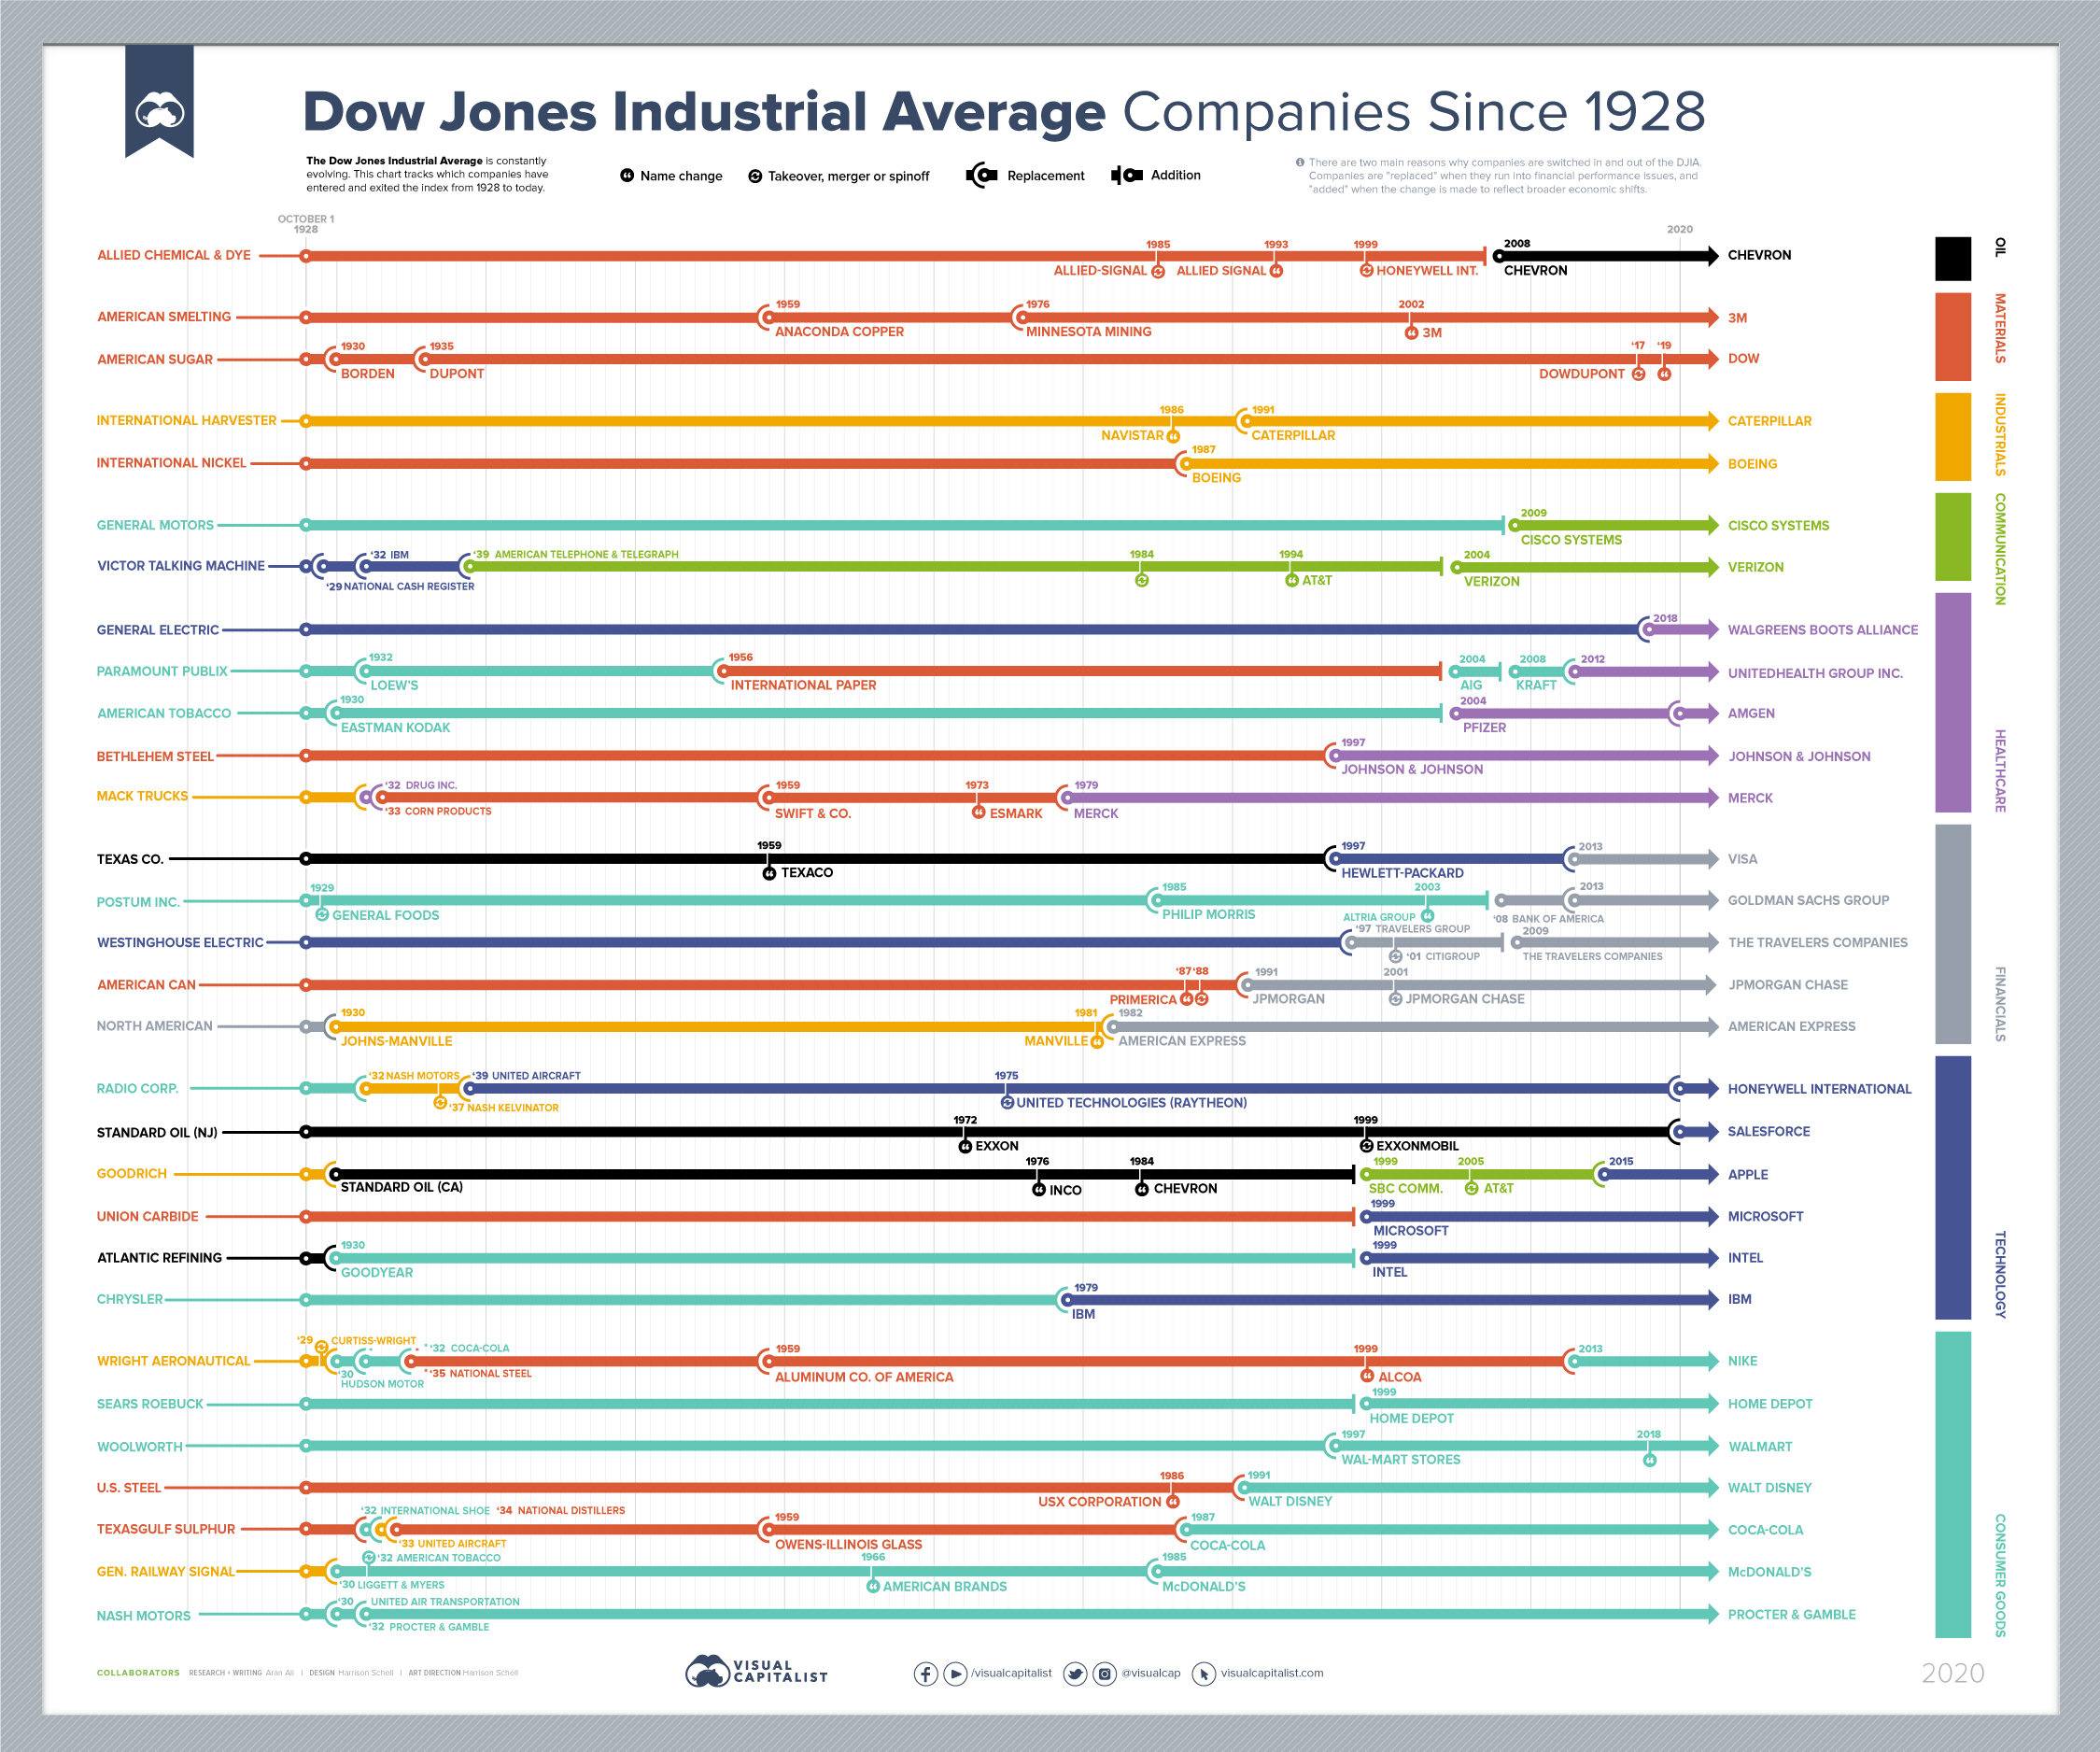
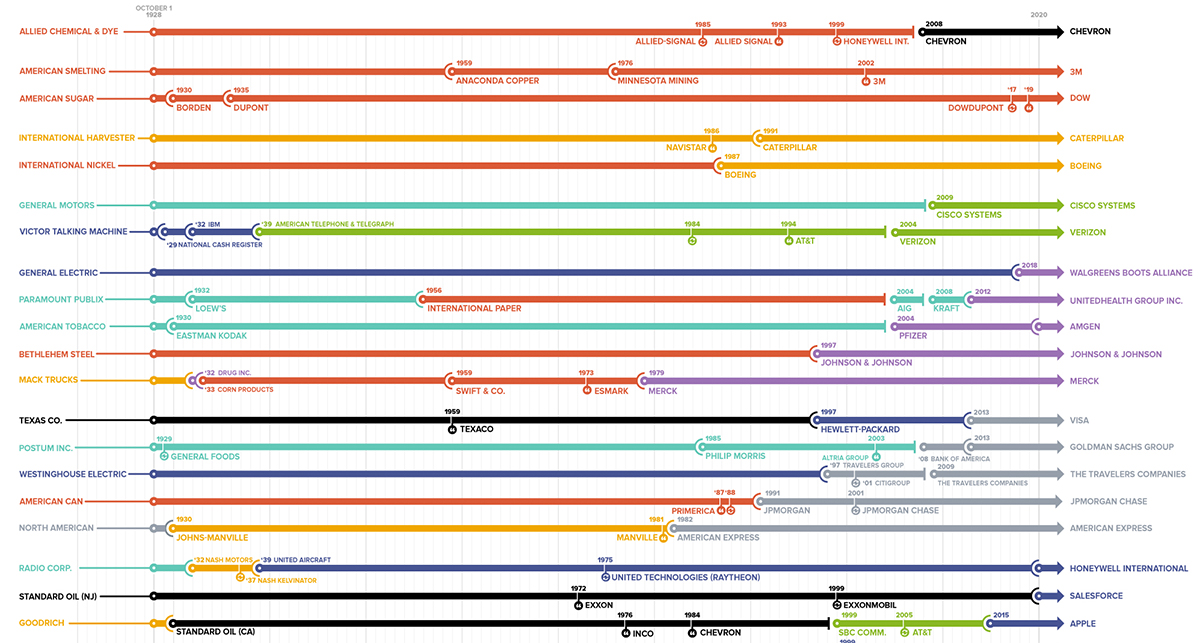
The Dow Jones Industrial Average (DJIA) is reported on daily by every major finance and media platform—a testament to its importance and relevance in global financial markets.
The market benchmark has a rich history embedded alongside America’s rise as a global superpower in the 20th century, and the inflows and outflows of companies on the 30 stock index coincide with broader secular trends. For example, the delisting of many industrial stocks over time encapsulates America’s transition towards a service-based economy. Meanwhile, the addition of tech companies in the last few decades paints a similar picture of change.
Today’s infographic looks at Dow data spanning over nine decades, all the way back to the tail end of the Roaring Twenties.
Crank Up The Volatility
An increasingly competitive and accelerating business landscape results in greater churn for stock market indices.
In fact, in the 92 years of activity visualized for the DJIA, there were 93 changes in its composition. This is not surprising, as the average duration of a company’s tenure on American indices has been trending down for decades—that said, 63% of Dow changes occurred in the second half of the 92 year sample period.
The current iteration of the DJIA includes some long-serving constituents, with the average length of companies in the index sitting at 20 years. General Electric was the last standing member of the original group from 1928, but in 2018, they were replaced by Walgreens.
2020 has also brought with it some fresh faces, including three changes so far. They include Salesforce for ExxonMobil, Amgen for Pfizer, and Honeywell International for United Technologies. Here’s a full list of the current companies in the index:
| Company | Market Cap (B) | TTM Revenue (B) | YTD Stock Performance |
|---|---|---|---|
| American Express | $81.1 | $34.3 | -21.0% |
| Amgen | $149.8 | $23.1 | 3.0% |
| Apple | $1996 | $273.9 | 55.0% |
| Boeing | $94.6 | $66.6 | -49.5% |
| Caterpillar | $81.2 | $43.6 | -0.2% |
| Cisco Systems | $167.2 | $49.3 | -18.5% |
| Chevron | $134.8 | $115.0 | -40.3% |
| Goldman Sachs Group | $69.3 | $18.2 | -14.4% |
| Home Depot | $299.2 | $119.3 | 24.6% |
| Honeywell International | $116.6 | $34.5 | -7.1% |
| IBM | $109.1 | $74.3 | -9.8% |
| Intel | $221.5 | $79.0 | -14.5% |
| Johnson & Johnson | $392.2 | $80.5 | 0.8% |
| Coca-Cola | $212.2 | $34.3 | -11.6% |
| JPMorgan Chase | $295.4 | $76.3 | -31.6% |
| McDonald's | $170.9 | $19.1 | 10.7% |
| 3M | $93 | $31.4 | -9.4% |
| Merck & Co. | $209.9 | $47.2 | -10.0% |
| Microsoft | $1596.3 | $143.0 | 31.4% |
| Nike | $196.4 | $37.3 | 24.7% |
| P&G | $347.3 | $71.0 | 9.9% |
| The Travelers Companies | $27.6 | $28.6 | -21.6% |
| United Health Group Inc. | $297.4 | $195.1 | 3.5% |
| Salesforce | $195.8 | $19.4 | 52.2% |
| Verizon | $255.3 | $129.7 | -3.5% |
| Visa | $428.8 | $22.9 | 6.1% |
| Walgreens Boots Alliance | $31.3 | $138.7 | -40.0% |
| Walmart | $398.9 | $542.0 | 15.4% |
| Walt Disney | $225.6 | $69.8 | -13.3% |
| Dow | $35.4 | $3.1 | -14.9% |
| Average | $297.67 | $88.5 | -3.1% |
Although all the stocks in the DJIA are intended to be in line with broader economic trends, the similarities end there. For some DJIA stocks, 2020 has brought growth and opportunity—for others, quite the opposite.
YTD stock price performances range vastly from a high of 55% to a low of -49%. Perhaps it serves as no surprise that the best performing companies serve in the tech space like Apple, Microsoft, and Salesforce, while the worst performing are the likes of Boeing and Chevron.
A Sign of the Times
The three changes in 2020 can best be described as modernizing the Dow.
The delistings include businesses in industries such as Aerospace & Defense and Big Pharma. But the most monumental exit? ExxonMobil, which was once the biggest company by market capitalization in America.
Their fall from grace best symbolizes the state and direction the world is headed towards.


Business
Visualizing the Revenue of the Big Four Accounting Firms
The Big Four accounting firms amassed over $200 billion in combined revenue in 2023.
Visualizing the Revenue of the Big Four Accounting Firms
This was originally posted on our Voronoi app. Download the app for free on iOS or Android and discover incredible data-driven charts from a variety of trusted sources.
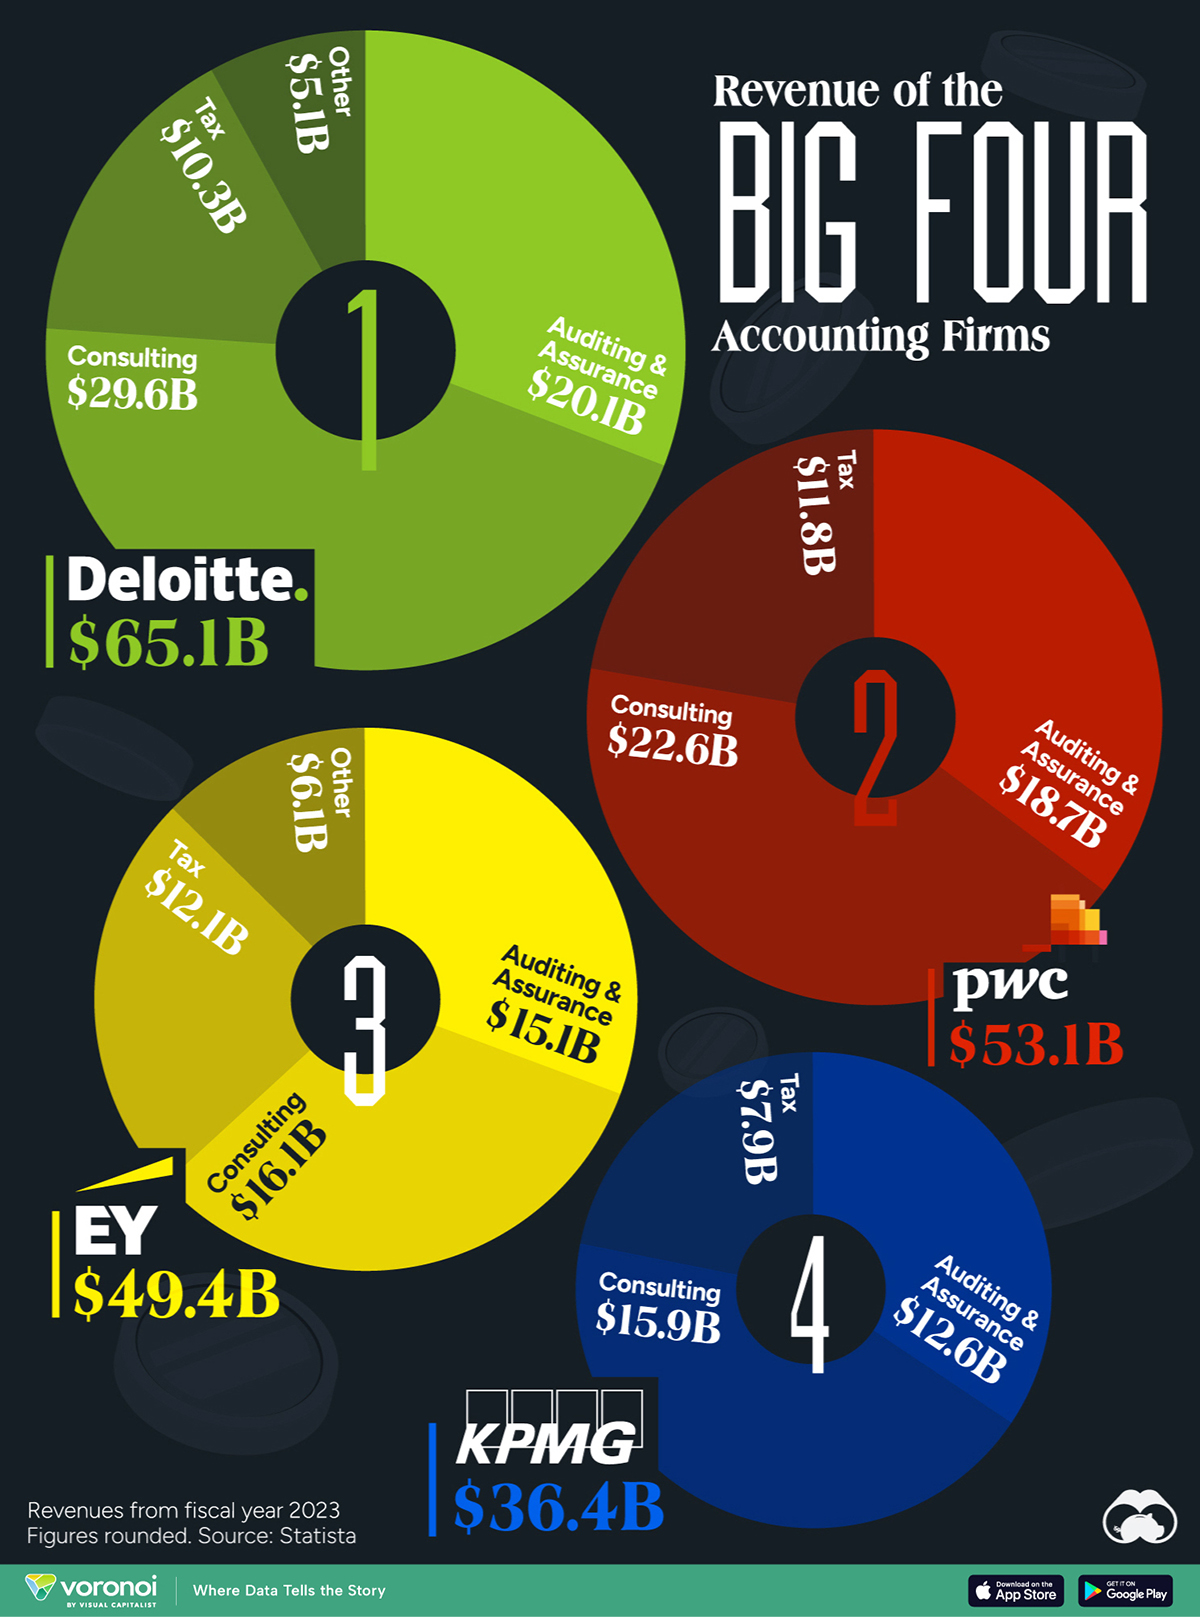
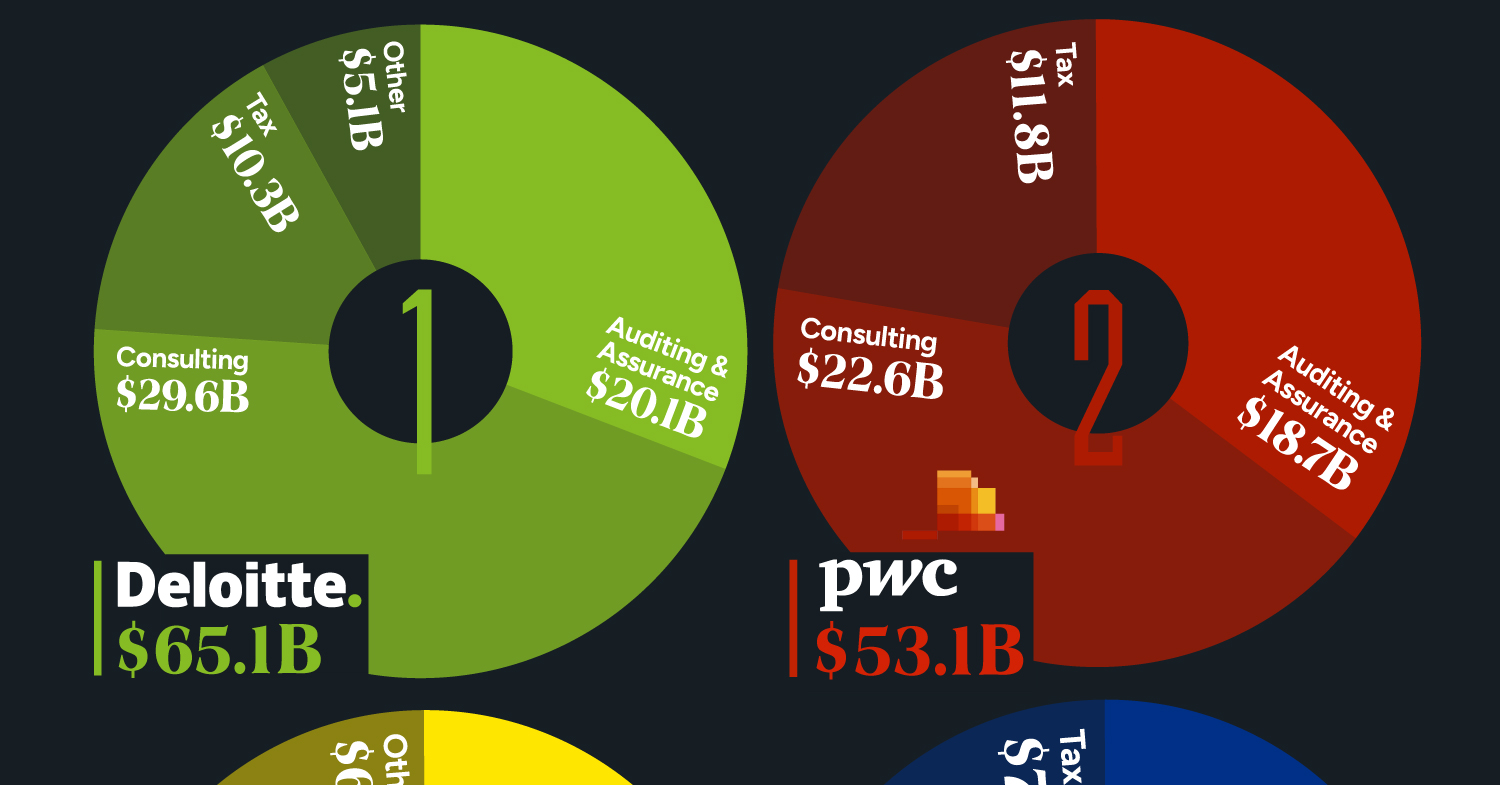
The Big Four accounting firms – Deloitte, Ernst & Young (EY), PricewaterhouseCoopers (PwC), and KPMG – have solidified their positions as global industry leaders, boasting a combined revenue exceeding $200 billion in 2023.
Together, these firms audit the majority of publicly traded companies worldwide.
This infographic details the revenues of the “Big Four” accounting firms for the fiscal year 2023, based on data from Statista.
Deloitte Leads the Big Four in 2023 Revenues
Offering diverse services, the Big Four specialize in auditing and assurance, ensuring financial transparency, and regulatory compliance for their clients. Additionally, they provide strategic consulting services. All four are legally headquartered in the UK and command a dominant global market share.
| Company | Auditing & Assurance | Consulting | Tax | Other | Total ($ billions) |
|---|---|---|---|---|---|
| Deloitte | $20.1 | $29.6 | $10.3 | $5.1 | $65.1 |
| PwC | $18.7 | $22.6 | $11.8 | $53.1 | |
| EY | $15.1 | $16.1 | $12.1 | $6.1 | $49.4 |
| KPMG | $12.6 | $15.9 | $7.9 | $36.4 |
Interestingly, the largest accounting firms were formerly known as the “Big Eight,” but mergers and closures starting in the late 1980s have reduced their number to four.
The original group consisted of Arthur Andersen, Arthur Young, Coopers & Lybrand, Deloitte Haskin & Sells, Ernst & Whinney, Peat Marwick Mitchell, Price Waterhouse, and Touche Ross, all headquartered in the U.S. or UK.
Arthur Young merged with Ernst & Whinney, and Deloitte Haskin & Sells combined with Touche Ross. Subsequently, Price Waterhouse and Coopers & Lybrand merged their practices, reducing the count to five. However, following the collapse of Arthur Andersen due to its involvement in the Enron scandal, the “Big Five” became the present-day four.
The Scale of the Big Four
Deloitte is the largest in terms of headcount, with over 456,000 employees as of FY2023, followed by Ernst & Young with more than 395,000 workers, and PwC with 364,000. Despite being the smallest among the four, KPMG still has 298,356 employees.

-

 Maps2 weeks ago
Mapped: Average Wages Across Europe
-

 Money1 week ago
Which States Have the Highest Minimum Wage in America?
-

 Real Estate1 week ago
Ranked: The Most Valuable Housing Markets in America
-

 Markets1 week ago
Charted: Big Four Market Share by S&P 500 Audits
-

 AI1 week ago
The Stock Performance of U.S. Chipmakers So Far in 2024
-

 Misc2 weeks ago
Almost Every EV Stock is Down After Q1 2024
-

 Money2 weeks ago
Where Does One U.S. Tax Dollar Go?
-

 Green2 weeks ago
Ranked: Top Countries by Total Forest Loss Since 2001