Misc
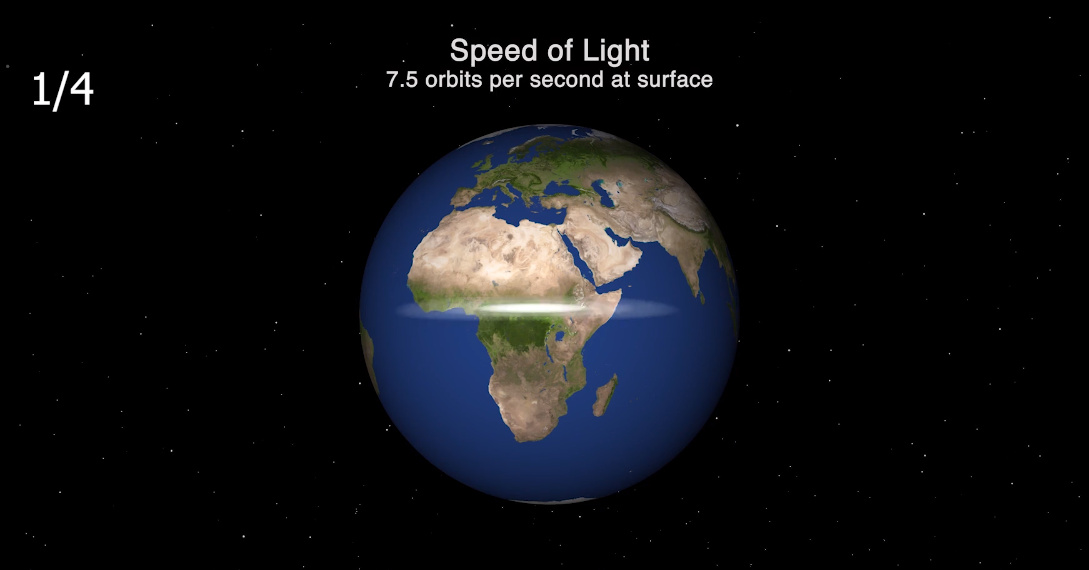
Visualizing the Speed of Light (Fast, but Slow)
Visualizing the Speed of Light
With the flip of a switch, your room can be instantenously flooded with brightness.
In fact, there is no noticeable lag effect at all.
That’s because emitted photons travel at 186,000 miles (300,000 km) per second, meaning it takes only 1/500,000th of a second for light to reach even the furthest part of an ordinary room. And, if it could go through the wall, it would orbit the entire planet 7.5 times in just one second.
Light Speed is Fast…
In our every day experiences, we never see light as having to “take time” to do anything. It’s inconceivably fast, brightening up everything in its path in an instant — and with a few odd caveats, scientists believe light speed to be the fastest-known achievable pace in the universe.
But what if we get out of our bubble, and look at light from outside the confines of life on Earth?
Today’s animation, which comes from planetary scientist Dr. James O’Donoghue, helps visualize the speed of light in a broader context. It helps remind us of the mechanics of this incredible phenomenon, while also highlighting the vast distances between celestial bodies — even in our small and insignificant corner of the solar system.
Light Speed is Slow…
Once a photon is sent into the vast abyss, suddenly the fastest possible speed seems somewhat pedestrian.
- Moon: It takes about 1.255 seconds for light to get from Earth to the moon.
- Mars: Mars is about 150x further than the moon — about 40 million miles (54.6 million km) in the closest approach — so it takes 3 minutes to get there from Earth.
- Sun: The sun is 93 million miles (150 million km) away, meaning it takes 8 minutes to see its light.
Let that sink in for a moment: the sun could explode right now, and we wouldn’t even know about it for eight long minutes.
Going Further, Taking Longer
If it takes light a few minutes to get to the closest planets, how long does it take for light to travel further away from Earth?
- Jupiter: The largest planet is 629 million km away when it’s closest, taking light about 35 minutes.
- Saturn: The ringed planet is about as twice as far as Jupiter, taking light 71 minutes.
- Pluto: It takes about 5.5 hours for light to go from Earth to the dwarf planet.
- Alpha Centauri: The nearest star system is 4.3 light years away, or 25 trillion miles (40 trillion km).
- Visible stars: The average distance to the 300 brightest stars in the sky is about 347 light years.
If you really want to get the feeling of how “slow” light really is, watch the below video and journey from the sun to Jupiter. It’s done in real-time, so it takes about 43 minutes:
So while light obviously travels at a ludicrous speed, it really depends on your vantage point.
On Earth, light is instantaneous – but anywhere else in the universe, it’s pretty inadequate for getting anywhere far (especially in contrast to the average human lifespan).


Misc
How Hard Is It to Get Into an Ivy League School?
We detail the admission rates and average annual cost for Ivy League schools, as well as the median SAT scores required to be accepted.


How Hard Is It to Get Into an Ivy League School?
This was originally posted on our Voronoi app. Download the app for free on iOS or Android and discover incredible data-driven charts from a variety of trusted sources.
Ivy League institutions are renowned worldwide for their academic excellence and long-standing traditions. But how hard is it to get into one of the top universities in the U.S.?
In this graphic, we detail the admission rates and average annual cost for Ivy League schools, as well as the median SAT scores required to be accepted. The data comes from the National Center for Education Statistics and was compiled by 24/7 Wall St.
Note that “average annual cost” represents the net price a student pays after subtracting the average value of grants and/or scholarships received.
Harvard is the Most Selective
The SAT is a standardized test commonly used for college admissions in the United States. It’s taken by high school juniors and seniors to assess their readiness for college-level academic work.
When comparing SAT scores, Harvard and Dartmouth are among the most challenging universities to gain admission to. The median SAT scores for their students are 760 for reading and writing and 790 for math. Still, Harvard has half the admission rate (3.2%) compared to Dartmouth (6.4%).
| School | Admission rate (%) | SAT Score: Reading & Writing | SAT Score: Math | Avg Annual Cost* |
|---|---|---|---|---|
| Harvard University | 3.2 | 760 | 790 | $13,259 |
| Columbia University | 3.9 | 750 | 780 | $12,836 |
| Yale University | 4.6 | 760 | 780 | $16,341 |
| Brown University | 5.1 | 760 | 780 | $26,308 |
| Princeton University | 5.7 | 760 | 780 | $11,080 |
| Dartmouth College | 6.4 | 760 | 790 | $33,023 |
| University of Pennsylvania | 6.5 | 750 | 790 | $14,851 |
| Cornell University | 7.5 | 750 | 780 | $29,011 |
*Costs after receiving federal financial aid.
Additionally, Dartmouth has the highest average annual cost at $33,000. Princeton has the lowest at $11,100.
While student debt has surged in the United States in recent years, hitting $1.73 trillion in 2023, the worth of obtaining a degree from any of the schools listed surpasses mere academics. This is evidenced by the substantial incomes earned by former students.
Harvard grads, for example, have the highest average starting salary in the country, at $91,700.

-

 Maps2 weeks ago
Mapped: Average Wages Across Europe
-

 Money1 week ago
Which States Have the Highest Minimum Wage in America?
-

 Real Estate1 week ago
Ranked: The Most Valuable Housing Markets in America
-

 Markets1 week ago
Charted: Big Four Market Share by S&P 500 Audits
-

 AI1 week ago
The Stock Performance of U.S. Chipmakers So Far in 2024
-

 Automotive2 weeks ago
Almost Every EV Stock is Down After Q1 2024
-

 Money2 weeks ago
Where Does One U.S. Tax Dollar Go?
-

 Green2 weeks ago
Ranked: Top Countries by Total Forest Loss Since 2001