Real Estate
A Century of New York City’s Evolving Skyline
View a high resolution version of this graphic.
A Century of New York City’s Evolving Skyline
View the high resolution version of today’s graphic by clicking here.
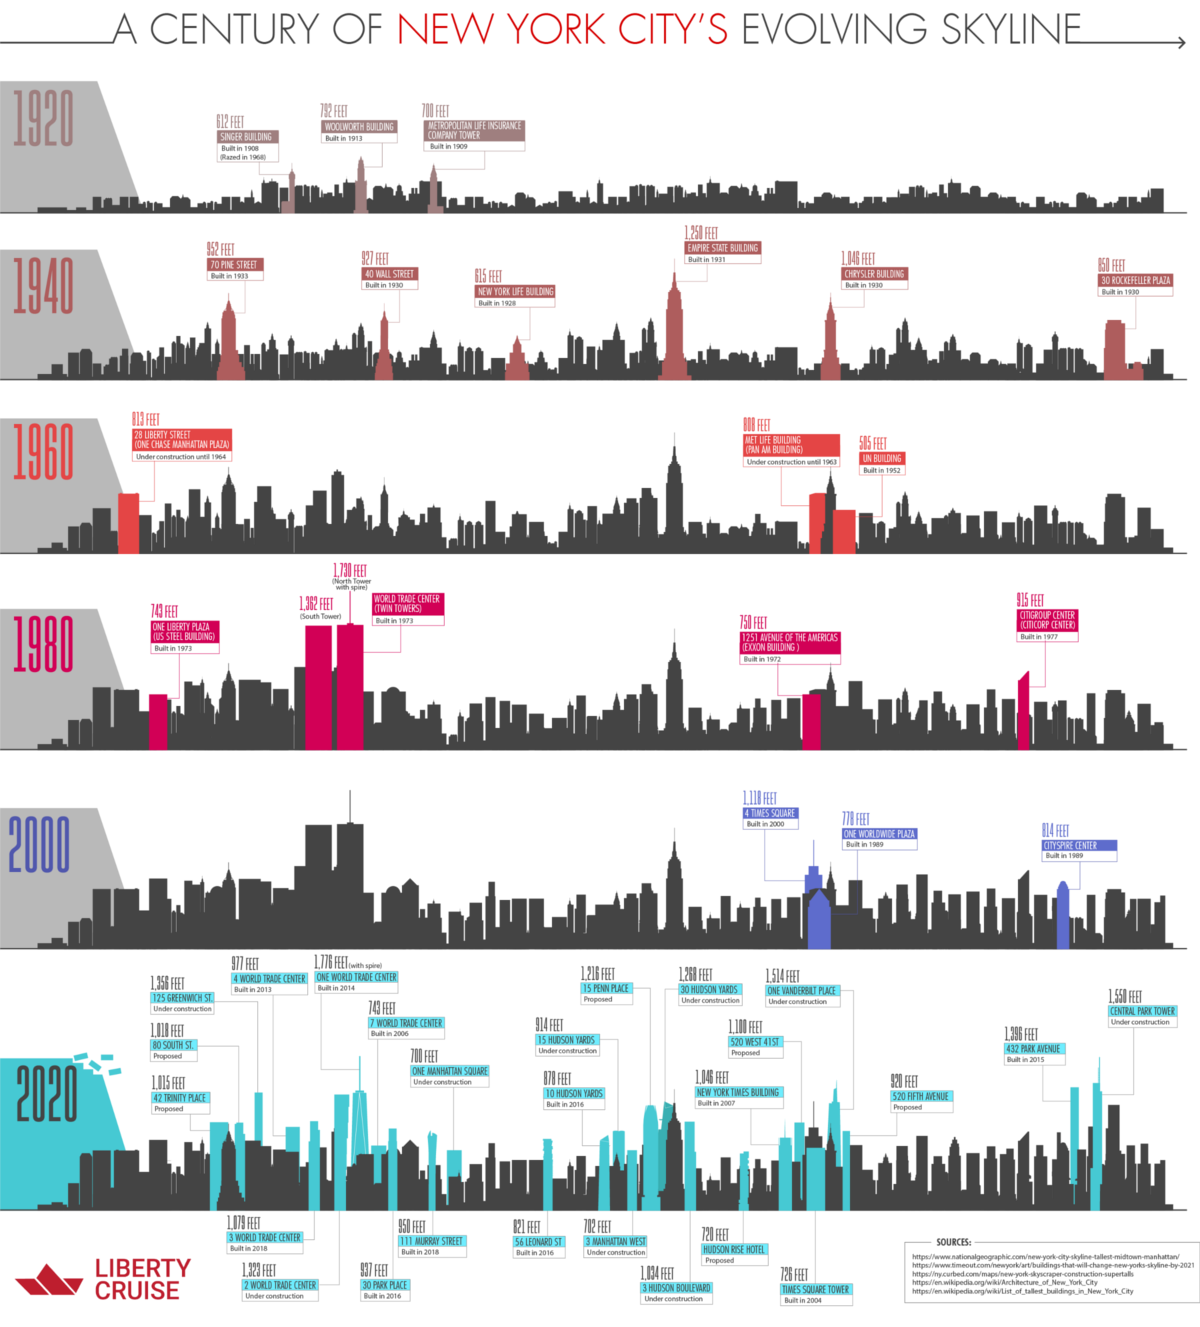
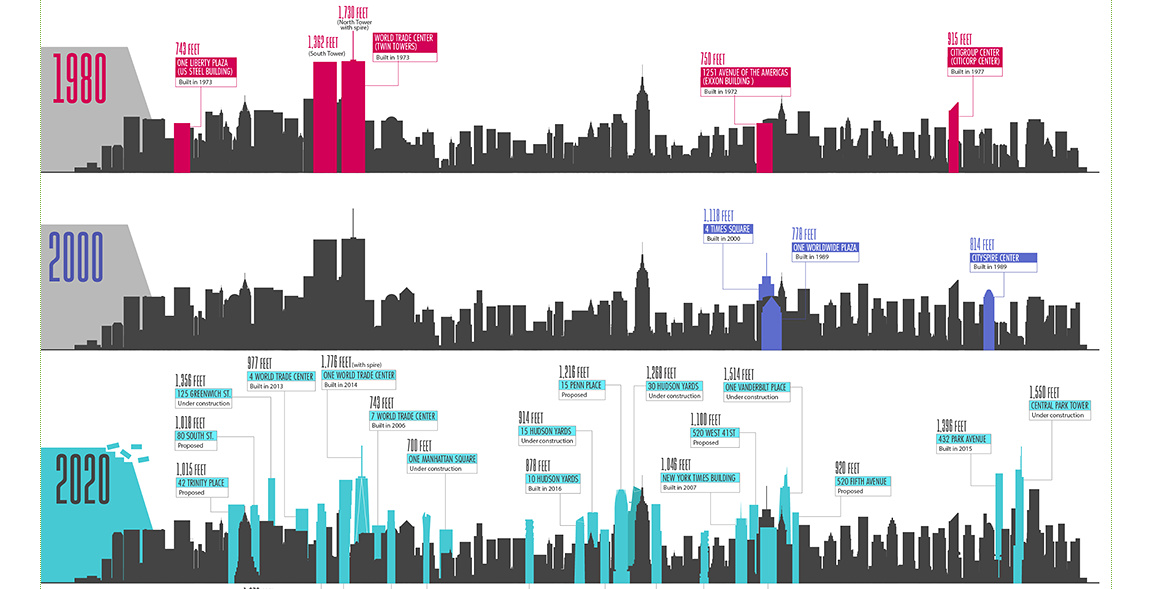
Over New York City’s storied history, the skyline has evolved constantly.
Smoke stacks and cathedral spires were gradually eclipsed by the stately office towers of “Newspaper Row”, and iconic skyscrapers like the Chrysler Building soon shared the skyline with monolithic towers in the international style.
Today’s infographic comes to us from Liberty Cruise NYC and it charts this evolution over the last century, while highlighting just how dramatically the cityscape is set to change by 2020.
The Early History of Skyscrapers
For decades, the ornate spire of Trinity Church towered over Lower Manhattan. It wasn’t until the late-1800s when technology and economic might converged to produce the first modern towers.
The city’s first cluster of tall buildings appeared around City Hall, as newspapers competed to see who could build the most grand headquarters. One of the more ambitious projects in this wave of development was the New York World Building (1890), which held the title as the tallest skyscraper in the world.
In 1908, the ante was upped further after the completion of the 47-storey headquarters of the Singer Sewing Machine Company and the 50-storey Metropolitan Life Tower. NYC was slower than its rival, Chicago, in adopting skeleton-frame construction techniques, but once that door was open, height records were eclipsed every few years.
From ’20s to zero
The roaring ’20s ushered in a new age of skyscrapers in New York City that only picked up steam heading into the 1930s. Not only was the economy booming, but the United States had recently became one of the first countries in the world to have a majority-urban population. Manhattan was a magnet for growth, and its extreme population density left only one direction to grow: skyward.
A number of iconic landmarks were constructed in this era, including the Empire State and Chrysler Buildings.
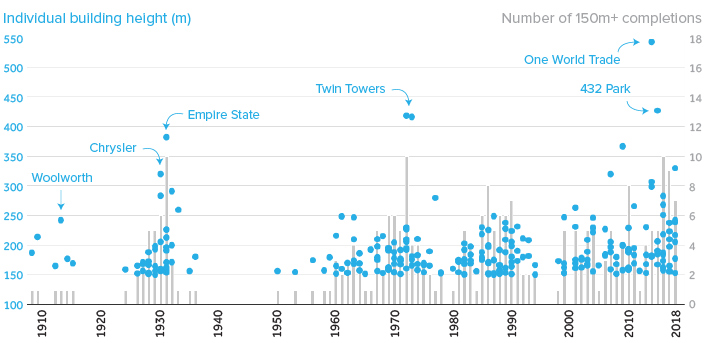
As the chart above clearly illustrates, the onset of the Great Depression had a pronounced cooling effect on construction in New York City. For more than a decade, no new 150m+ towers were added to the city’s skyline.
New York Today
The world has changed a lot since the ribbon was cut in front of the Empire State Building. Flagship skyscrapers have grown taller than we ever could’ve imagined, and relentless development has completely transformed places like Dubai and Shenzhen. Even so, New York City is still home to more 100m+ buildings than any other city on Earth.
It’s also worth mentioning that New York City found itself back in the top 10 tallest buildings list after the completion of One World Trade Center in 2014.
What the Future Holds
New York City’s skyline is packed with recognizable towers, but for a long time, few new projects challenged the vertical supremacy of buildings like MetLife or Empire State. Today – thanks to engineering innovations and acquisition of “air rights” on neighboring plots – the skyline is undergoing a dramatic transformation.
Powered by a healthy ultra-high-end real estate market, slender skyscrapers are rising above the skyline.
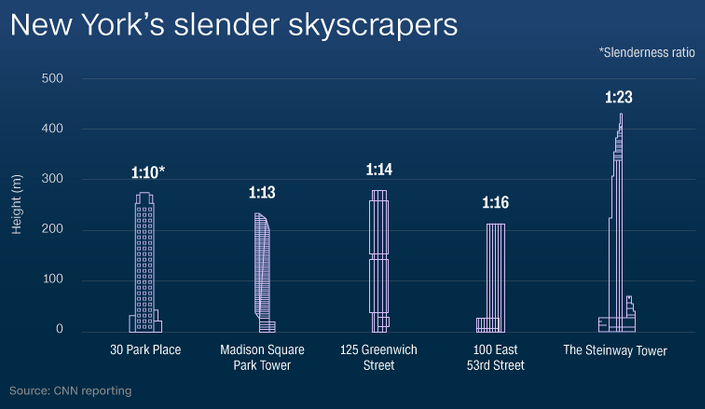
This style of building uses a small land footprint so effectively, that projects are springing up around the city. According to Skyscraper Center, there are 86 skyscrapers under construction or planned, with 10 projects set to surpass the height of the Chrysler Building.
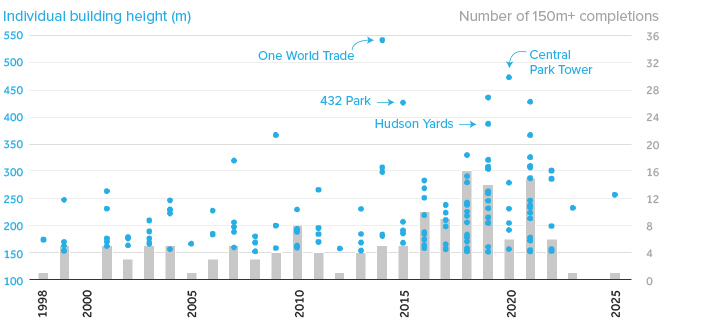
While this level of construction is dwarfed by activity in fast-growing metropolises in China, this new generation of high-visibility towers is a sign that the Big Apple is still a strong draw for the world’s ultra-wealthy.


Real Estate
Ranked: The Most Valuable Housing Markets in America
The U.S. residential real estate market is worth a staggering $47.5 trillion. Here are the most valuable housing markets in the country.
The Most Valuable Housing Markets in America
This was originally posted on our Voronoi app. Download the app for free on iOS or Android and discover incredible data-driven charts from a variety of trusted sources.
The residential real estate market in the U.S. stands as one of the largest asset classes in the country, worth $47.5 trillion in 2023.
Despite a slowdown in home sales, the total value of homes increased $2.4 trillion last year as low inventory levels pushed up prices. Affordable metropolitan areas saw steady price growth, while expensive metros experienced slower price appreciation.
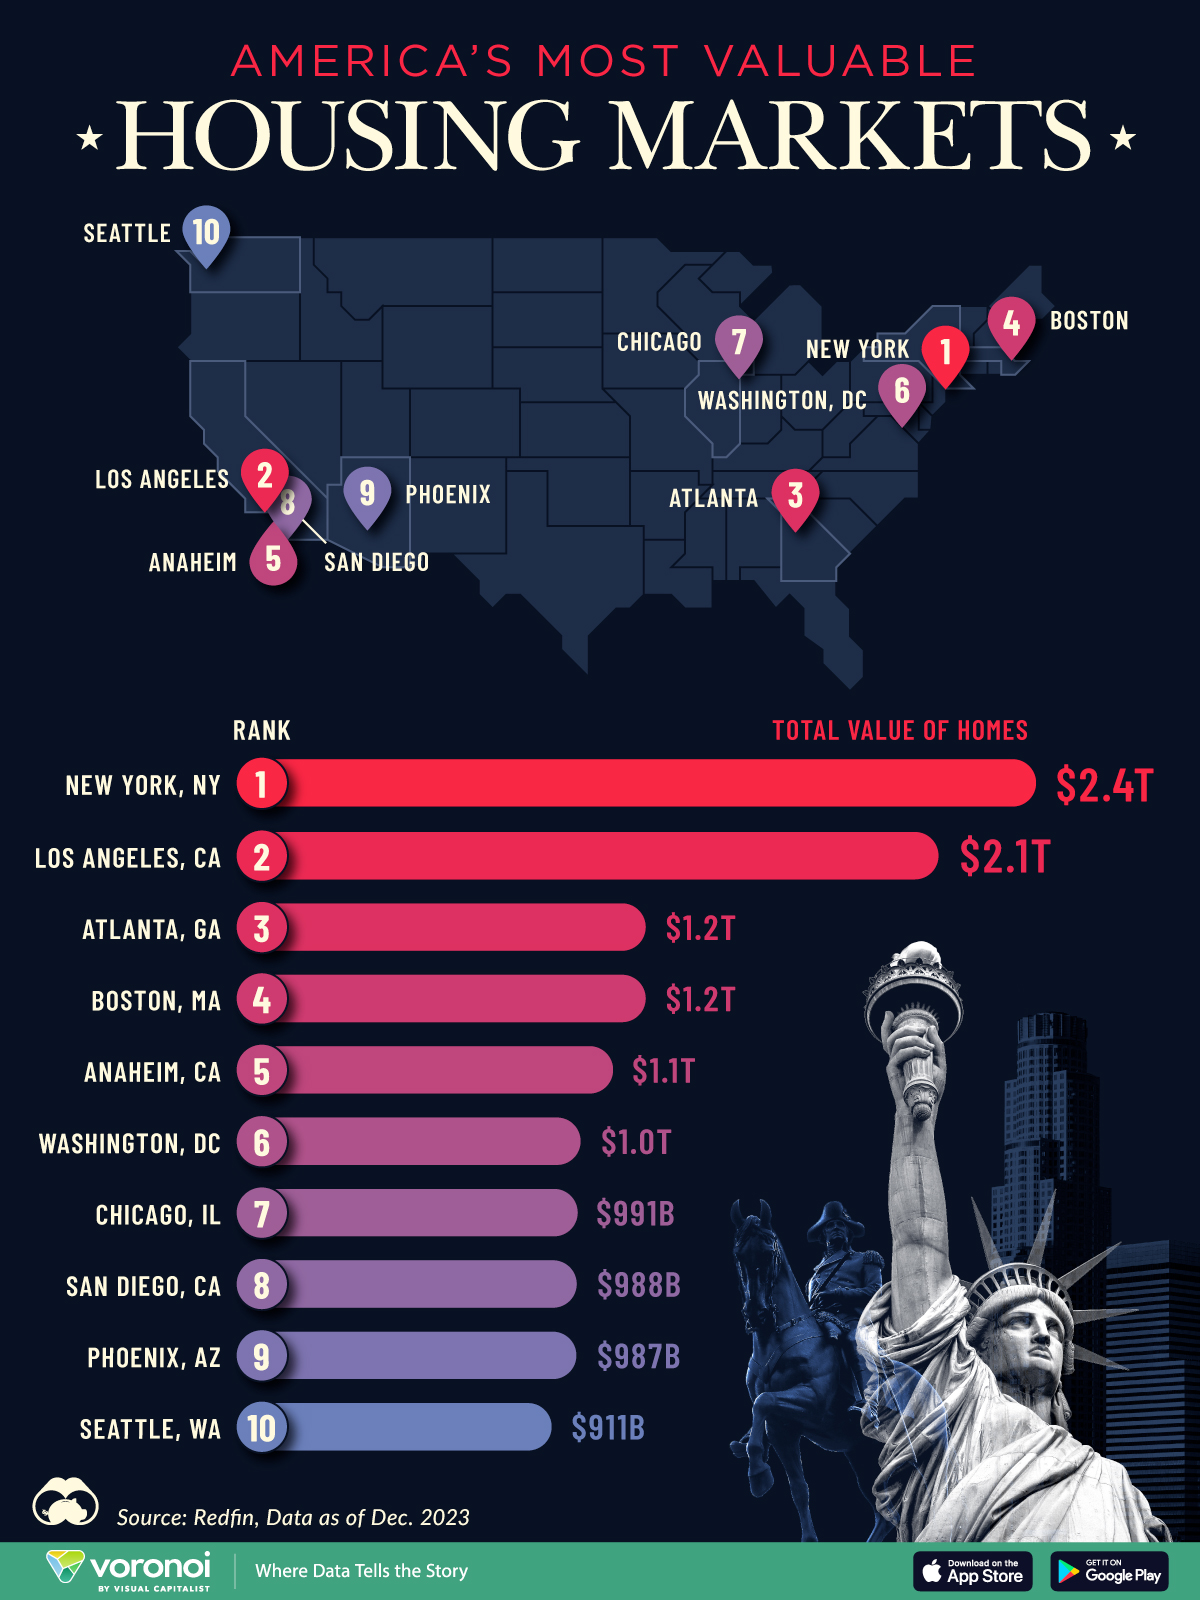
This graphic shows America’s most valuable housing markets, using data from Redfin.
Top U.S. Residential Real Estate Markets
To calculate the largest U.S. housing markets, Redfin analyzed 90 million properties covering single-family homes, townhouses, condos, and two-to four-unit multifamily properties.
Below, we show the most valuable residential markets as of December 2023:
| Rank | U.S. Metro | Total Value of Homes | Total Value of Homes YoY Change |
|---|---|---|---|
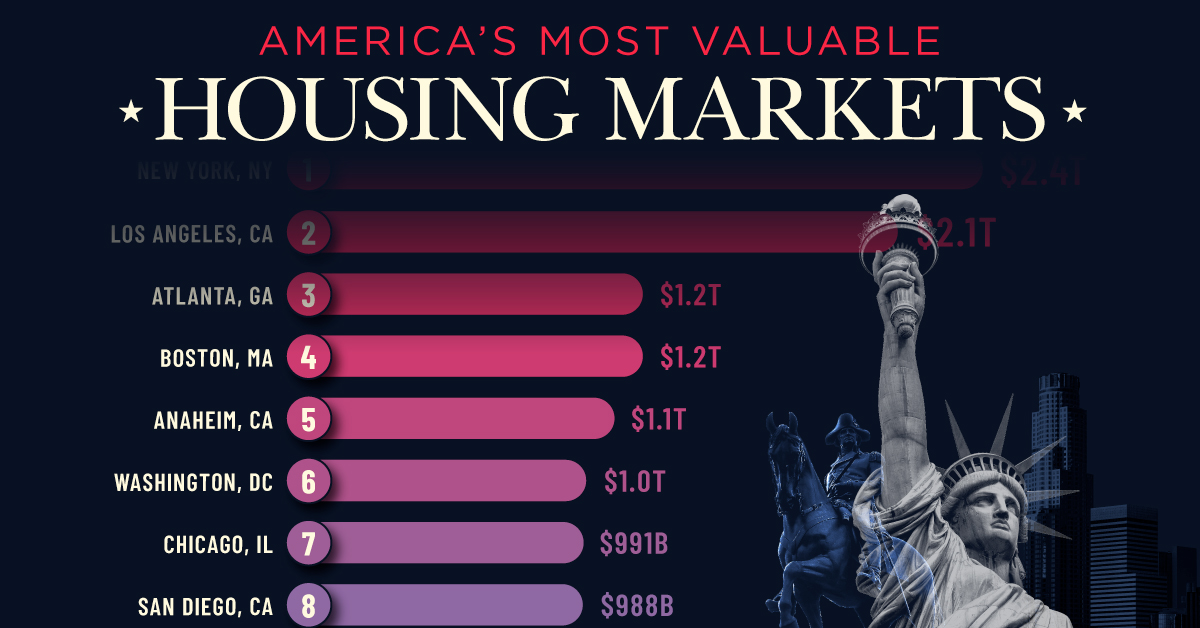
| 1 | New York, NY | $2.4T | -1.0% |
| 2 | Los Angeles, CA | $2.1T | +4.3% |
| 3 | Atlanta, GA | $1.2T | +6.2% |
| 4 | Boston, MA | $1.2T | +8.3% |
| 5 | Anaheim, CA | $1.1T | +8.0% |
| 6 | Washington, DC | $1.0T | +6.2% |
| 7 | Chicago, IL | $991B | +7.4% |
| 8 | San Diego, CA | $988B | +9.4% |
| 9 | Phoenix, AZ | $987B | +4.2% |
| 10 | Seattle, WA | $911B | +4.6% |
With a housing market worth $2.4 trillion, New York, NY tops the list.
Unlike the majority of large U.S. cities, the aggregate value of homes declined as buyers became increasingly priced out of the market. At the same time, homeowners hesitated to sell in order to lock in low mortgage rates. In fact, more than 80% of mortgage holders in New York City have interest rates that are 5% or lower.
Los Angeles, CA falls in second, with a residential real estate market worth $2.0 trillion. Last year, existing home sales tumbled 24.8%, falling to the lowest point since 2007. However, the housing shortage led prices to increase amid high demand. The median sale price climbed to $975,000 in February 2024, a 5.9% jump compared to the same time last year.
Atlanta, GA ranks third and is the most overpriced housing market in the country according to one countrywide analysis. Homes have been selling for 41.7% more than their worth as of the February 2024 data update.
People are flocking to the city for many reasons. General housing affordability is a major driver, along with its thriving tech center. Along with this, state tax credits have increasingly made it a hub for the TV and film industries, earning it the moniker “Y’allywood”. Another factor in Atlanta’s inflating housing market are large investment firms, which own a huge footprint of homes in the city.
Editor’s note: For those wondering about the Bay Area, the data groups cities like San Francisco ($657 billion), San Jose ($821 billion), and Oakland ($881 billion) as individual entities, which puts them outside the cutoff. See the Redfin data for the full list of cities.

-

 Maps1 week ago
The Largest Earthquakes in the New York Area (1970-2024)
-

 Money2 weeks ago
Where Does One U.S. Tax Dollar Go?
-

 Automotive2 weeks ago
Almost Every EV Stock is Down After Q1 2024
-

 AI2 weeks ago
The Stock Performance of U.S. Chipmakers So Far in 2024
-

 Markets2 weeks ago
Charted: Big Four Market Share by S&P 500 Audits
-

 Real Estate2 weeks ago
Ranked: The Most Valuable Housing Markets in America
-

 Money2 weeks ago
Which States Have the Highest Minimum Wage in America?
-

 AI2 weeks ago
Ranked: Semiconductor Companies by Industry Revenue Share