Green
Mapping the Flow of the World’s Plastic Waste
Mapping the Flow of the World’s Plastic Waste
The first plastic material, Bakelite, was invented in 1907. It made its way into everything you can imagine: telephones, chess pieces, Chanel jewelry, and electric guitars.
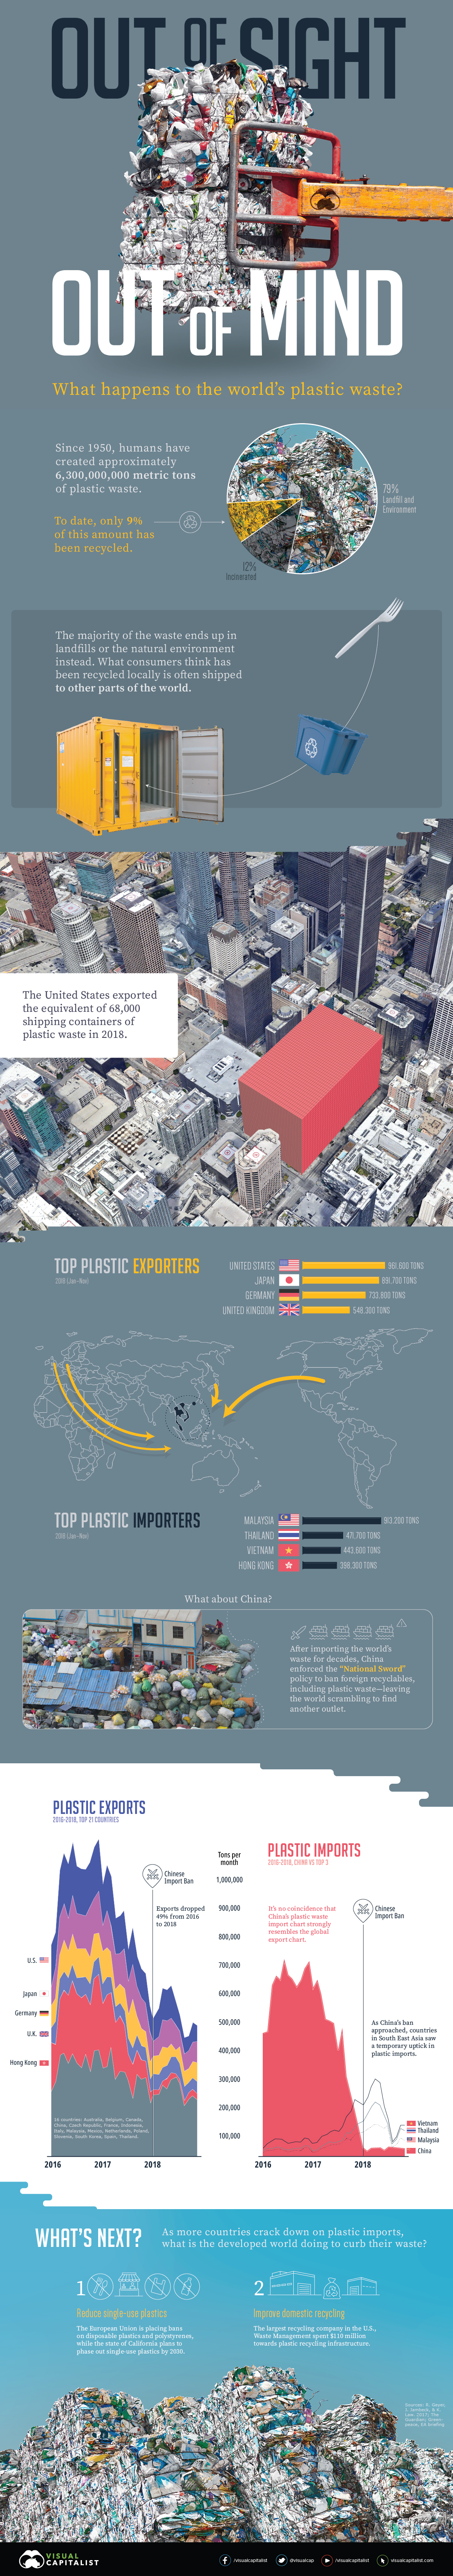
But it was in 1950 that our thirst for plastic truly began. In just 65 years, plastic production soared almost 200 times, resulting in about 6,300 million metric tons of waste today.
How does the world deal with this much debris? The truth is, a lot of plastic waste—both trash and recycled materials—is often shipped overseas to become someone else’s problem.
The Top Exporters and Importers of Plastic Waste
In honor of International Plastic Bag-Free day, today’s graphic uses data from The Guardian to uncover where the world’s plastic waste comes from, and who receives the bulk of these flows.
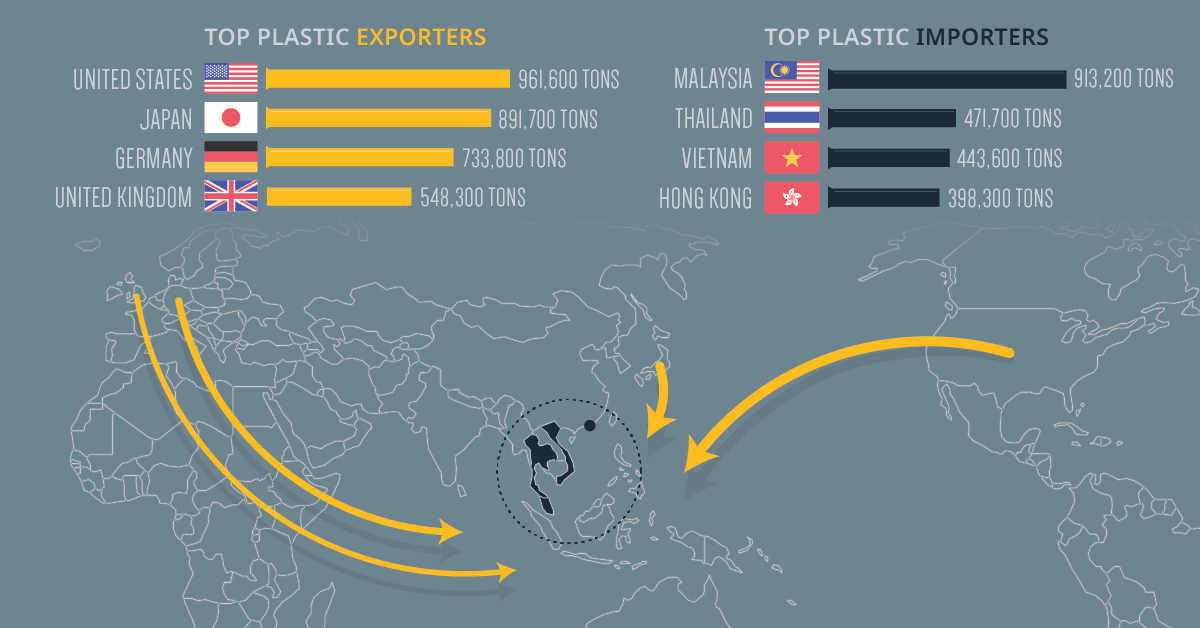
| Top Exporters, Jan-Nov 2018 | Top Importers, Jan-Nov 2018 | ||
|---|---|---|---|
| 🇺🇸 United States | 961,563 tons | 🇲🇾 Malaysia | 913,165 tons |
| 🇯🇵 Japan | 891,719 tons | 🇹🇭 Thailand | 471,724 tons |
| 🇩🇪 Germany | 733,756 tons | 🇻🇳 Vietnam | 443,615 tons |
| 🇬🇧 United Kingdom | 548,256 tons | 🇭🇰 Hong Kong | 398,261 tons |
The U.S. could fill up 68,000 shipping containers with its annual plastic waste exports. Put another way, 6,000 blue whales would weigh less than this nearly one million tons of waste exports.
Given the amount of plastic which ends up in our oceans, this comparison is just cause for alarm. But one interesting thing to note is that overall totals have halved since 2016:
- Top 21 total exports (Jan-Nov 2016): 11,342,439 tons
- Top 21 total exports (Jan-Nov 2018): 5,828,257 tons
- Percentage change (2016 to 2018): -49%
The world didn’t suddenly stop producing plastic waste overnight. So what caused the decline?
China Cuts Ties with International Plastic Imports
Over recent years, the trajectory of plastic exports has mimicked the movement of plastic waste into China, including the steep plummet that starts in 2018. After being the world’s dumping ground for decades, China enacted a new policy, dubbed “National Sword”, to ban foreign recyclables. The ban, which includes plastics, has left the world scrambling to find other outlets for its waste.
In response, top exporters quickly turned to other countries in Southeast Asia, such as Malaysia, Vietnam, and Thailand.
That didn’t completely stop plastic waste from seeping through, though. China previously imported 600,000 tons of plastic monthly, but since the policy only restricted 24 types of solid waste, 30,000 tons per month still entered the country post-ban, primarily from these countries:
- 🇮🇩 Indonesia: 7,000 tons per month
- 🇲🇾 Malaysia: 6,000 tons per month
- 🇺🇸 United States: 5,500 tons per month
- 🇯🇵 Japan: 4,000 tons per month
Many countries bearing the load of the world’s garbage are planning to follow in China’s footsteps and issue embargoes of their own. What does that mean for the future?
Recycle and Reuse; But Above All, Reduce
The immense amounts of plastic waste sent overseas include recycled and recyclable materials. That’s because most countries don’t have the means to manage their recycling properly, contrary to public belief. What is being done to mitigate waste in the future?
- Improve domestic recycling
Waste Management is the largest recycling company in the United States. In 2018, it put $110 million towards building more plastic recycling infrastructure.
Meanwhile, tech giant Amazon invested $10 million in a fund that creates recycling infrastructure and services in different cities. - Reduce single-use plastics
Recycling on its own may not be enough, which is why countries are thinking bigger to cut down on “throwaway” culture.
The European Union passed a directive to ban disposable plastics and polystyrene “clamshell” containers, among other items, by 2021. More recently, California passed an ambitious bill to phase out single-use plastics by 2030.


Green
The Carbon Footprint of Major Travel Methods
Going on a cruise ship and flying domestically are the most carbon-intensive travel methods.


The Carbon Footprint of Major Travel Methods
This was originally posted on our Voronoi app. Download the app for free on iOS or Android and discover incredible data-driven charts from a variety of trusted sources.
Did you know that transport accounts for nearly one-quarter of global energy-related carbon dioxide (CO₂) emissions?
This graphic illustrates the carbon footprints of major travel methods measured in grams of carbon dioxide equivalent (CO₂e) emitted per person to travel one kilometer. This includes both CO₂ and other greenhouse gases.
Data is sourced from Our World in Data, the UK Government’s Department for Energy Security and Net Zero, and The International Council on Clean Transportation, as of December 2022.
These figures should be interpreted as approximations, rather than exact numbers. There are many variables at play that determine the actual carbon footprint in any individual case, including vehicle type or model, occupancy, energy mix, and even weather.
Cruise Ships are the Most Carbon-Intensive Travel Method
According to these estimates, taking a cruise ship, flying domestically, and driving alone are some of the most carbon-intensive travel methods.
Cruise ships typically use heavy fuel oil, which is high in carbon content. The average cruise ship weighs between 70,000 to 180,000 metric tons, meaning they require large engines to get moving.
These massive vessels must also generate power for onboard amenities such as lighting, air conditioning, and entertainment systems.
Short-haul flights are also considered carbon-intensive due to the significant amount of fuel consumed during initial takeoff and climbing altitude, relative to a lower amount of cruising.
| Transportation method | CO₂ equivalent emissions per passenger km |
|---|---|
| Cruise Ship | 250 |
| Short-haul flight (i.e. within a U.S. state or European country) | 246 |
| Diesel car | 171 |
| Gas car | 170 |
| Medium-haul flight (i.e. international travel within Europe, or between U.S. states) | 151 |
| Long-haul flight (over 3,700 km, about the distance from LA to NY) | 147 |
| Motorbike | 113 |
| Bus (average) | 96 |
| Plug-in hybrid | 68 |
| Electric car | 47 |
| National rail | 35 |
| Tram | 28 |
| London Underground | 27 |
| Ferry (foot passenger) | 19 |
| Eurostar (International rail) | 4.5 |
Are EVs Greener?
Many experts agree that EVs produce a lower carbon footprint over time versus traditional internal combustion engine (ICE) vehicles.
However, the batteries in electric vehicles charge on the power that comes straight off the electrical grid—which in many places may be powered by fossil fuels. For that reason, the carbon footprint of an EV will depend largely on the blend of electricity sources used for charging.
There are also questions about how energy-intensive it is to build EVs compared to a comparable ICE vehicle.

-

 Debt1 week ago
How Debt-to-GDP Ratios Have Changed Since 2000
-

 Markets2 weeks ago
Ranked: The World’s Top Flight Routes, by Revenue
-

 Countries2 weeks ago
Population Projections: The World’s 6 Largest Countries in 2075
-

 Markets2 weeks ago
The Top 10 States by Real GDP Growth in 2023
-

 Demographics2 weeks ago
The Smallest Gender Wage Gaps in OECD Countries
-

 United States2 weeks ago
Where U.S. Inflation Hit the Hardest in March 2024
-

 Green2 weeks ago
Top Countries By Forest Growth Since 2001
-

 United States2 weeks ago
Ranked: The Largest U.S. Corporations by Number of Employees