Green
Visualizing the World’s Top Plastic Emitting Rivers
View a high resolution version of this graphic.
Visualizing the World’s Top Plastic Emitting Rivers
Every year, approximately eight million metric tons of plastic enters the world’s oceans – the equivalent of one garbage truck of plastic every single minute.
Every plastic fork and bottle cap bobbing along the surface of the ocean has made its way to the ocean from dry land at some point. As it turns out, the hydrological cycle that keeps water circulating around the planet is also an effective means for trash to hitch a ride from our riverside cities to the open ocean.
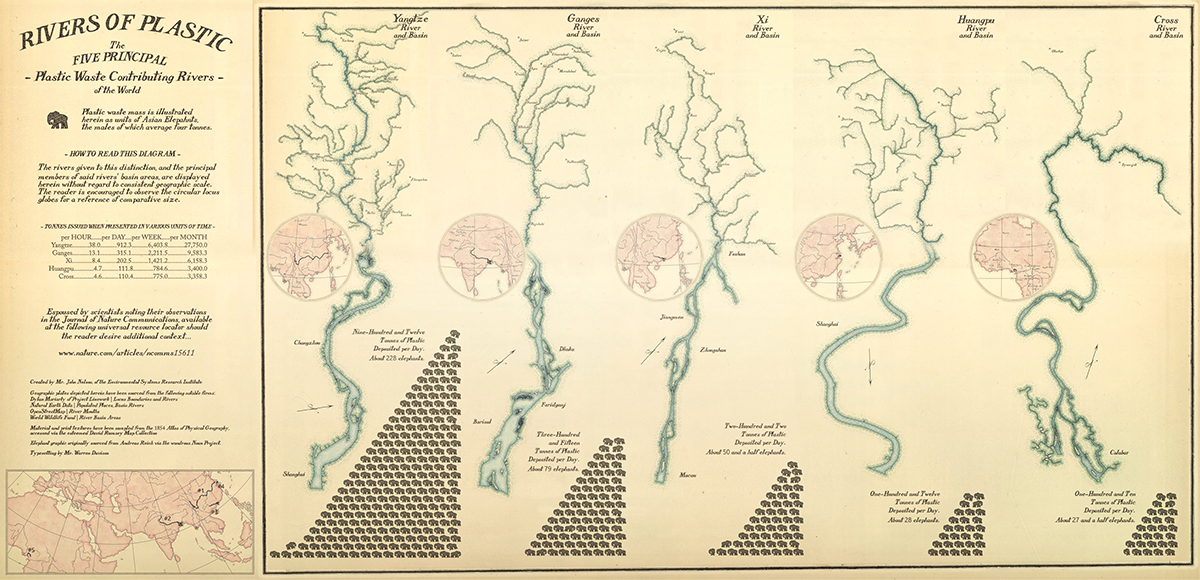
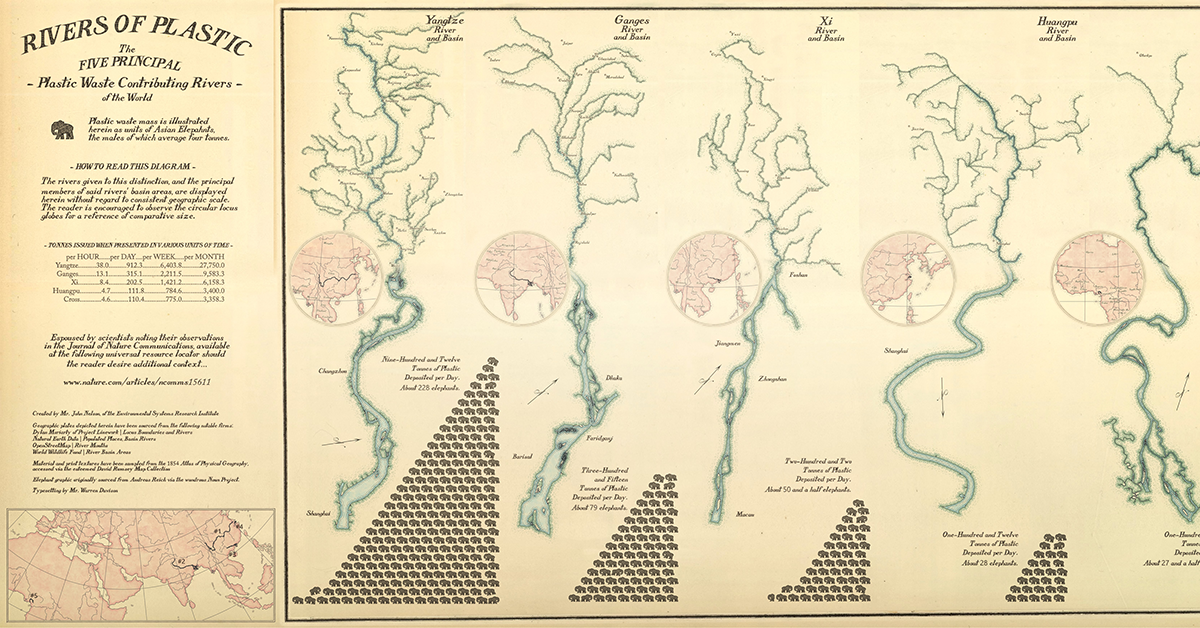
As today’s unique, vintage-themed map – via John Nelson at ESRI – visualizes the shocking amount of plastic emitted by major rivers in the world.
Plastic Superhighways
It would be hard to overstate plastic’s influence on modern life.
Unfortunately, when plastic is finished doing it’s job, only 10% of it ends up being recycled. Instead, much of the 300 million tonnes of plastic produced each year ends up in the ocean, congregating in places like the Pacific Garbage Patch.
Plastic discharge is especially pronounced in large population centers along large rivers – particularly in rapidly urbanizing regions in China, Indonesia, and Nigeria.
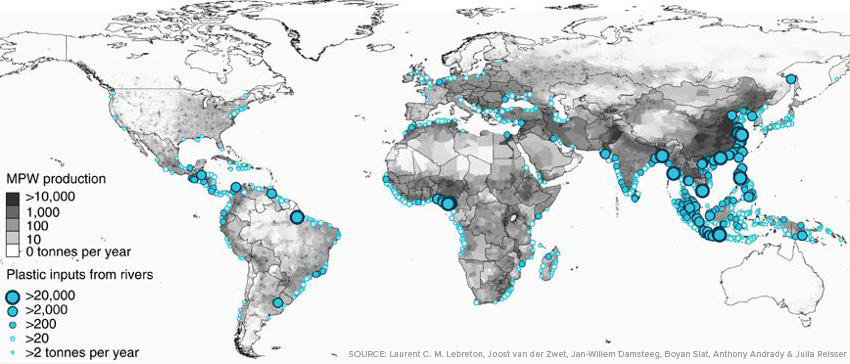
Waste management practices are limited to non-existent in many of Asia’s fast-growing urban areas, so it comes as little surprise that 14 to the top 20 plastic emitting rivers are located on that continent.
The mighty Yangtze – China’s largest river – supports a population of over 400 million people and is the most prolific emitter of plastic waste on the planet. Over 1.5 million metric tons of plastic is unleashed into the Yellow Sea from the river each year.
Stemming the Tide
Plastic emissions data makes one point clear – China is the key to decreasing the volume of trash entering our ocean ecosystems.
The good news is that the Chinese government has recognized the problem, mandating garbage sorting in nearly 50 cities and setting a target for at 35% recycling rate by 2020. A positive first step in the battle to stem the tide of plastic entering ocean systems.


Green
The Carbon Footprint of Major Travel Methods
Going on a cruise ship and flying domestically are the most carbon-intensive travel methods.


The Carbon Footprint of Major Travel Methods
This was originally posted on our Voronoi app. Download the app for free on iOS or Android and discover incredible data-driven charts from a variety of trusted sources.
Did you know that transport accounts for nearly one-quarter of global energy-related carbon dioxide (CO₂) emissions?
This graphic illustrates the carbon footprints of major travel methods measured in grams of carbon dioxide equivalent (CO₂e) emitted per person to travel one kilometer. This includes both CO₂ and other greenhouse gases.
Data is sourced from Our World in Data, the UK Government’s Department for Energy Security and Net Zero, and The International Council on Clean Transportation, as of December 2022.
These figures should be interpreted as approximations, rather than exact numbers. There are many variables at play that determine the actual carbon footprint in any individual case, including vehicle type or model, occupancy, energy mix, and even weather.
Cruise Ships are the Most Carbon-Intensive Travel Method
According to these estimates, taking a cruise ship, flying domestically, and driving alone are some of the most carbon-intensive travel methods.
Cruise ships typically use heavy fuel oil, which is high in carbon content. The average cruise ship weighs between 70,000 to 180,000 metric tons, meaning they require large engines to get moving.
These massive vessels must also generate power for onboard amenities such as lighting, air conditioning, and entertainment systems.
Short-haul flights are also considered carbon-intensive due to the significant amount of fuel consumed during initial takeoff and climbing altitude, relative to a lower amount of cruising.
| Transportation method | CO₂ equivalent emissions per passenger km |
|---|---|
| Cruise Ship | 250 |
| Short-haul flight (i.e. within a U.S. state or European country) | 246 |
| Diesel car | 171 |
| Gas car | 170 |
| Medium-haul flight (i.e. international travel within Europe, or between U.S. states) | 151 |
| Long-haul flight (over 3,700 km, about the distance from LA to NY) | 147 |
| Motorbike | 113 |
| Bus (average) | 96 |
| Plug-in hybrid | 68 |
| Electric car | 47 |
| National rail | 35 |
| Tram | 28 |
| London Underground | 27 |
| Ferry (foot passenger) | 19 |
| Eurostar (International rail) | 4.5 |
Are EVs Greener?
Many experts agree that EVs produce a lower carbon footprint over time versus traditional internal combustion engine (ICE) vehicles.
However, the batteries in electric vehicles charge on the power that comes straight off the electrical grid—which in many places may be powered by fossil fuels. For that reason, the carbon footprint of an EV will depend largely on the blend of electricity sources used for charging.
There are also questions about how energy-intensive it is to build EVs compared to a comparable ICE vehicle.

-

 Education1 week ago
How Hard Is It to Get Into an Ivy League School?
-

 Technology2 weeks ago
Ranked: Semiconductor Companies by Industry Revenue Share
-

 Markets2 weeks ago
Ranked: The World’s Top Flight Routes, by Revenue
-

 Demographics2 weeks ago
Population Projections: The World’s 6 Largest Countries in 2075
-

 Markets2 weeks ago
The Top 10 States by Real GDP Growth in 2023
-

 Demographics2 weeks ago
The Smallest Gender Wage Gaps in OECD Countries
-

 Economy2 weeks ago
Where U.S. Inflation Hit the Hardest in March 2024
-

 Green2 weeks ago
Top Countries By Forest Growth Since 2001