Misc
Upward Momentum: Charting a Year of Skyscraper Construction
Ever since the first towering spires broke through the clouds in New York and Chicago, skyscrapers have remained a potent symbol of economic might.
The tallest buildings require vast amounts of materials, expertise, and capital to make them a reality, but the cities that add these landmarks to their skylines gain prestige and send a powerful message to competing economic centers.
Skyscraper Construction in 2018
Where are the most skyscrapers popping up? Let’s take a look at regional hot-spots around the world.
Note: For the purposes of this article, “skyscraper” will refer to buildings 656 feet (200 meters) or more in height.
China is Flying High
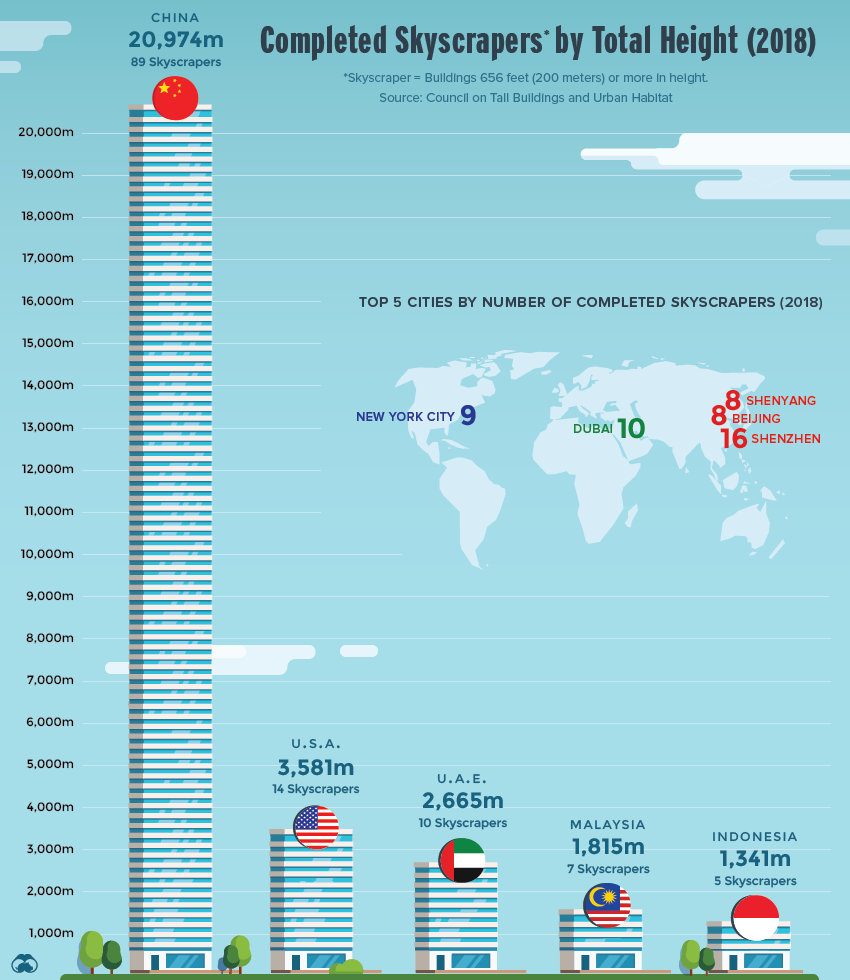
For well over two decades, China has led the world in skyscraper construction, and 2018 was no exception.
The country’s fixation on urban growth and continued economic success is producing tall buildings at a staggering rate. Last year, a mind-boggling 89 skyscrapers were completed in 28 different cities around China.
To put this building boom into perspective, China completed more skyscrapers in one year than New York City’s entire stock of 656ft and taller buildings.
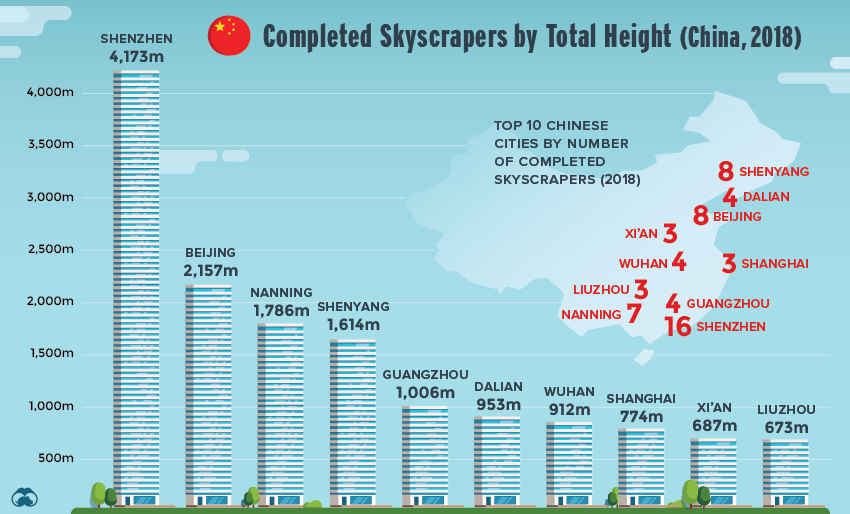
In 2018, no city reached for the stars quite like Shenzhen. The city, which is a hub of China’s high-flying tech sector, now has the second-most skyscrapers in the world, surpassed only by Dubai.
Shenzhen isn’t just building a lot of skyscrapers, it’s building extremely tall ones too.
In 2017, for example, the ribbon was cut on the massive Ping An Finance Center, which is currently the 4th tallest building in the world. Last year alone, four new towers cracked the 1,000ft (300m) barrier.
Asia, Rising
While China’s scale is hard to beat, other cities in the region are also undergoing dramatic changes, particularly in Southeast Asia. Malaysia and Indonesia completed a combined 13 new skyscrapers, and the Vincom Landmark 81 was added to Ho Chi Minh City’s growing roster of unique skyscrapers.
While there are two skyscrapers under construction in Japan – one in Tokyo and one in Yokohama – none of them were completed last year.
A New Era of American Skyscrapers
After a two-decade lull in skyscraper construction, the United States is embracing taller buildings again. Last year alone, the U.S. added 14 new skyscrapers into the mix, particularly in New York City, where construction cranes dot the horizon. In the past decade, NYC has added 25 new skyscrapers to its iconic skyline.
This trend is showing no signs of slowing down. Between now and 2022, 44 skyscraper projects are expected to be completed in the United States, with the vast majority being built in the Big Apple.


Misc
How Hard Is It to Get Into an Ivy League School?
We detail the admission rates and average annual cost for Ivy League schools, as well as the median SAT scores required to be accepted.


How Hard Is It to Get Into an Ivy League School?
This was originally posted on our Voronoi app. Download the app for free on iOS or Android and discover incredible data-driven charts from a variety of trusted sources.
Ivy League institutions are renowned worldwide for their academic excellence and long-standing traditions. But how hard is it to get into one of the top universities in the U.S.?
In this graphic, we detail the admission rates and average annual cost for Ivy League schools, as well as the median SAT scores required to be accepted. The data comes from the National Center for Education Statistics and was compiled by 24/7 Wall St.
Note that “average annual cost” represents the net price a student pays after subtracting the average value of grants and/or scholarships received.
Harvard is the Most Selective
The SAT is a standardized test commonly used for college admissions in the United States. It’s taken by high school juniors and seniors to assess their readiness for college-level academic work.
When comparing SAT scores, Harvard and Dartmouth are among the most challenging universities to gain admission to. The median SAT scores for their students are 760 for reading and writing and 790 for math. Still, Harvard has half the admission rate (3.2%) compared to Dartmouth (6.4%).
| School | Admission rate (%) | SAT Score: Reading & Writing | SAT Score: Math | Avg Annual Cost* |
|---|---|---|---|---|
| Harvard University | 3.2 | 760 | 790 | $13,259 |
| Columbia University | 3.9 | 750 | 780 | $12,836 |
| Yale University | 4.6 | 760 | 780 | $16,341 |
| Brown University | 5.1 | 760 | 780 | $26,308 |
| Princeton University | 5.7 | 760 | 780 | $11,080 |
| Dartmouth College | 6.4 | 760 | 790 | $33,023 |
| University of Pennsylvania | 6.5 | 750 | 790 | $14,851 |
| Cornell University | 7.5 | 750 | 780 | $29,011 |
*Costs after receiving federal financial aid.
Additionally, Dartmouth has the highest average annual cost at $33,000. Princeton has the lowest at $11,100.
While student debt has surged in the United States in recent years, hitting $1.73 trillion in 2023, the worth of obtaining a degree from any of the schools listed surpasses mere academics. This is evidenced by the substantial incomes earned by former students.
Harvard grads, for example, have the highest average starting salary in the country, at $91,700.

-

 Real Estate2 weeks ago
Visualizing America’s Shortage of Affordable Homes
-

 Technology1 week ago
Ranked: Semiconductor Companies by Industry Revenue Share
-

 Money1 week ago
Which States Have the Highest Minimum Wage in America?
-

 Real Estate1 week ago
Ranked: The Most Valuable Housing Markets in America
-

 Business2 weeks ago
Charted: Big Four Market Share by S&P 500 Audits
-

 AI2 weeks ago
The Stock Performance of U.S. Chipmakers So Far in 2024
-

 Misc2 weeks ago
Almost Every EV Stock is Down After Q1 2024
-

 Money2 weeks ago
Where Does One U.S. Tax Dollar Go?