Green
Visualizing EV Sales Around the World
It took five years to sell the first million electric cars. In 2018, it took only six months.
The Tesla Model 3 also passed a significant milestone in 2018, becoming the first electric vehicle (EV) to crack the 100,000 sales mark in a single year. The Nissan LEAF and BAIC EC-Series are both likely to surpass the 100,000 this year as well.
Although the electric vehicle market didn’t grow as fast as some experts initially projected, it appears that EV sales are finally hitting their stride around the world. Below are the countries where electric vehicles are a biggest part of the sales mix.
The EV Capital of the World
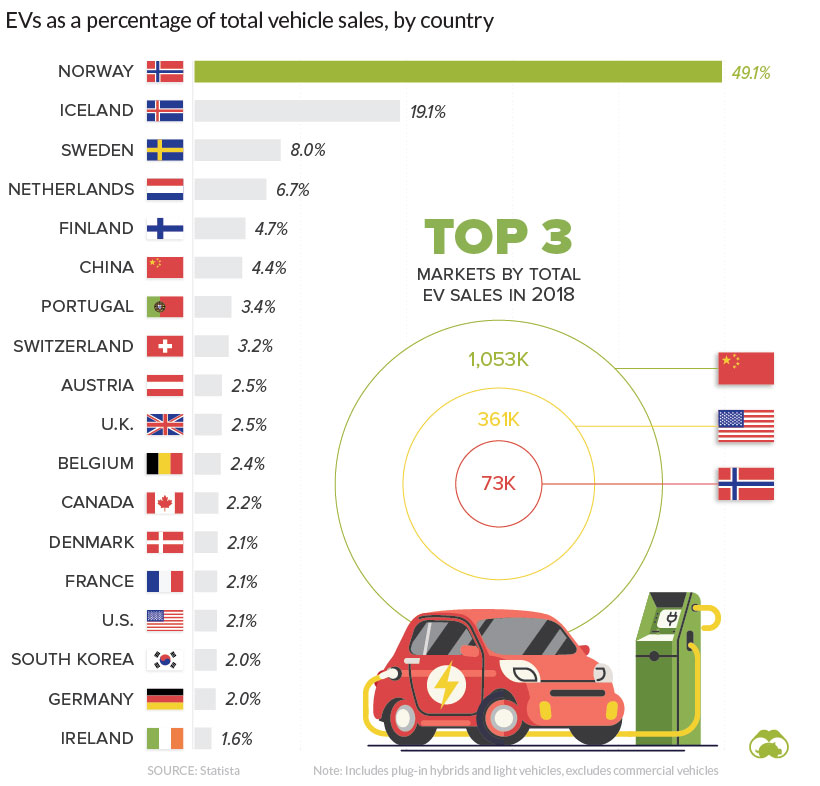
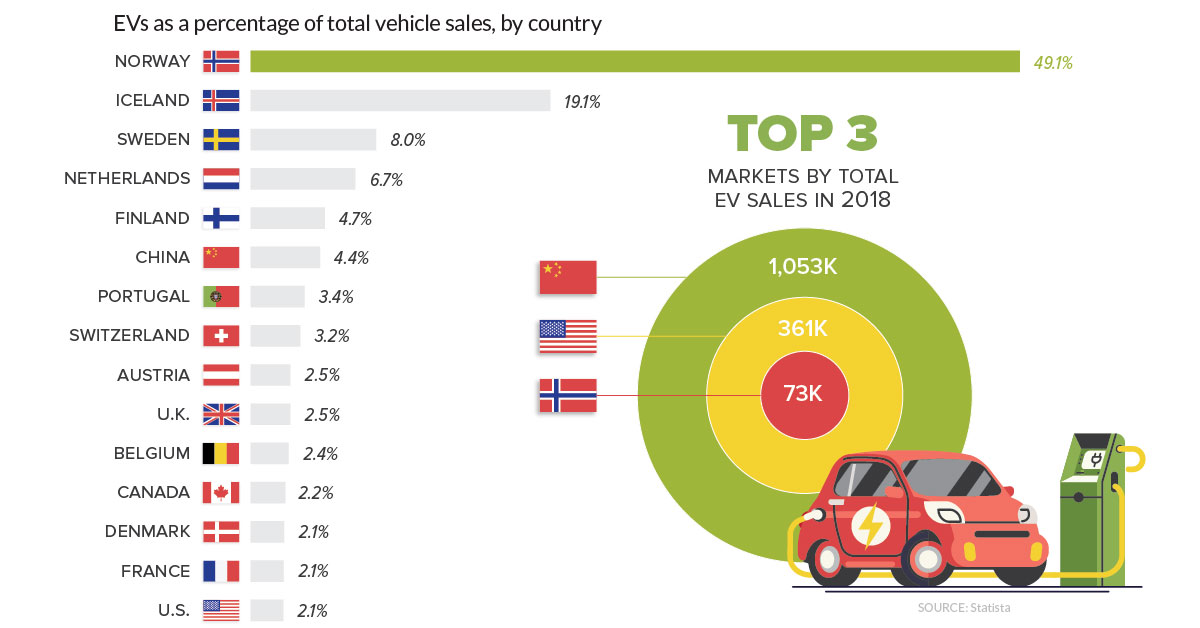
Norway, after amassing a fortune through oil and gas extraction, made the conscious decision to create incentives for its citizens to purchase electric vehicles. As a result, the country is the undisputed leader in EV adoption.
In 2018, a one-third of all passenger vehicles were fully electric, and that percentage is only expected to increase in the near future. The Norwegian government has even set the ambitious target of requiring all new cars to be zero-emission by 2025.
That enthusiasm for EVs is spilling over to other countries in the region, which are also seeing a high percentage of EV sales. However, the five countries in which EVs are the most popular – Norway, Iceland, Sweden, Netherlands, and Finland – only account for 0.5% of the world’s population. For EV adoption to make any real impact on global emissions, drivers in high-growth/high–population countries will need to opt for electric powered vehicles. (Of course power grids will need to get greener as well, but that’s another topic.)
China’s Supercharged Impact
One large economy that is embracing plug-in vehicles is China.
The country leads the world in electric vehicle sales, with over a million new vehicles hitting the roads in 2018. Last year, more EVs were sold in Shenzhen and Shanghai than any country in the world, with the exception of the United States.
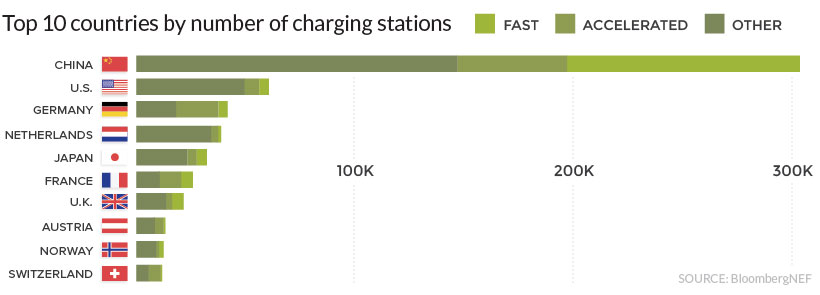
China also leads the world in another important metric – charging stations. Not only does China have the highest volume of chargers, many of them allow drivers to charge up faster.
Accelerating from the Slow Lane
In the United States, electric vehicle sales are rising, but they still tend to be highly concentrated in specific areas. In around half of states, EVs account for fewer than 1% of vehicle sales. On the other hand, California is approaching the 10% mark, a significant milestone for the most populous state.
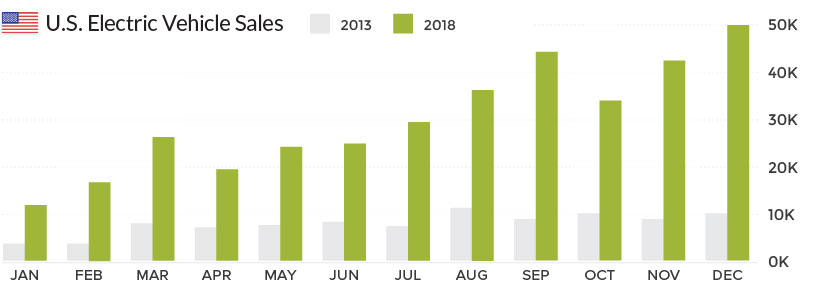
Nationally, EV sales increased throughout 2018, with December registering nearly double the sales volume of the same month in 2017. Part of this surge in sales is driven by the Tesla’s Model 3, which led the market in the last quarter of 2018.
North of the border, in Canada, the situation is similar. EV sales are increasing, but not fast enough to meet targets set by the government. Canada aimed to have half a million EVs on the road by 2018, but missed that target by around 400,000 vehicles.
The big question now is whether the recent surge in sales is a temporary trend driven by government subsidies and showmanship of Elon Musk, or whether EVs are now becoming a mainstream option for drivers around the world.


Green
The Carbon Footprint of Major Travel Methods
Going on a cruise ship and flying domestically are the most carbon-intensive travel methods.


The Carbon Footprint of Major Travel Methods
This was originally posted on our Voronoi app. Download the app for free on iOS or Android and discover incredible data-driven charts from a variety of trusted sources.
Did you know that transport accounts for nearly one-quarter of global energy-related carbon dioxide (CO₂) emissions?
This graphic illustrates the carbon footprints of major travel methods measured in grams of carbon dioxide equivalent (CO₂e) emitted per person to travel one kilometer. This includes both CO₂ and other greenhouse gases.
Data is sourced from Our World in Data, the UK Government’s Department for Energy Security and Net Zero, and The International Council on Clean Transportation, as of December 2022.
These figures should be interpreted as approximations, rather than exact numbers. There are many variables at play that determine the actual carbon footprint in any individual case, including vehicle type or model, occupancy, energy mix, and even weather.
Cruise Ships are the Most Carbon-Intensive Travel Method
According to these estimates, taking a cruise ship, flying domestically, and driving alone are some of the most carbon-intensive travel methods.
Cruise ships typically use heavy fuel oil, which is high in carbon content. The average cruise ship weighs between 70,000 to 180,000 metric tons, meaning they require large engines to get moving.
These massive vessels must also generate power for onboard amenities such as lighting, air conditioning, and entertainment systems.
Short-haul flights are also considered carbon-intensive due to the significant amount of fuel consumed during initial takeoff and climbing altitude, relative to a lower amount of cruising.
| Transportation method | CO₂ equivalent emissions per passenger km |
|---|---|
| Cruise Ship | 250 |
| Short-haul flight (i.e. within a U.S. state or European country) | 246 |
| Diesel car | 171 |
| Gas car | 170 |
| Medium-haul flight (i.e. international travel within Europe, or between U.S. states) | 151 |
| Long-haul flight (over 3,700 km, about the distance from LA to NY) | 147 |
| Motorbike | 113 |
| Bus (average) | 96 |
| Plug-in hybrid | 68 |
| Electric car | 47 |
| National rail | 35 |
| Tram | 28 |
| London Underground | 27 |
| Ferry (foot passenger) | 19 |
| Eurostar (International rail) | 4.5 |
Are EVs Greener?
Many experts agree that EVs produce a lower carbon footprint over time versus traditional internal combustion engine (ICE) vehicles.
However, the batteries in electric vehicles charge on the power that comes straight off the electrical grid—which in many places may be powered by fossil fuels. For that reason, the carbon footprint of an EV will depend largely on the blend of electricity sources used for charging.
There are also questions about how energy-intensive it is to build EVs compared to a comparable ICE vehicle.

-

 Science7 days ago
Visualizing the Average Lifespans of Mammals
-

 Markets2 weeks ago
The Top 10 States by Real GDP Growth in 2023
-

 Demographics2 weeks ago
The Smallest Gender Wage Gaps in OECD Countries
-

 United States2 weeks ago
Where U.S. Inflation Hit the Hardest in March 2024
-

 Green2 weeks ago
Top Countries By Forest Growth Since 2001
-

 United States2 weeks ago
Ranked: The Largest U.S. Corporations by Number of Employees
-

 Maps2 weeks ago
The Largest Earthquakes in the New York Area (1970-2024)
-

 Green2 weeks ago
Ranked: The Countries With the Most Air Pollution in 2023