Environment
Visualized: Air Quality and Pollution in 50 Capital Cities
Article/Editing:
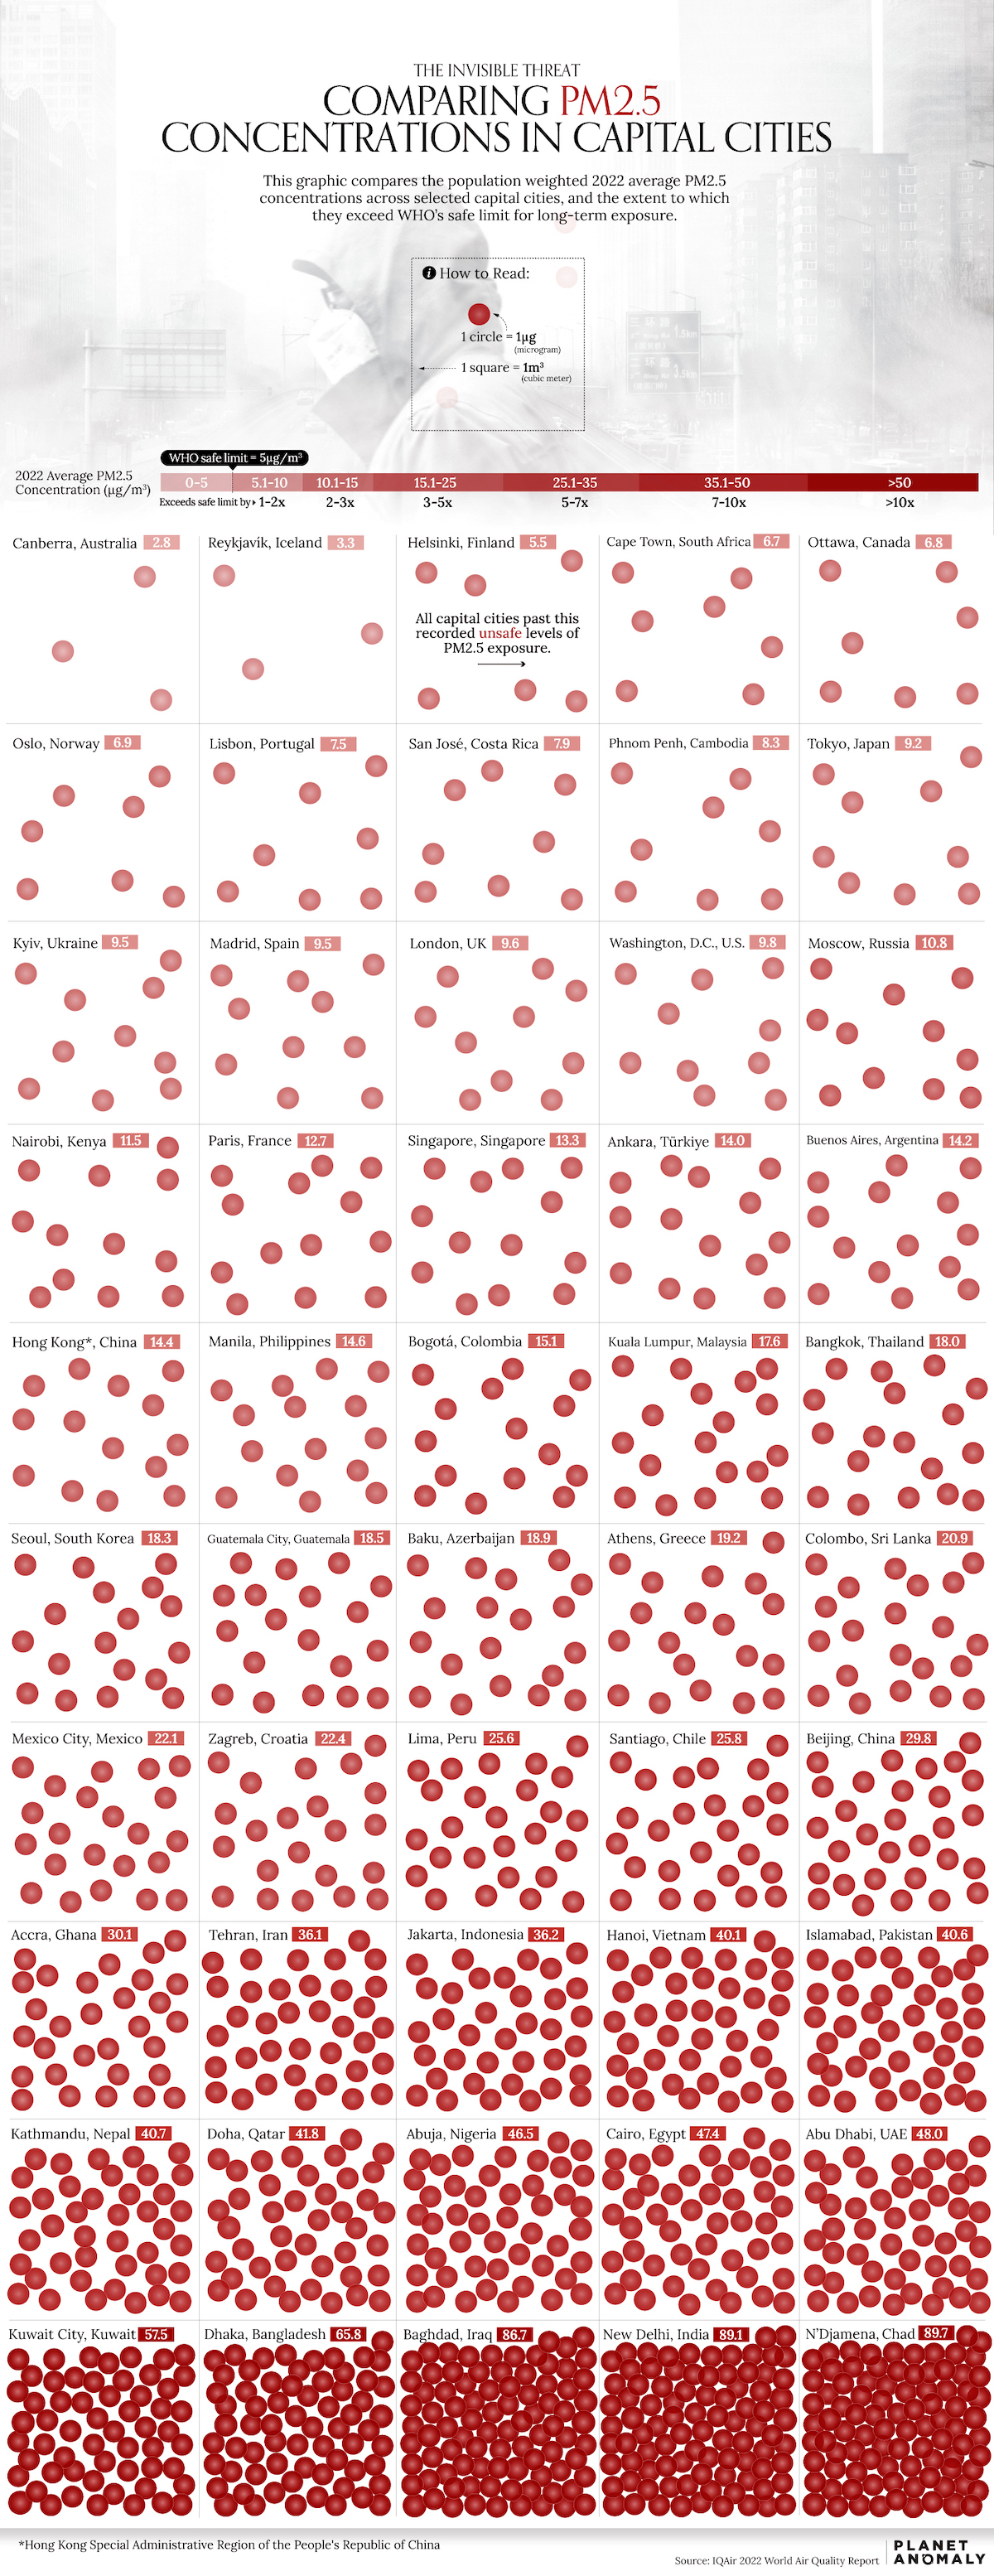
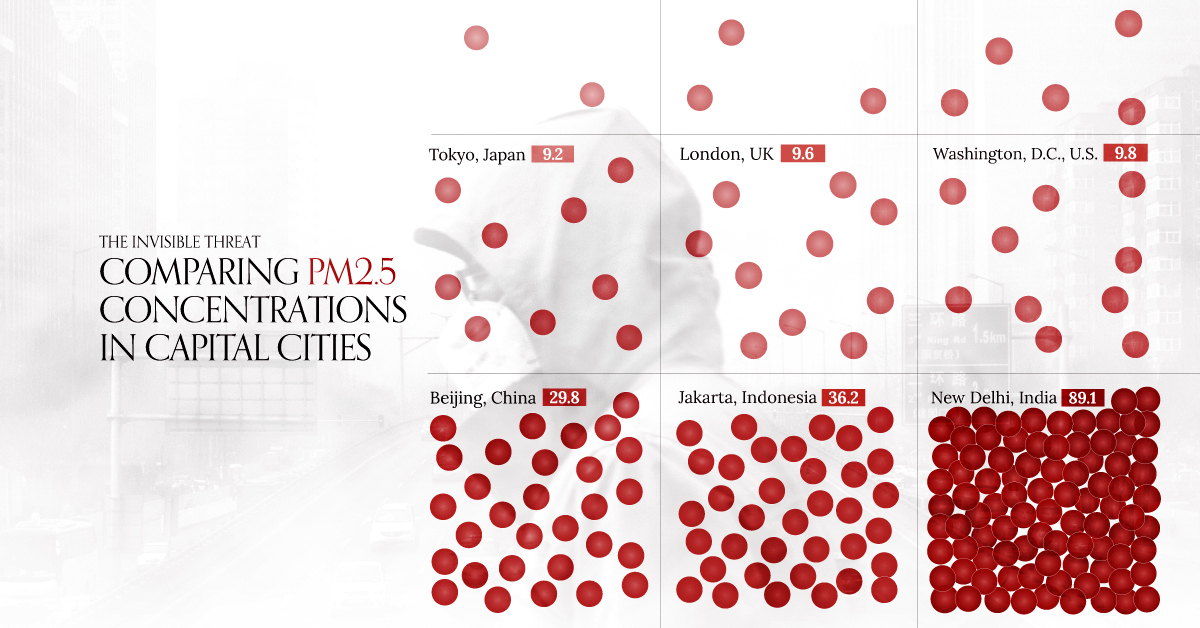
Comparing Air Quality and Pollution in 50 Capital Cities
We know bad air quality when we breathe it in—but how does it measure and compare across different cities?
To assess air quality, agencies measure the amount of particulate matter in an area to arrive at a number the resident population is breathing in over a period of time.
In this case, Planet Anomaly visualized the concentration of PM2.5 (fine particulate matter) in 50 select capital cities across the globe, using data from IQAir’s 2022 World Air Quality Report.
The report applied population-based adjustments to standardize its results and calculated an annual average of the data. If a city exceeded the WHO safety guideline of 5 micrograms per cubic meter (μg/m³) for annual average PM2.5 levels, it implied potential health risks for its residents.
Ranked: Capital Cities With the Best and Worst Air Quality
At the top of the list with the best air quality, Canberra, the capital of Australia, had an average PM2.5 level of 2.8 μg/m³ in 2022. Vehicle emissions and dust storms are the few sources of air pollutants in the city.
However, while Canberra did well in 2022, it had some of the worst air quality in 2020 when bushfire smoke blackened the skies.
Here’s the full list of all 116 capital cities measured by IQAir’s report, ranked by air quality from best to worst.
| Rank | City | Country | Region | 2022 Average PM2.5 Concentration |
|---|---|---|---|---|
| 1 | Canberra | 🇦🇺 Australia | Oceania | 2.8 |
| 2 | Hamilton | 🇧🇲 Bermuda | North America | 3.0 |
| 3 | Reykjavik | 🇮🇸 Iceland | Europe | 3.3 |
| 4 | San Juan | 🇵🇷 Puerto Rico | North America | 3.3 |
| 5 | Noumea | 🇳🇨 New Caledonia | Oceania | 3.5 |
| 6 | Saint George’s | 🇬🇩 Grenada | Central America | 3.8 |
| 7 | Tallinn | 🇪🇪 Estonia | Europe | 4.8 |
| 8 | Port of Spain | 🇹🇹 Trinidad & Tobago | Central America | 5.0 |
| 9 | Helsinki | 🇫🇮 Finland | Europe | 5.5 |
| 10 | Cape Town | 🇿🇦 South Africa | Africa | 6.7 |
| 11 | Ottawa | 🇨🇦 Canada | North America | 6.8 |
| 12 | Stockholm | 🇸🇪 Sweden | Europe | 6.8 |
| 13 | Oslo | 🇳🇴 Norway | Europe | 6.9 |
| 14 | Paramaribo | 🇸🇷 Suriname | South America | 7.0 |
| 15 | Dublin | 🇮🇪 Ireland | Europe | 7.1 |
| 16 | La Paz | 🇧🇴 Bolivia | South America | 7.3 |
| 17 | Lisbon | 🇵🇹 Portugal | Europe | 7.5 |
| 18 | San Jose | 🇨🇷 Costa Rica | Central America | 7.9 |
| 19 | Phnom Penh | 🇰🇭 Cambodia | Asia | 8.3 |
| 20 | Vaduz | 🇱🇮 Liechtenstein | Europe | 8.3 |
| 21 | Copenhagen | 🇩🇰 Denmark | Europe | 8.7 |
| 22 | Luanda | 🇦🇴 Angola | Africa | 8.8 |
| 23 | Managua | 🇳🇮 Nicaragua | Central America | 8.9 |
| 24 | Panama | 🇵🇦 Panama | Central America | 9.0 |
| 25 | Tokyo | 🇯🇵 Japan | Asia | 9.2 |
| 26 | Madrid | 🇪🇸 Spain | Europe | 9.5 |
| 27 | Kyiv | 🇺🇦 Ukraine | Europe | 9.5 |
| 28 | London | 🇬🇧 UK | Europe | 9.6 |
| 29 | Washington | 🇺🇸 U.S. | North America | 9.8 |
| 30 | Taipei | 🇹🇼 Taiwan | Asia | 9.9 |
| 31 | Amsterdam | 🇳🇱 Netherlands | Europe | 10.1 |
| 32 | Tegucigalpa | 🇭🇳 Honduras | Central America | 10.2 |
| 33 | Vienna | 🇦🇹 Austria | Europe | 10.5 |
| 34 | Bern | 🇨🇭 Switzerland | Europe | 10.5 |
| 35 | Brussels | 🇧🇪 Belgium | Europe | 10.6 |
| 36 | Moscow | 🇷🇺 Russia | Europe | 10.8 |
| 37 | Budapest | 🇭🇺 Hungary | Europe | 11.2 |
| 38 | Montevideo | 🇺🇾 Uruguay | South America | 11.3 |
| 39 | Nairobi | 🇰🇪 Kenya | Africa | 11.5 |
| 40 | Podgorica | 🇲🇪 Montenegro | Europe | 11.8 |
| 41 | Prague | 🇨🇿 Czech Republic | Europe | 11.9 |
| 42 | Berlin | 🇩🇪 Germany | Europe | 12.6 |
| 43 | Rome | 🇮🇹 Italy | Europe | 12.6 |
| 44 | Paris | 🇫🇷 France | Europe | 12.7 |
| 45 | Georgetown | 🇬🇾 Guyana | South America | 12.7 |
| 46 | Singapore | 🇸🇬 Singapore | Asia | 13.3 |
| 47 | San Salvador | 🇸🇻 El Salvador | Central America | 13.4 |
| 48 | Bratislava | 🇸🇰 Slovakia | Europe | 13.4 |
| 49 | Pristina | 🇽🇰 Kosovo | Europe | 13.7 |
| 50 | Ankara | 🇹🇷 Türkiye | Asia | 14.0 |
| 51 | Buenos Aires | 🇦🇷 Argentina | South America | 14.2 |
| 52 | Hong Kong | 🇭🇰 Hong Kong SAR | Asia | 14.4 |
| 53 | Tirana | 🇦🇱 Albania | Europe | 14.5 |
| 54 | Vilnius | 🇱🇹 Lithuania | Europe | 14.5 |
| 55 | Metro Manila | 🇵🇭 Philippines | Asia | 14.6 |
| 56 | Bogota | 🇨🇴 Colombia | South America | 15.1 |
| 57 | Warsaw | 🇵🇱 Poland | Europe | 15.3 |
| 58 | Kinshasa | 🇨🇩 DRC | Africa | 15.5 |
| 59 | Ljubljana | 🇸🇮 Slovenia | Europe | 16.2 |
| 60 | Tbilisi | 🇬🇪 Georgia | Europe | 16.3 |
| 61 | Nicosia | 🇨🇾 Cyprus | Europe | 16.4 |
| 62 | Bucharest | 🇷🇴 Romania | Europe | 17.1 |
| 63 | Kuala Lumpur | 🇲🇾 Malaysia | Asia | 17.6 |
| 64 | Algiers | 🇩🇿 Algeria | Africa | 17.8 |
| 65 | Bangkok | 🇹🇭 Thailand | Asia | 18.0 |
| 66 | Seoul | 🇰🇷 South Korea | Asia | 18.3 |
| 67 | Guatemala City | 🇬🇹 Guatemala | Central America | 18.5 |
| 68 | Baku | 🇦🇿 Azerbaijan | Asia | 18.9 |
| 69 | Sofia | 🇧🇬 Bulgaria | Europe | 19.1 |
| 70 | Athens | 🇬🇷 Greece | Europe | 19.2 |
| 71 | Tel Aviv-Yafo | 🇮🇱 Israel | Middle East | 19.5 |
| 72 | Dakar | 🇸🇳 Senegal | Africa | 20.4 |
| 73 | Colombo | 🇱🇰 Sri Lanka | Asia | 20.9 |
| 74 | Astana | 🇰🇿 Kazakhstan | Asia | 21.4 |
| 75 | Ashgabat | 🇹🇲 Turkmenistan | Asia | 21.6 |
| 76 | Mexico City | 🇲🇽 Mexico | North America | 22.1 |
| 77 | Belgrade | 🇷🇸 Serbia | Europe | 22.1 |
| 78 | Zagreb | 🇭🇷 Croatia | Europe | 22.4 |
| 79 | Abidjan | 🇨🇮 Ivory Coast | Africa | 22.5 |
| 80 | Chisinau | 🇲🇩 Moldova | Europe | 22.6 |
| 81 | Antananarivo | 🇲🇬 Madagascar | Africa | 23.7 |
| 82 | Yangon | 🇲🇲 Myanmar | Asia | 24.3 |
| 83 | Lusaka | 🇿🇲 Zambia | Africa | 24.6 |
| 84 | Lima | 🇵🇪 Peru | South America | 25.6 |
| 85 | Santiago | 🇨🇱 Chile | South America | 25.8 |
| 86 | Skopje | 🇲🇰 North Macedonia | Europe | 26.6 |
| 87 | Vientiane | 🇱🇦 Laos | Asia | 27.6 |
| 88 | Bishkek | 🇰🇬 Kyrgyzstan | Asia | 29.0 |
| 89 | Beijing | 🇨🇳 China | Asia | 29.8 |
| 90 | Accra | 🇬🇭 Ghana | Africa | 30.1 |
| 91 | Ulaanbaatar | 🇲🇳 Mongolia | Asia | 30.6 |
| 92 | Addis Ababa | 🇪🇹 Ethiopia | Africa | 31.3 |
| 93 | Yerevan | 🇦🇲 Armenia | Asia | 31.4 |
| 94 | Sarajevo | 🇧🇦 Bosnia Herzegovina | Europe | 32.4 |
| 95 | Tashkent | 🇺🇿 Uzbekistan | Asia | 33.5 |
| 96 | Tehran | 🇮🇷 Iran | Asia | 36.1 |
| 97 | Jakarta | 🇮🇩 Indonesia | Asia | 36.2 |
| 98 | Kampala | 🇺🇬 Uganda | Africa | 39.6 |
| 99 | Hanoi | 🇻🇳 Vietnam | Asia | 40.1 |
| 100 | Islamabad | 🇵🇰 Pakistan | Asia | 40.6 |
| 101 | Kathmandu | 🇳🇵 Nepal | Asia | 40.7 |
| 102 | Doha | 🇶🇦 Qatar | Middle East | 41.8 |
| 103 | Kigali | 🇷🇼 Rwanda | Africa | 44.0 |
| 104 | Khartoum | 🇸🇩 Sudan | Africa | 44.6 |
| 105 | Riyadh | 🇸🇦 Saudi Arabia | Middle East | 46.2 |
| 106 | Abuja | 🇳🇬 Nigeria | Africa | 46.5 |
| 107 | Cairo | 🇪🇬 Egypt | Africa | 47.4 |
| 108 | Dushanbe | 🇹🇯 Tajikistan | Asia | 47.7 |
| 109 | Abu Dhabi | 🇦🇪 UAE | Middle East | 48.0 |
| 110 | Kuwait City | 🇰🇼 Kuwait | Middle East | 57.5 |
| 111 | Ougadougou | 🇧🇫 Burkina Faso | Africa | 63.0 |
| 112 | Dhaka | 🇧🇩 Bangladesh | Asia | 65.8 |
| 113 | Manama | 🇧🇭 Bahrain | Middle East | 66.6 |
| 114 | Baghdad | 🇮🇶 Iraq | Asia | 86.7 |
| 115 | New Delhi | 🇮🇳 India | Asia | 89.1 |
| 116 | N’Djamena | 🇹🇩 Chad | Africa | 89.7 |
Hamilton, Bermuda (3.8 μg/m³) and Reykjavik, Iceland (3.3 μg/m³) rank second and third respectively, followed by three more capitals on island nations. In fact, nine of the top 10 capitals are situated directly on a coastline and take advantage of ocean breezes that can act as air filters.
Ranked 8th, the Port of Spain (capital of Trinidad & Tobago) is the last city whose air quality is considered safe (5.0 μg/m³) by the WHO.
From a broader perspective, fewer than 10% of all countries have air quality that meets safety guidelines.
Meanwhile, at the bottom of the list with the worst air quality, Chad’s capital city N’Djamena, recorded a PM2.5 concentration of nearly 90 μg/m³ per day in 2022—almost 18x the recommended WHO safety guideline.
Air Quality Correlates With Countries’ Income Levels
Perhaps the most striking feature of the rankings is how air quality worsens with countries that are in the low and middle-income categories and improves in high income countries.
As an example, compare the distribution of the ranks of capital cities in Asia (generally lower and middle income countries) versus capitals in Europe (general high income countries).
| Air Quality Ranks | Cities in Asia | Cities in Europe |
|---|---|---|
| Top 20 | 3.33% | 20.51% |
| 20–40 | 6.67% | 28.21% |
| 40–60 | 13.33% | 28.21% |
| 60–80 | 23.33% | 17.95% |
| 80–100 | 36.67% | 5.13% |
| 100–116 | 16.67% | 0.00% |
The majority of European capital cities are ranked 20–60 versus Asian capitals which are mostly ranked 60–100.
Lower and middle income countries have larger structural economic concerns and many of them are still in the process of transitioning away from polluting materials that affect air quality.

This article was published as a part of Visual Capitalist's Creator Program, which features data-driven visuals from some of our favorite Creators around the world.


Green
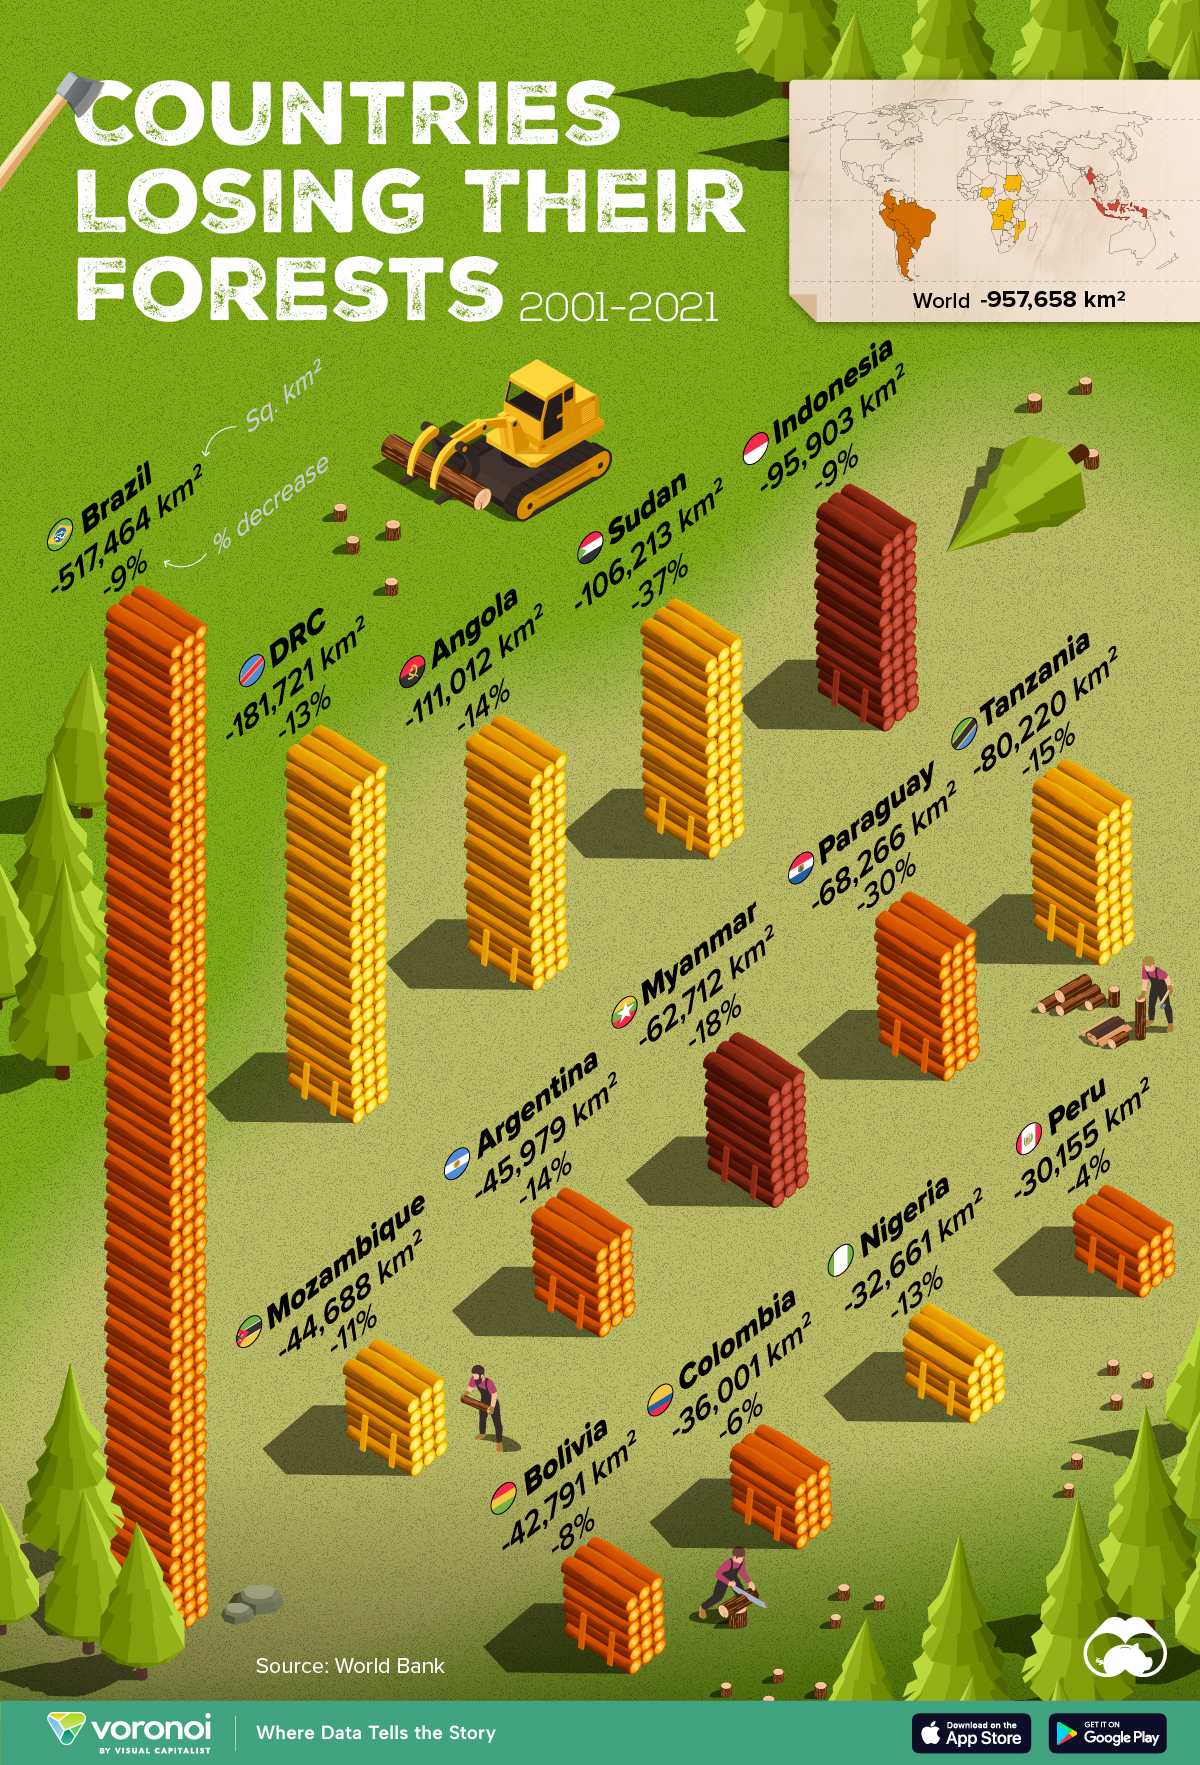
Ranked: Top Countries by Total Forest Loss Since 2001
The country with the most forest loss since 2001 lost as much forest cover as the next four countries combined.
Ranked: Top Countries By Total Forest Loss Since 2001
This was originally posted on our Voronoi app. Download the app for free on iOS or Android and discover incredible data-driven charts from a variety of trusted sources.
Forests are critical natural resources, often caught in the crosshairs of economic development. Thanks to expanding human settlement, agriculture, and industry, the world lost nearly 1 million square kilometers (km²) of forest cover since 2001.
But where has most of this deforestation occurred?
We rank the countries by the total decrease in their forest area between 2001 and 2021, measured in square kilometers along with their percentage decrease for context. All of this data was sourced from the World Bank.
A caveat to this data: countries are ranked by total forest loss, so countries with the largest forests feature predominantly on this list.
Which Country Has Lost the Most Forests (2001-2021)?
Brazil has lost more than half a million square kilometers of forest in the last two decades. Agricultural expansion for beef and soy production alongside mining and infrastructure growth are the primary drivers behind this large scale deforestation.
This has also caused periodic fires in the Amazon rainforest, drawing repeated alarm from around the world. In fact, Brazil has lost as much forest cover as the next four countries combined.
The table below lists the countries included in this graphic, as well as several others further down the ranking.
| Rank | Country | Region | 2001–21 Change (in km2) | % of Forest Loss |
|---|---|---|---|---|
| 1 | 🇧🇷 Brazil | South America | -517,464 | -9% |
| 2 | 🇨🇩 DRC | Africa | -181,721 | -13% |
| 3 | 🇦🇴 Angola | Africa | -111,012 | -14% |
| 4 | 🇸🇩 Sudan | Africa | -106,213 | -37% |
| 5 | 🇮🇩 Indonesia | Asia | -95,903 | -9% |
| 6 | 🇹🇿 Tanzania | Africa | -80,220 | -15% |
| 7 | 🇵🇾 Paraguay | South America | -68,266 | -30% |
| 8 | 🇲🇲 Myanmar | Asia | -62,712 | -18% |
| 9 | 🇦🇷 Argentina | South America | -45,979 | -14% |
| 10 | 🇲🇿 Mozambique | Africa | -44,688 | -11% |
| 11 | 🇧🇴 Bolivia | South America | -42,791 | -8% |
| 12 | 🇨🇴 Colombia | South America | -36,001 | -6% |
| 13 | 🇳🇬 Nigeria | Africa | -32,661 | -13% |
| 14 | 🇵🇪 Peru | South America | -30,155 | -4% |
| 15 | 🇰🇭 Cambodia | Asia | -28,491 | -26% |
| 16 | 🇻🇪 Venezuela | South America | -28,130 | -6% |
| 17 | 🇲🇽 Mexico | North America | -26,732 | -4% |
| 18 | 🇿🇲 Zambia | Africa | -23,924 | -5% |
| 19 | 🇧🇼 Botswana | Africa | -23,660 | -14% |
| 20 | 🇨🇮 Cote d'Ivoire | Africa | -22,577 | -45% |
What is quickly apparent is how most of the countries on this list are from Africa and South America. A study found a correlation where developing economies tend to have higher deforestation rates than advanced economies. Former colonies have also experienced more forest loss than those that were not colonized.
In Asia, Indonesia’s burgeoning palm oil industry is a key driver to deforestation, though efforts are now being made to reverse its impact. Meanwhile, Cambodia experienced rapid clear-cutting for its growing rubber plantations and timber industry.
Finally, Myanmar has long contended with illegal logging, but the country’s ongoing civil war is styming conversation efforts.

-

 Debt1 week ago
How Debt-to-GDP Ratios Have Changed Since 2000
-

 Countries2 weeks ago
Population Projections: The World’s 6 Largest Countries in 2075
-

 Markets2 weeks ago
The Top 10 States by Real GDP Growth in 2023
-

 Demographics2 weeks ago
The Smallest Gender Wage Gaps in OECD Countries
-

 United States2 weeks ago
Where U.S. Inflation Hit the Hardest in March 2024
-

 Green2 weeks ago
Top Countries By Forest Growth Since 2001
-

 United States2 weeks ago
Ranked: The Largest U.S. Corporations by Number of Employees
-

 Maps2 weeks ago
The Largest Earthquakes in the New York Area (1970-2024)