Datastream
Ranked: The 25 Poorest Countries by GDP per Capita


The Briefing
- Global GDP per capita continues to grow every year, and is projected to sit at $13,920 for 2023 (current prices)
- There are as many as 123 countries whose per capita GDP is below the global average
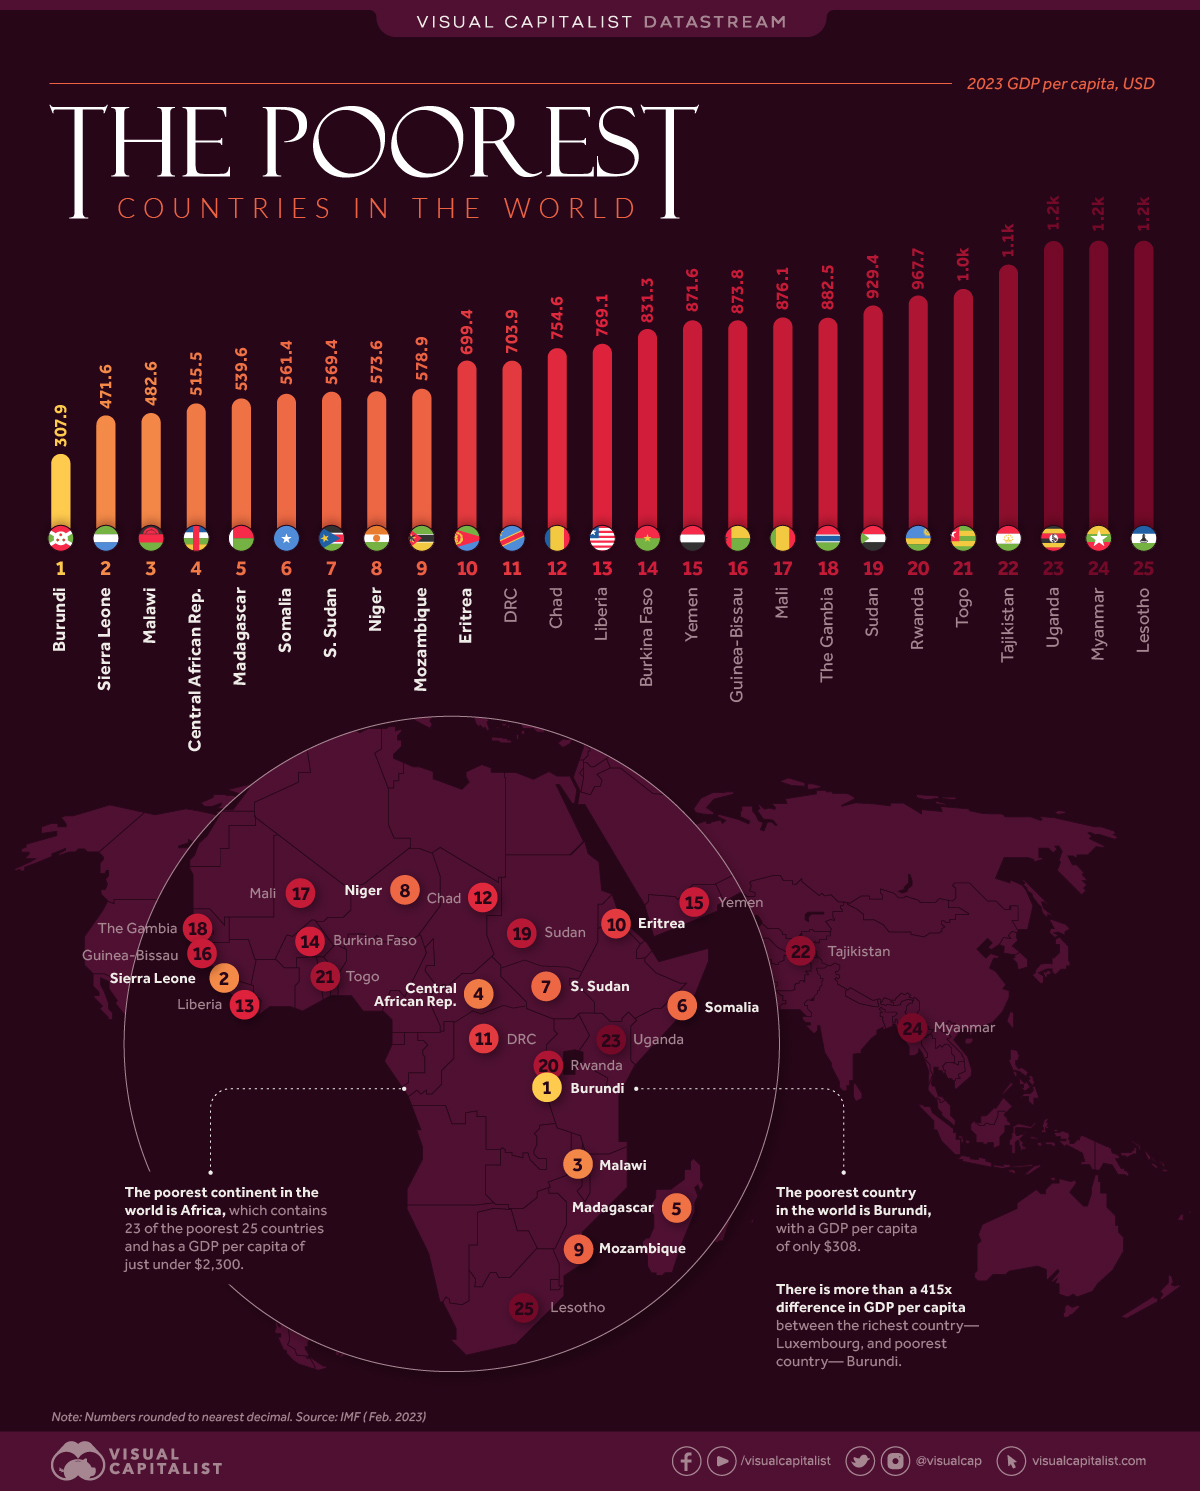
- Burundi is the poorest country in the world with a per capita GDP of about $308
Ranked: Which Are the World’s Poorest Countries?
There are different ways to measure economic activity and wealth of a country, and for this article on the world’s least-wealthy nations, we’ve used GDP per capita projections for this year from the International Monetary Fund (IMF).
Nominal world GDP per capita is expected to go from $13,400 in 2022 to $13,920 in 2023, but in contrast to the rest of the world, per capita economic output in Africa is much lower than in continents such as North America or Europe.
Here are the countries with the lowest per capita GDP, all below the global average.
| Country | GDP per capita (USD) |
|---|---|
| Burundi | $308 |
| Sierra Leone | $472 |
| Malawi | $483 |
| Central African Republic | $516 |
| Madagascar | $540 |
| Somalia | $562 |
| South Sudan | $570 |
| Niger | $574 |
| Mozambique | $579 |
| Eritrea | $700 |
| Congo | $704 |
| Chad | $755 |
| Liberia | $770 |
| Burkina Faso | $832 |
| Yemen | $872 |
| Guinea-Bissau | $874 |
| Mali | $877 |
| Gambia, The | $883 |
| Sudan | $930 |
| Rwanda | $968 |
| Togo | $1,008 |
| Tajikistan | $1,050 |
| Uganda | $1,164 |
| Myanmar | $1,173 |
| Lesotho | $1,209 |
| Ethiopia | $1,227 |
| Comoros | $1,303 |
| Tanzania | $1,341 |
| Nepal | $1,372 |
| Benin | $1,383 |
| Zambia | $1,396 |
| Guinea | $1,446 |
| Timor-Leste | $1,495 |
| Kyrgyz Republic | $1,570 |
| Cameroon | $1,609 |
| Senegal | $1,640 |
| Kiribati | $1,732 |
| Haiti | $1,792 |
| Cambodia | $1,902 |
| Lao P.D.R. | $1,985 |
| Ghana | $2,131 |
| Kenya | $2,259 |
| São Tomé and Príncipe | $2,302 |
| Zimbabwe | $2,308 |
| Solomon Islands | $2,330 |
| Mauritania | $2,366 |
| Côte d'Ivoire | $2,497 |
| Nicaragua | $2,541 |
| Uzbekistan | $2,555 |
| Nigeria | $2,585 |
| India | $2,692 |
| Congo | $2,844 |
| Bangladesh | $2,847 |
| Honduras | $3,080 |
| Vanuatu | $3,115 |
| Venezuela | $3,267 |
| West Bank and Gaza | $3,544 |
| Papua New Guinea | $3,570 |
| Cabo Verde | $3,709 |
| Tunisia | $3,762 |
| Philippines | $3,764 |
| Bolivia | $3,792 |
| Bhutan | $3,856 |
| Djibouti | $3,870 |
| Angola | $3,998 |
| Morocco | $4,068 |
| Samoa | $4,126 |
| Algeria | $4,163 |
| Eswatini | $4,189 |
| Micronesia | $4,309 |
| Egypt | $4,438 |
| Vietnam | $4,683 |
| Mongolia | $4,726 |
| Jordan | $4,930 |
| Indonesia | $5,006 |
| Guatemala | $5,007 |
| Suriname | $5,037 |
| Namibia | $5,053 |
| El Salvador | $5,076 |
| Marshall Islands | $5,087 |
| Tonga | $5,368 |
| Kosovo | $5,560 |
| Moldova | $5,744 |
| Fiji | $5,869 |
| Paraguay | $5,907 |
| Jamaica | $5,985 |
| Tuvalu | $6,215 |
| Iraq | $6,320 |
| Belize | $6,382 |
| Libya | $6,392 |
| Armenia | $6,568 |
| Ecuador | $6,588 |
| Albania | $6,592 |
| South Africa | $6,813 |
| Azerbaijan | $6,872 |
| Colombia | $6,940 |
| Bosnia and Herzegovina | $7,082 |
| North Macedonia | $7,263 |
| Georgia | $7,270 |
| Peru | $7,354 |
| Botswana | $7,463 |
| Thailand | $8,274 |
| Dominica | $8,840 |
| Saint Vincent and the Grenadines | $9,432 |
| Brazil | $9,572 |
| Mauritius | $9,832 |
| Gabon | $9,850 |
| Belarus | $9,938 |
| Serbia | $10,076 |
| Equatorial Guinea | $10,087 |
| Nauru | $10,097 |
| Montenegro | $10,722 |
| Türkiye | $10,864 |
| Grenada | $11,156 |
| Mexico | $11,251 |
| Dominican Republic | $11,406 |
| Saint Lucia | $11,679 |
| Kazakhstan | $12,433 |
| Turkmenistan | $13,021 |
| Bulgaria | $13,221 |
| China | $13,630 |
| Argentina | $13,768 |
| Costa Rica | $13,806 |
Burundi, with a population of nearly 13 million people, is one of the smallest countries in Africa by physical size. The country has the lowest per capita GDP at $308. Burundi gained independence in 1962 after being first a German, then Belgian colony, since the latter half of the 19th century.
It has struggled over the last 50 years with recurring civil strife and high levels of corruption. However, the IMF projects positive trends for the country’s economy, citing the impact of more recent economic reforms.
As a comparison point for global wealth disparity, the richest country in the world, Luxembourg, has a per capita GDP that is nearly 415 times that of Burundi.
Meanwhile, the second and third lowest per capita GDPs belong to Sierra Leone and Malawi, also from Africa, both nearly $200 more than Burundi.
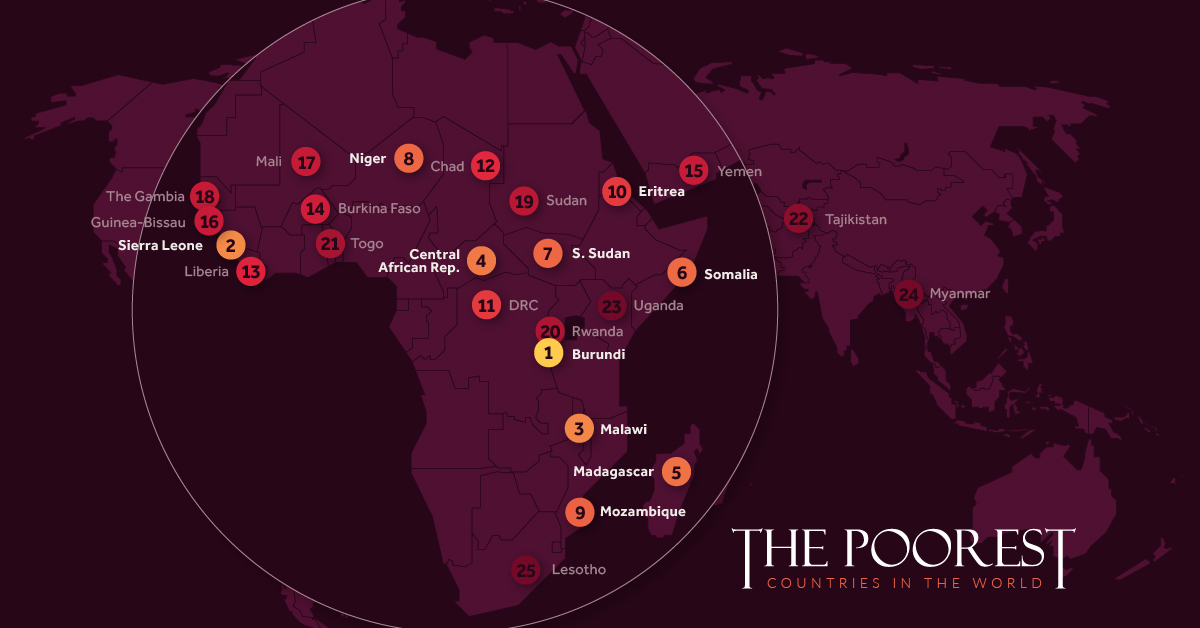
All 20 of the world’s poorest countries, except for Yemen, are located on the African continent. This data points to the potential impacts of colonization, and later on globalization, that continue to have long-lasting implications on most African economies today.
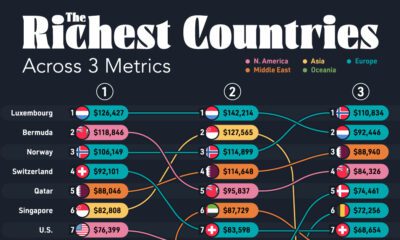
» See a ranking of the richest countries in the world
Source: International Monetary Fund.
Data note: The IMF dataset does not include data for all countries, and those with missing data for 2023 have not been included in this visualization. Some of the countries not included are: Afghanistan, Bermuda, Cuba, Monaco, Pakistan, Sri Lanka, Syria. For a full list of countries not included, refer to the IMF site. Furthermore, the GDP per capita dataset often updates as currency rates fluctuate, which may lead to slight differences in figures at the time of publishing.


UK Only
Charting the Rise of Cross-Border Money Transfers (2015-2023)
With over 280 million immigrants transferring billions of dollars annually, the remittance industry has become more valuable than ever.
The Briefing
- 79% of remittance payments in 2022 were made to low and middle-income countries.
- Borderless, low-cost money transfer services like those provided by Wise can help immigrants support their families.
The Rise of Cross-Border Money Transfers
The remittance industry has experienced consistent growth recently, solidifying its position as a key component of the global financial landscape. Defined as the transfer of money from one country to another, usually to support a dependent, remittances play a pivotal role in providing food, healthcare, and education.
In this graphic, sponsored by Scottish Mortgage, we delve into the growth of the remittance industry, and the key factors propelling its success.
Powered by Immigration
With over 280 million immigrants worldwide, the remittance industry has an important place in our global society.
By exporting billions of dollars annually back to their starting nations, immigrants can greatly improve the livelihoods of their families and communities.
This is particularly true for low and middle-income countries, who in 2022 received, on average, 79% of remittance payments, according to Knomad, an initiative of the World Bank.
| Year | Low/Middle Income (US$ Billion) | World Total (US$ Billion) |
|---|---|---|
| 2015 | $447B | $602B |
| 2016 | $440B | $596B |
| 2017 | $477B | $638B |
| 2018 | $524B | $694B |
| 2019 | $546B | $722B |
| 2020 | $542B | $711B |
| 2021 | $597B | $781B |
| 2022 | $626B | $794B |
| 2023 | $639B | $815B |
India is one of the global leaders in receiving remittance payments. In 2022 alone, over $100 billion in remittances were sent to India, supporting many families.
Enter Wise
As the global remittance industry continues to grow, it is important to acknowledge the role played by innovative money transfer operators like Wise.
With an inclusive, user-centric platform and competitive exchange rates, Wise makes it easy and cost-effective for millions of individuals to send money home, worldwide.
Connection Without Borders
But Wise doesn’t just offer remittance solutions, the company offers a host of account services and a payment infrastructure that has helped over 6.1 million active customers move over $30 billion in the first quarter of 2023 alone.
Want to invest in transformative companies like Wise?
Discover Scottish Mortgage Investment Trust, a portfolio of some of the world’s most exciting growth companies.

-

 Wealth6 days ago
Charted: Which City Has the Most Billionaires in 2024?
-

 Mining2 weeks ago
Gold vs. S&P 500: Which Has Grown More Over Five Years?
-

 Uranium2 weeks ago
The World’s Biggest Nuclear Energy Producers
-

 Education2 weeks ago
How Hard Is It to Get Into an Ivy League School?
-

 Debt2 weeks ago
How Debt-to-GDP Ratios Have Changed Since 2000
-

 Sports2 weeks ago
The Highest Earning Athletes in Seven Professional Sports
-

 Science2 weeks ago
Visualizing the Average Lifespans of Mammals
-

 Brands1 week ago
How Tech Logos Have Evolved Over Time