Misc
The Top 10 Largest Nuclear Explosions, Visualized


The Top 10 Largest Nuclear Explosions, Visualized
Just how powerful are nuclear explosions?
The U.S.’ Trinity test in 1945, the first-ever nuclear detonation, released around 19 kilotons of explosive energy. The explosion instantly vaporized the tower it stood on and turned the surrounding sand into green glass, before sending a powerful heatwave across the desert.
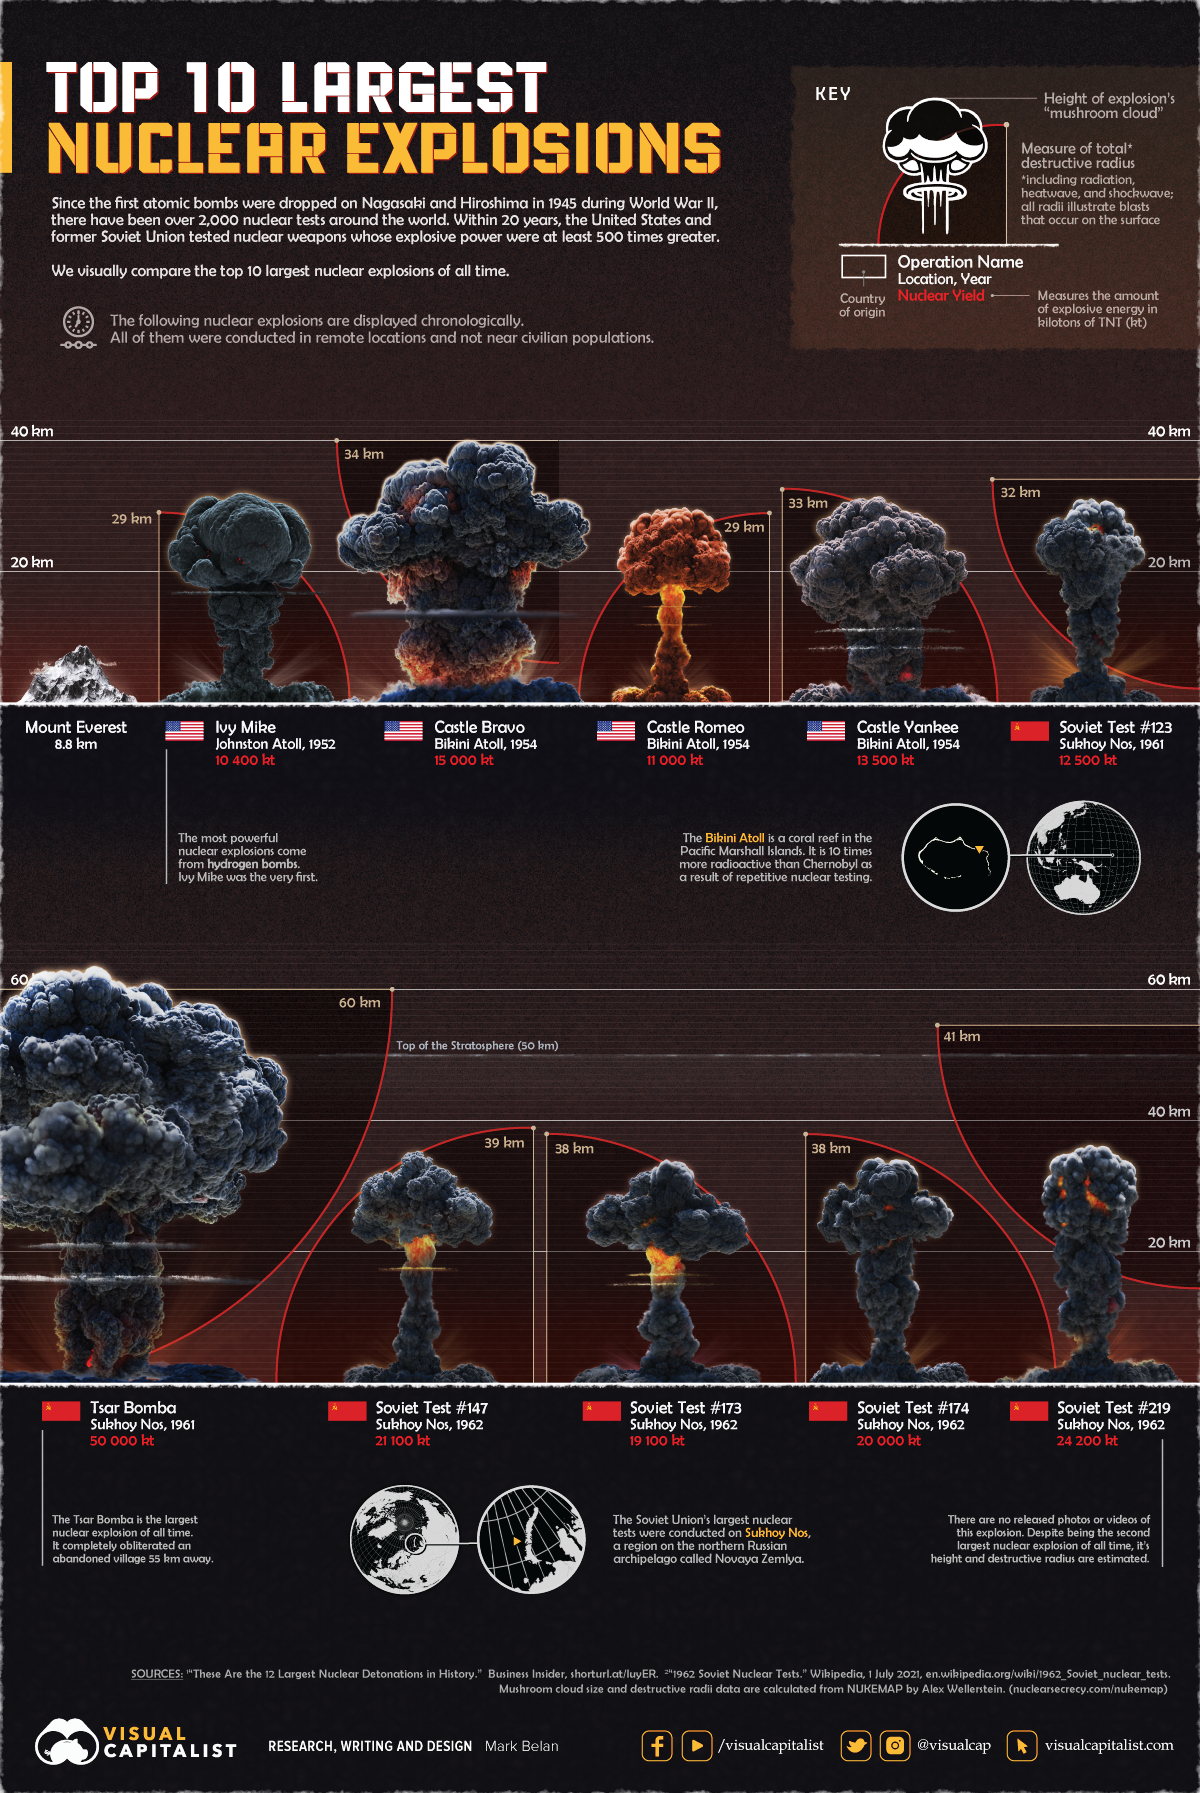
As the Cold War escalated in the years after WWII, the U.S. and the Soviet Union tested bombs that were at least 500 times greater in explosive power. This infographic visually compares the 10 largest nuclear explosions in history.
The Anatomy of a Nuclear Explosion
After exploding, nuclear bombs create giant fireballs that generate a blinding flash and a searing heatwave. The fireball engulfs the surrounding air, getting larger as it rises like a hot air balloon.
As the fireball and heated air rise, they are flattened by cooler, denser air high up in the atmosphere, creating the mushroom “cap” structure. At the base of the cloud, the fireball causes physical destruction by sending a shockwave moving outwards at thousands of miles an hour.
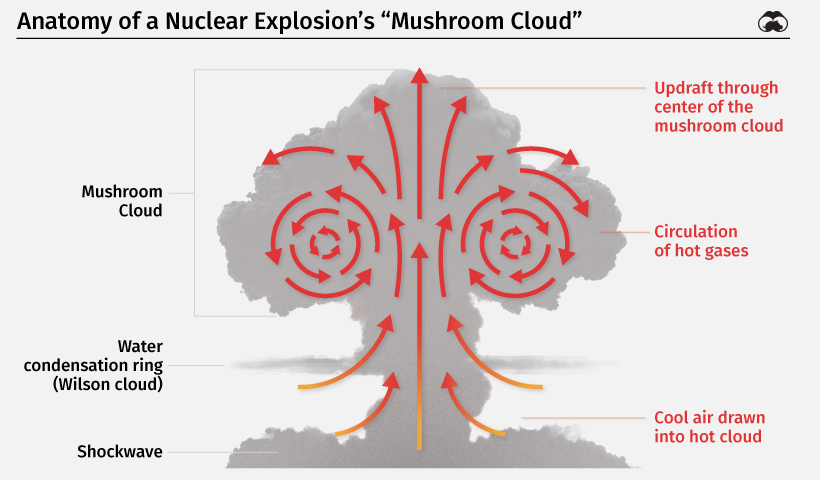
A strong updraft of air and dirt particles through the center of the cloud forms the “stem” of the mushroom cloud. In most atomic explosions, changing atmospheric pressure and water condensation create rings that surround the cloud, also known as Wilson clouds.
Over time, the mushroom cloud dissipates. However, it leaves behind radioactive fallout in the form of nuclear particles, debris, dust, and ash, causing lasting damage to the local environment. Because the particles are lightweight, global wind patterns often distribute them far beyond the place of detonation.
With this context in mind, here’s a look at the 10 largest nuclear explosions.
#10: Ivy Mike (1952)
In 1952, the U.S. detonated the Mike device—the first-ever hydrogen bomb—as part of Operation Ivy. Hydrogen bombs rely on nuclear fusion to amplify their explosions, producing much more explosive energy than atomic bombs that use nuclear fission.
Weighing 140,000 pounds (63,500kg), the Ivy Mike test generated a yield of 10,400 kilotons, equivalent to the explosive power of 10.4 million tons of TNT. The explosion was 700 times more powerful than Little Boy, the bomb dropped on Hiroshima in 1945.
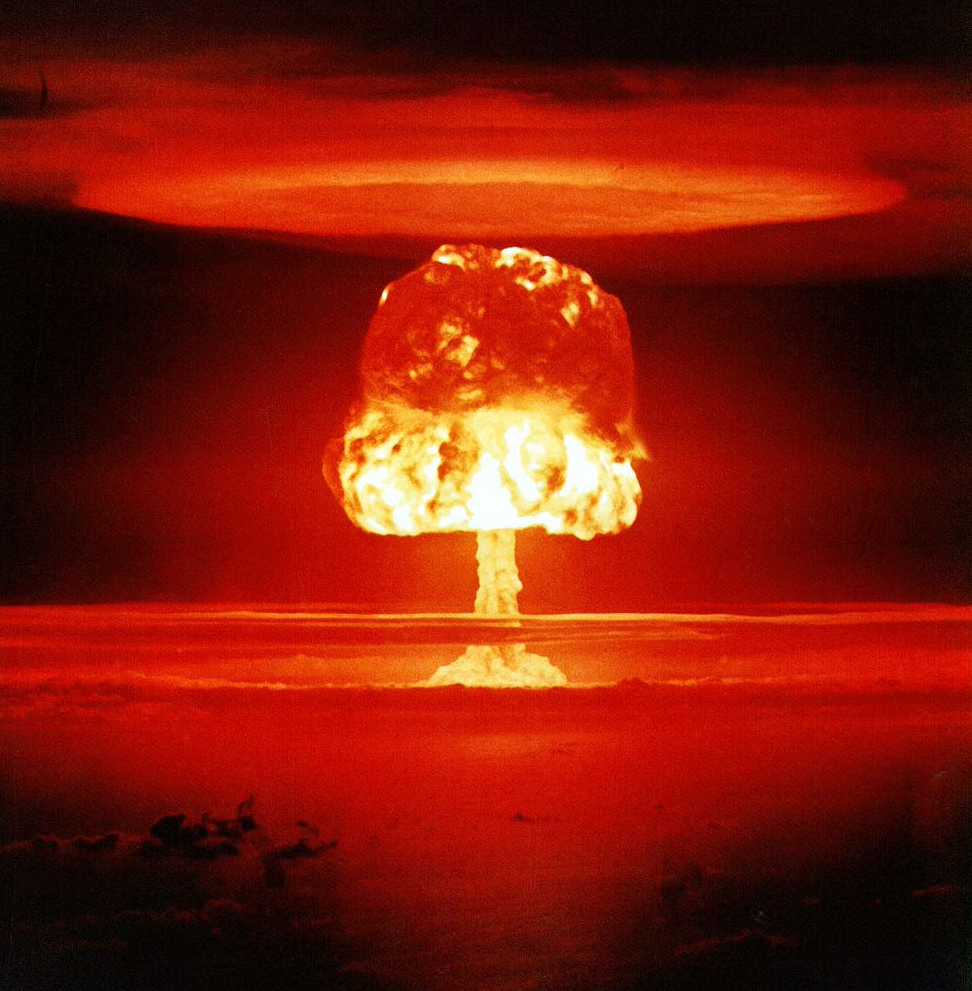
#9: Castle Romeo (1954)
Castle Romeo was part of the Operation Castle series of U.S. nuclear tests taking place on the Marshall Islands. Shockingly, the U.S. was running out of islands to conduct tests, making Romeo the first-ever test conducted on a barge in the ocean.
At 11,000 kilotons, the test produced more than double its predicted explosive energy of 4,000 kilotons. Its fireball, as seen below, is one of the most iconic images ever captured of a nuclear explosion.
#8: Soviet Test #123 (1961)
Test #123 was one of the 57 tests conducted by the Soviet Union in 1961. Most of these tests were conducted on the Novaya Zemlya archipelago in Northwestern Russia. The bomb yielded 12,500 kilotons of explosive energy, enough to vaporize everything within a 2.1 mile (3.5km) radius.
#7: Castle Yankee (1954)
Castle Yankee was the fifth test in Operation Castle. The explosion marked the second-most powerful nuclear test by the U.S.
It yielded 13,500 kilotons, much higher than the predicted yield of up to 10,000 kilotons. Within four days of the blast, its fallout reached Mexico City, roughly 7,100 miles (11,400km) away.
#6: Castle Bravo (1954)
Castle Bravo, the first of the Castle Operation series, accidentally became the most powerful nuclear bomb tested by the U.S.
Due to a design error, the explosive energy from the bomb reached 15,000 kilotons, two and a half times what was expected. The mushroom cloud climbed up to roughly 25 miles (40km).
As a result of the test, an area of 7,000 square miles was contaminated, and inhabitants of nearby atolls were exposed to high levels of radioactive fallout. Traces of the blast were found in Australia, India, Japan, and Europe.
#5, #4, #3: Soviet Tests #173, #174, #147 (1962)
In 1962, the Soviet Union conducted 78 nuclear tests, three of which produced the fifth, fourth, and third-most powerful explosions in history. Tests #173, #174, and #147 each yielded around 20,000 kilotons. Due to the absolute secrecy of these tests, no photos or videos have been released.
#2: Soviet Test #219 (1962)
Test #219 was an atmospheric nuclear test carried out using an intercontinental ballistic missile (ICBM), with the bomb exploding at a height of 2.3 miles (3.8km) above sea level. It was the second-most powerful nuclear explosion, with a yield of 24,200 kilotons and a destructive radius of ~25 miles (41km).
#1: Tsar Bomba (1961)
Tsar Bomba, also called Big Ivan, needed a specially designed plane because it was too heavy to carry on conventional aircraft. The bomb was attached to a giant parachute to give the plane time to fly away.
The explosion, yielding 50,000 kilotons, obliterated an abandoned village 34 miles (55km) away and generated a 5.0-5.25 magnitude earthquake in the surrounding region. Initially, it was designed as a 100,000 kiloton bomb, but its yield was cut to half its potential by the Soviet Union. Tsar Bomba’s mushroom cloud breached through the stratosphere to reach a height of over 37 miles (60km), roughly six times the flying height of commercial aircraft.
The two bombs dropped on Hiroshima and Nagasaki had devastating consequences, and their explosive yields were only a fraction of the 10 largest explosions. The power of modern nuclear weapons makes their scale of destruction truly unfathomable, and as history suggests, the outcomes can be unpredictable.


VC+
VC+: Get Our Key Takeaways From the IMF’s World Economic Outlook
A sneak preview of the exclusive VC+ Special Dispatch—your shortcut to understanding IMF’s World Economic Outlook report.

Have you read IMF’s latest World Economic Outlook yet? At a daunting 202 pages, we don’t blame you if it’s still on your to-do list.
But don’t worry, you don’t need to read the whole April release, because we’ve already done the hard work for you.
To save you time and effort, the Visual Capitalist team has compiled a visual analysis of everything you need to know from the report—and our VC+ Special Dispatch is available exclusively to VC+ members. All you need to do is log into the VC+ Archive.
If you’re not already subscribed to VC+, make sure you sign up now to access the full analysis of the IMF report, and more (we release similar deep dives every week).
For now, here’s what VC+ members get to see.
Your Shortcut to Understanding IMF’s World Economic Outlook
With long and short-term growth prospects declining for many countries around the world, this Special Dispatch offers a visual analysis of the key figures and takeaways from the IMF’s report including:
- The global decline in economic growth forecasts
- Real GDP growth and inflation forecasts for major nations in 2024
- When interest rate cuts will happen and interest rate forecasts
- How debt-to-GDP ratios have changed since 2000
- And much more!

Get the Full Breakdown in the Next VC+ Special Dispatch
VC+ members can access the full Special Dispatch by logging into the VC+ Archive, where you can also check out previous releases.
Make sure you join VC+ now to see exclusive charts and the full analysis of key takeaways from IMF’s World Economic Outlook.
Don’t miss out. Become a VC+ member today.
What You Get When You Become a VC+ Member
VC+ is Visual Capitalist’s premium subscription. As a member, you’ll get the following:
- Special Dispatches: Deep dive visual briefings on crucial reports and global trends
- Markets This Month: A snappy summary of the state of the markets and what to look out for
- The Trendline: Weekly curation of the best visualizations from across the globe
- Global Forecast Series: Our flagship annual report that covers everything you need to know related to the economy, markets, geopolitics, and the latest tech trends
- VC+ Archive: Hundreds of previously released VC+ briefings and reports that you’ve been missing out on, all in one dedicated hub
You can get all of the above, and more, by joining VC+ today.

-

 Misc1 week ago
How Hard Is It to Get Into an Ivy League School?
-

 Technology2 weeks ago
Ranked: Semiconductor Companies by Industry Revenue Share
-

 Markets2 weeks ago
Ranked: The World’s Top Flight Routes, by Revenue
-

 Demographics2 weeks ago
Population Projections: The World’s 6 Largest Countries in 2075
-

 Markets2 weeks ago
The Top 10 States by Real GDP Growth in 2023
-

 Demographics2 weeks ago
The Smallest Gender Wage Gaps in OECD Countries
-

 United States2 weeks ago
Where U.S. Inflation Hit the Hardest in March 2024
-

 Green2 weeks ago
Top Countries By Forest Growth Since 2001