Science
Visualizing the Composition of Blood


The Composition of Blood
Have you ever wondered what blood is made up of?
With the average adult possessing five to six liters of blood in the body, this fluid is vital to our lives, circulating oxygen through the body and serving many different functions.
Despite its simple, deep-red appearance, blood is comprised of many tiny chemical components. This infographic visualizes the composition of blood and the microscopic contents in it.
What is Blood Made Up Of?
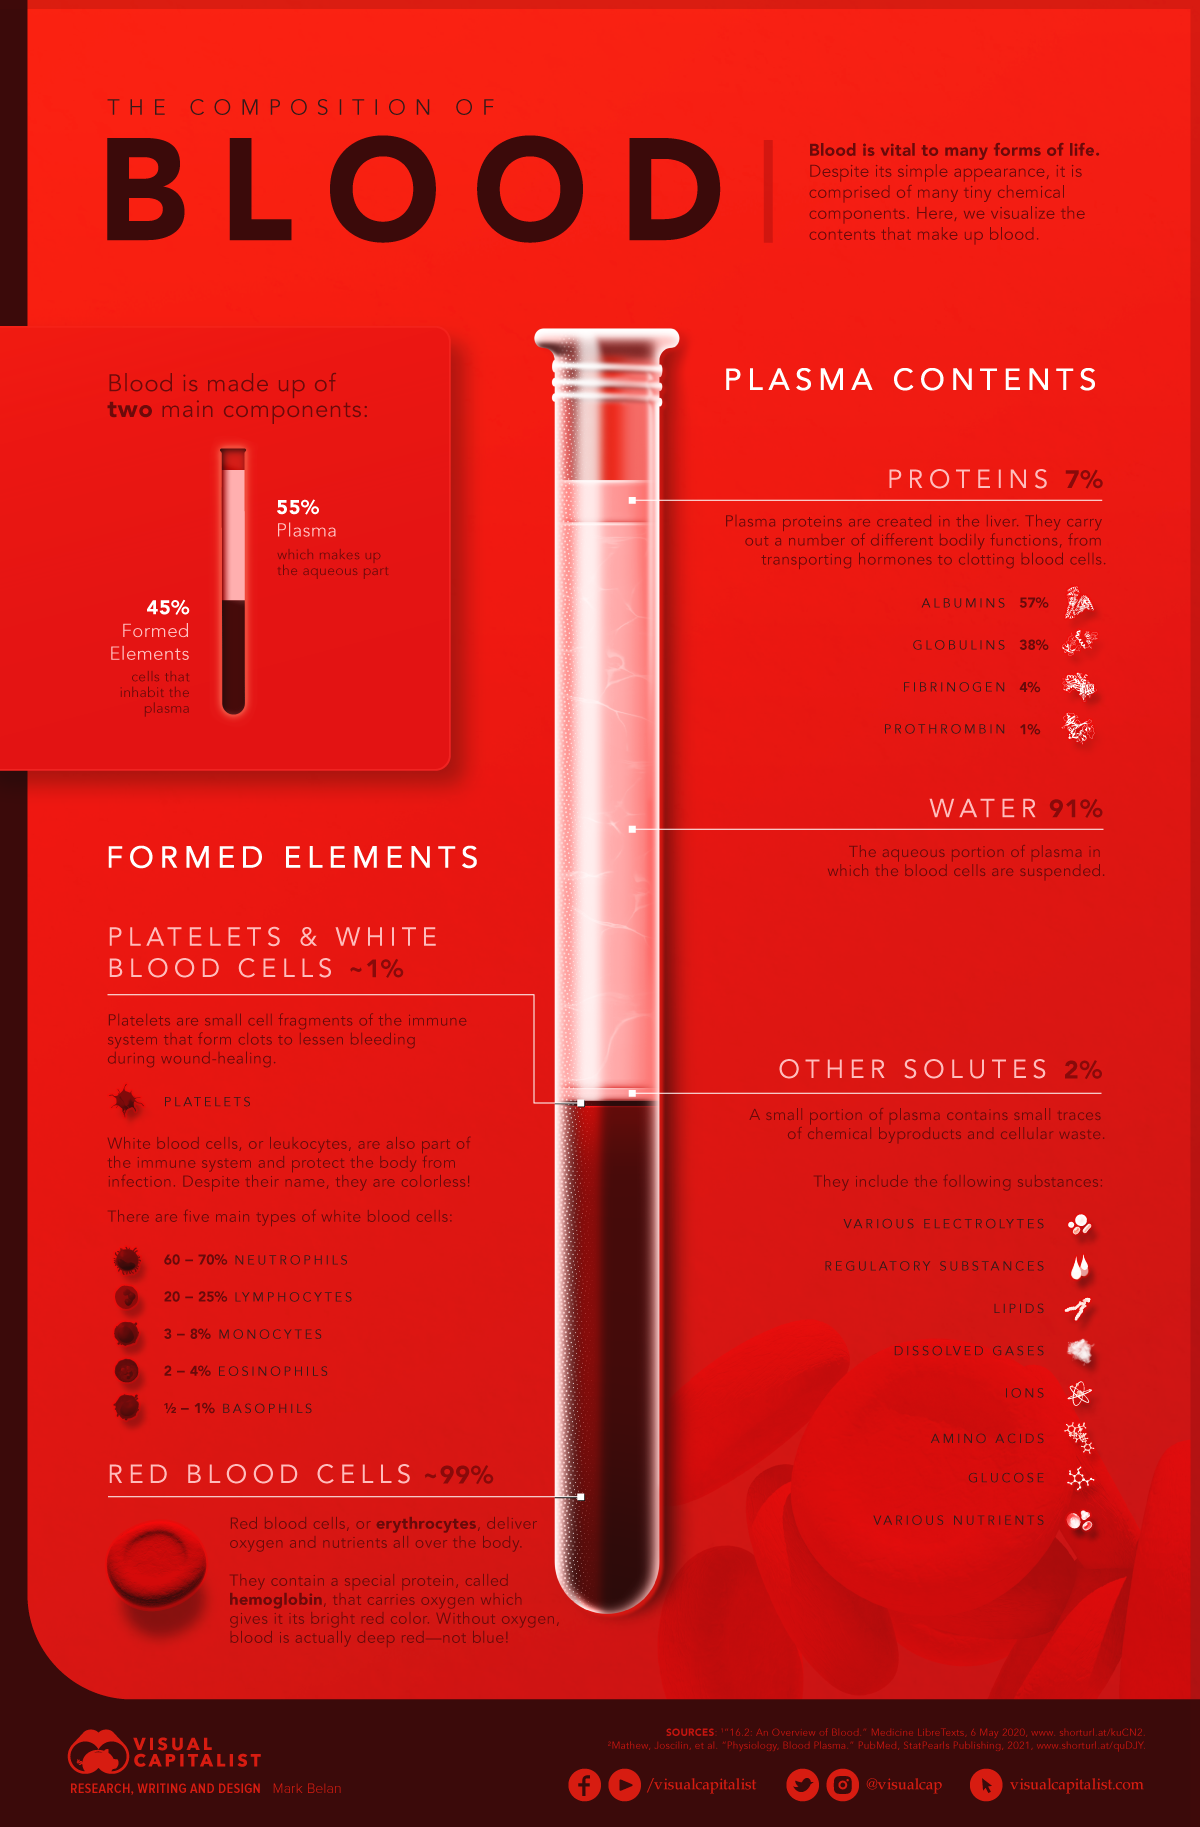
There are two main components that comprise blood:
- Plasma – 55%
Plasma is the fluid or aqueous part of blood, making up more than half of blood content. - Formed elements – 45%
Formed elements refer to the cells, platelets, and cell fragments that are suspended in the plasma.
Plasma
Plasma is primarily made up of water (91%), salts, and enzymes, but it also carries important proteins and components that serve many bodily functions.
Plasma proteins make up 7% of plasma contents and are created in the liver. These include:
- Albumins
These proteins keep fluids from leaking out of blood vessels into other parts of the body. They also transport important molecules like calcium and help neutralize toxins. - Globulins
These play an important role in clotting blood and fighting infections and are also transporters of hormones, minerals, and fats. - Fibrinogen and Prothrombin
Both of these proteins help stop bleeding by facilitating the creation of blood clots during wound-healing.
Water and proteins make up 98% of plasma in blood. The other 2% is made up of small traces of chemical byproducts and cellular waste, including electrolytes, glucose, and other nutrients.
Formed Elements
There are three categories of formed elements in blood: platelets, white blood cells, and red blood cells. Red blood cells make up 99% of formed elements, with the other 1% comprised of platelets and white blood cells.
- Platelets (Thrombocytes)
Platelets are cells from the immune system with the primary function of forming clots to reduce bleeding from wounds. This makes them critical not only for small wounds like cuts but also for surgeries and traumatic injuries. - White blood cells (Leukocytes)
White blood cells protect our bodies from infection. There are five types of white blood cells with different roles in fighting infections: some attack foreign cells and viruses, some produce antibodies, some clean up dead cells, and some respond to allergens. - Red blood cells (Erythrocytes)
Red blood cells deliver fresh oxygen and nutrients all over the body. They contain a special protein called hemoglobin, which carries oxygen and gives blood its bright red color.
The lifespan of a typical red blood cell is around 120 days, after which it dies and is replaced by a new cell. Our bodies are constantly producing red blood cells in the bone marrow, at a rate of millions of cells per second.
Abnormal Red Blood Cells
Normal red blood cells are round, flattened disks that are thinner in the middle. However, certain diseases and medical therapies can change the shape of red blood cells in different ways.
Here are the types of abnormal red blood cells and their associated diseases:
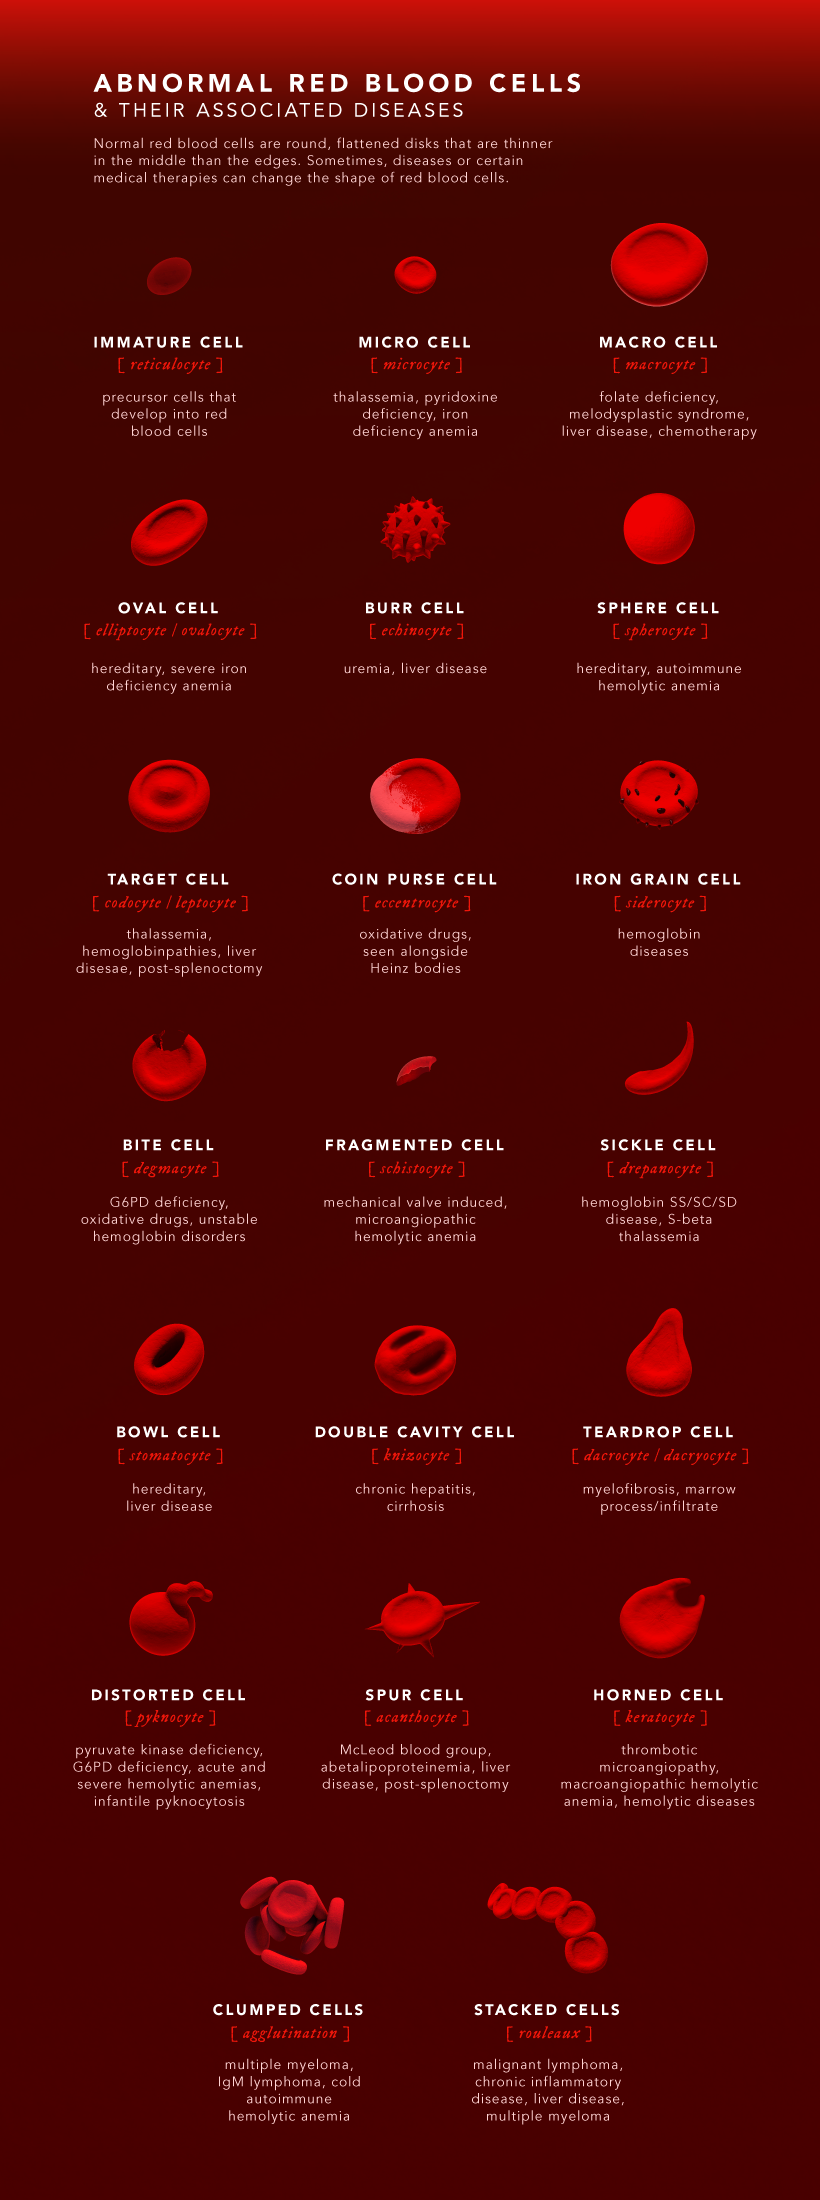
Sickle cell anemia is a well-known disease that affects the shape of red blood cells. Unlike normal, round red blood cells, cells associated with sickle cell disease are crescent- or sickle-shaped, which can slow and block blood flow.
Other common causes of abnormally shaped red blood cells are thalassemia, hereditary blood disorders, iron deficiency anemia, and liver disease. Identifying abnormal blood cells plays an important role in diagnosing the underlying causes and in finding treatments.
The Functions of Blood
We know that blood is vital, but what does it actually do in the body?
For starters, here are some of the functions of blood:
- Blood transports oxygen to different parts of the body, providing an energy source. It also delivers carbon dioxide to the lungs for exhalation.
- The platelets, white blood cells, and plasma proteins in blood play an important role in fighting infections and clotting.
- Blood transports the body’s waste products to the kidneys and liver, which filter it and recirculate clean blood.
- Blood helps regulate the body’s internal temperature by absorbing and distributing heat throughout the body.
While we all know that we can’t live without blood, it serves many different functions in the body that we often don’t notice. For humans and many other organisms alike, blood is an integral component that keeps us alive and going.


Science
Visualizing the Average Lifespans of Mammals
While smaller animals such as weasels typically live 1-2 years, larger counterparts can thrive for decades.
Visualizing the Average Lifespans of Mammals
This was originally posted on our Voronoi app. Download the app for free on iOS or Android and discover incredible data-driven charts from a variety of trusted sources.
Mammals, though comprising a small fraction of Earth’s creatures, hold vital ecological roles globally. They are crucial for maintaining ecosystem health through services like pollination, seed dispersal, and predator-prey dynamics.
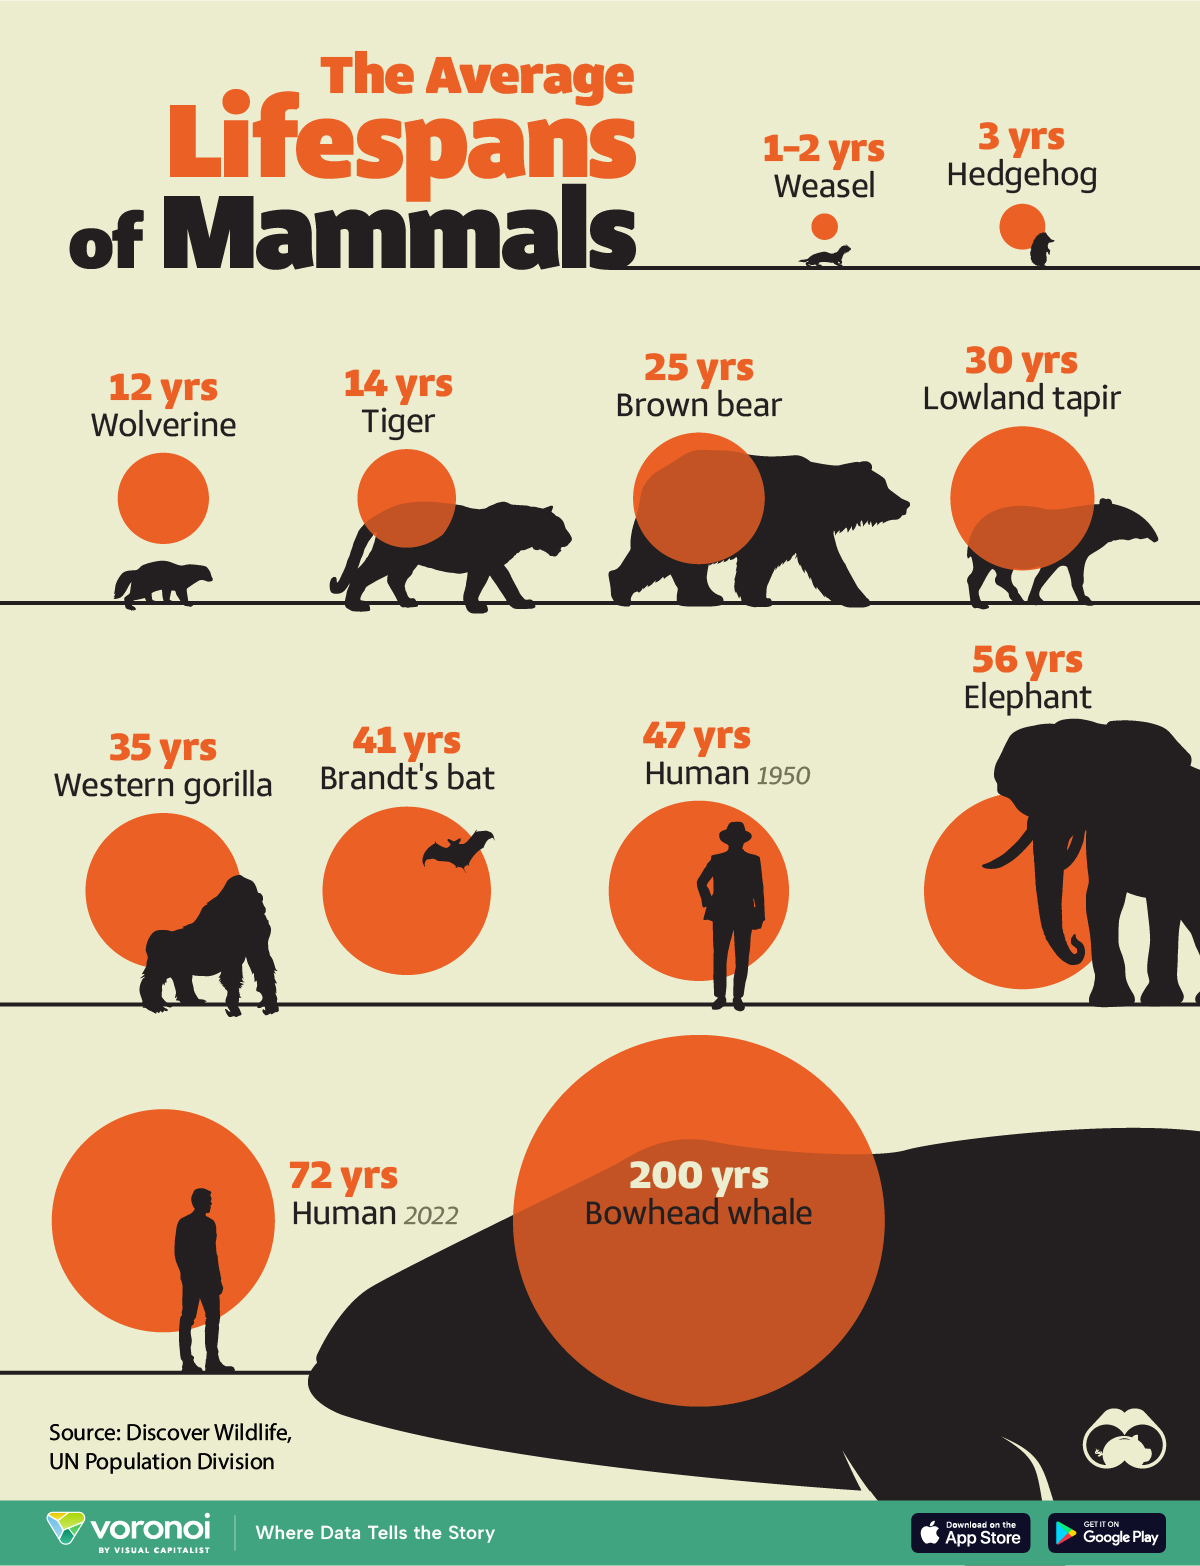
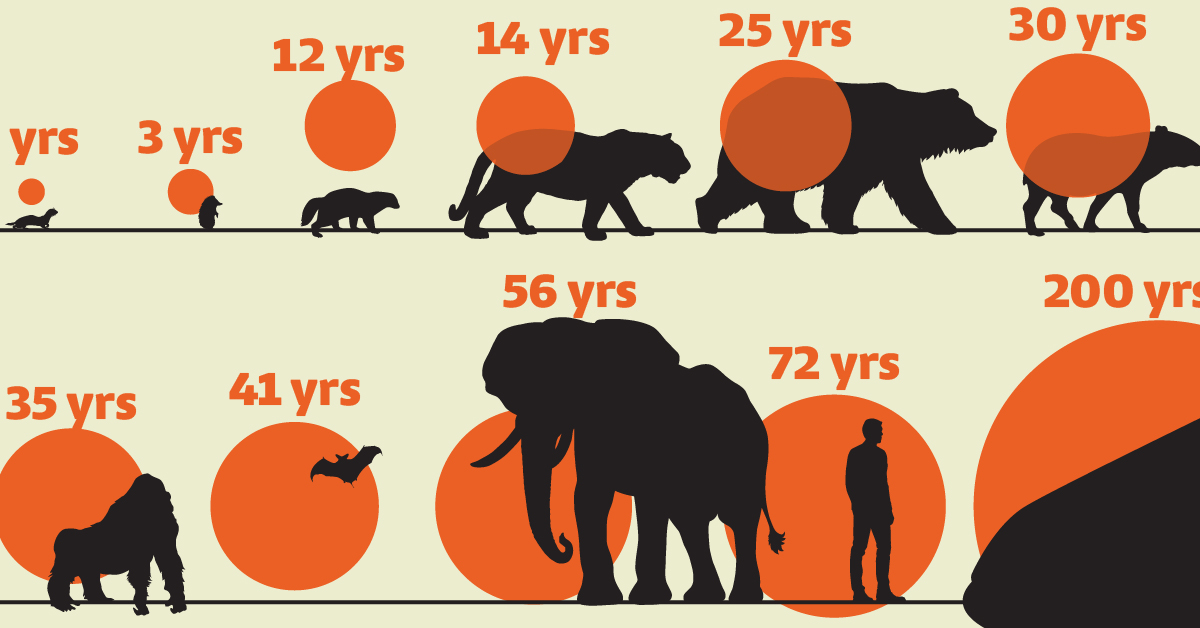
In this visualization, we depict the average lifespans of mammals, using data from Discover Wildlife and the United Nations.
Human Lifespans on the Rise
Defined as warm-blooded creatures with hair or fur, mammals nurse their young with milk from mammary glands. While smaller animals such as weasels typically live 1-2 years, larger counterparts like elephants can thrive for decades, and bowhead whales can live for 200 years, or even longer.
| Animal | Average lifespan (years) |
|---|---|
| Weasel | 1 to 2 |
| Hedgehog | 3 |
| Wolverine | 12 |
| Tiger | 14 |
| Brown bear | 25 |
| Lowland tapir | 30 |
| Western gorilla | 35 |
| Brandt's bat | 41 |
| Humans (1950) | 47 |
| Elephant | 56 |
| Humans (2022) | 72 |
| Bowhead whale | 200 |
Notably, human lifespans have experienced a remarkable surge. According to the UN Population Division, the global average life expectancy has surged from 47 years in 1950 to 72 years in 2022, marking a 25-year increase. This is attributed to advancements in nutrition, medication, and essential resources.
However, as human longevity flourishes, it can have an adverse effect on wildlife mammal populations. To put this into numbers, over the past 100,000 years, the surge in human population has precipitated an 85% reduction in wild mammal biomass.
Today, livestock dominates 62% of the world’s mammal biomass, with humans accounting for 34%, while wild mammals comprise only 4%.
Despite a decline in mammal diversity, the total biomass of terrestrial mammals has significantly increased, expanding approximately ninefold over the past 10,000 years.
Curious to learn more about mammals? Check out this graphic that shows the biomass of all the world’s mammals.

-

 Science1 week ago
Visualizing the Average Lifespans of Mammals
-

 Markets2 weeks ago
The Top 10 States by Real GDP Growth in 2023
-

 Demographics2 weeks ago
The Smallest Gender Wage Gaps in OECD Countries
-

 Economy2 weeks ago
Where U.S. Inflation Hit the Hardest in March 2024
-

 Green2 weeks ago
Top Countries By Forest Growth Since 2001
-

 United States2 weeks ago
Ranked: The Largest U.S. Corporations by Number of Employees
-

 Maps2 weeks ago
The Largest Earthquakes in the New York Area (1970-2024)
-

 Green2 weeks ago
Ranked: The Countries With the Most Air Pollution in 2023