Money
The Racial Wealth Gap in America: Asset Types Held by Race


The Racial Wealth Gap
People of color have faced economic inequality for generations, and the recent wave of Black Lives Matter protests has renewed discussions on these disparities.
Compared to White families, other races have lower levels of income and net worth. They are also less likely to hold assets of any type. In fact, 19% of Black families have zero or negative net worth, while only 9% of White households have no wealth.
Today’s chart uses data from the U.S. Federal Reserve’s triennial Survey of Consumer Finances to highlight the racial wealth gap, and the proportion of households that own different kinds of assets by racial group.
Asset Types Held By Race
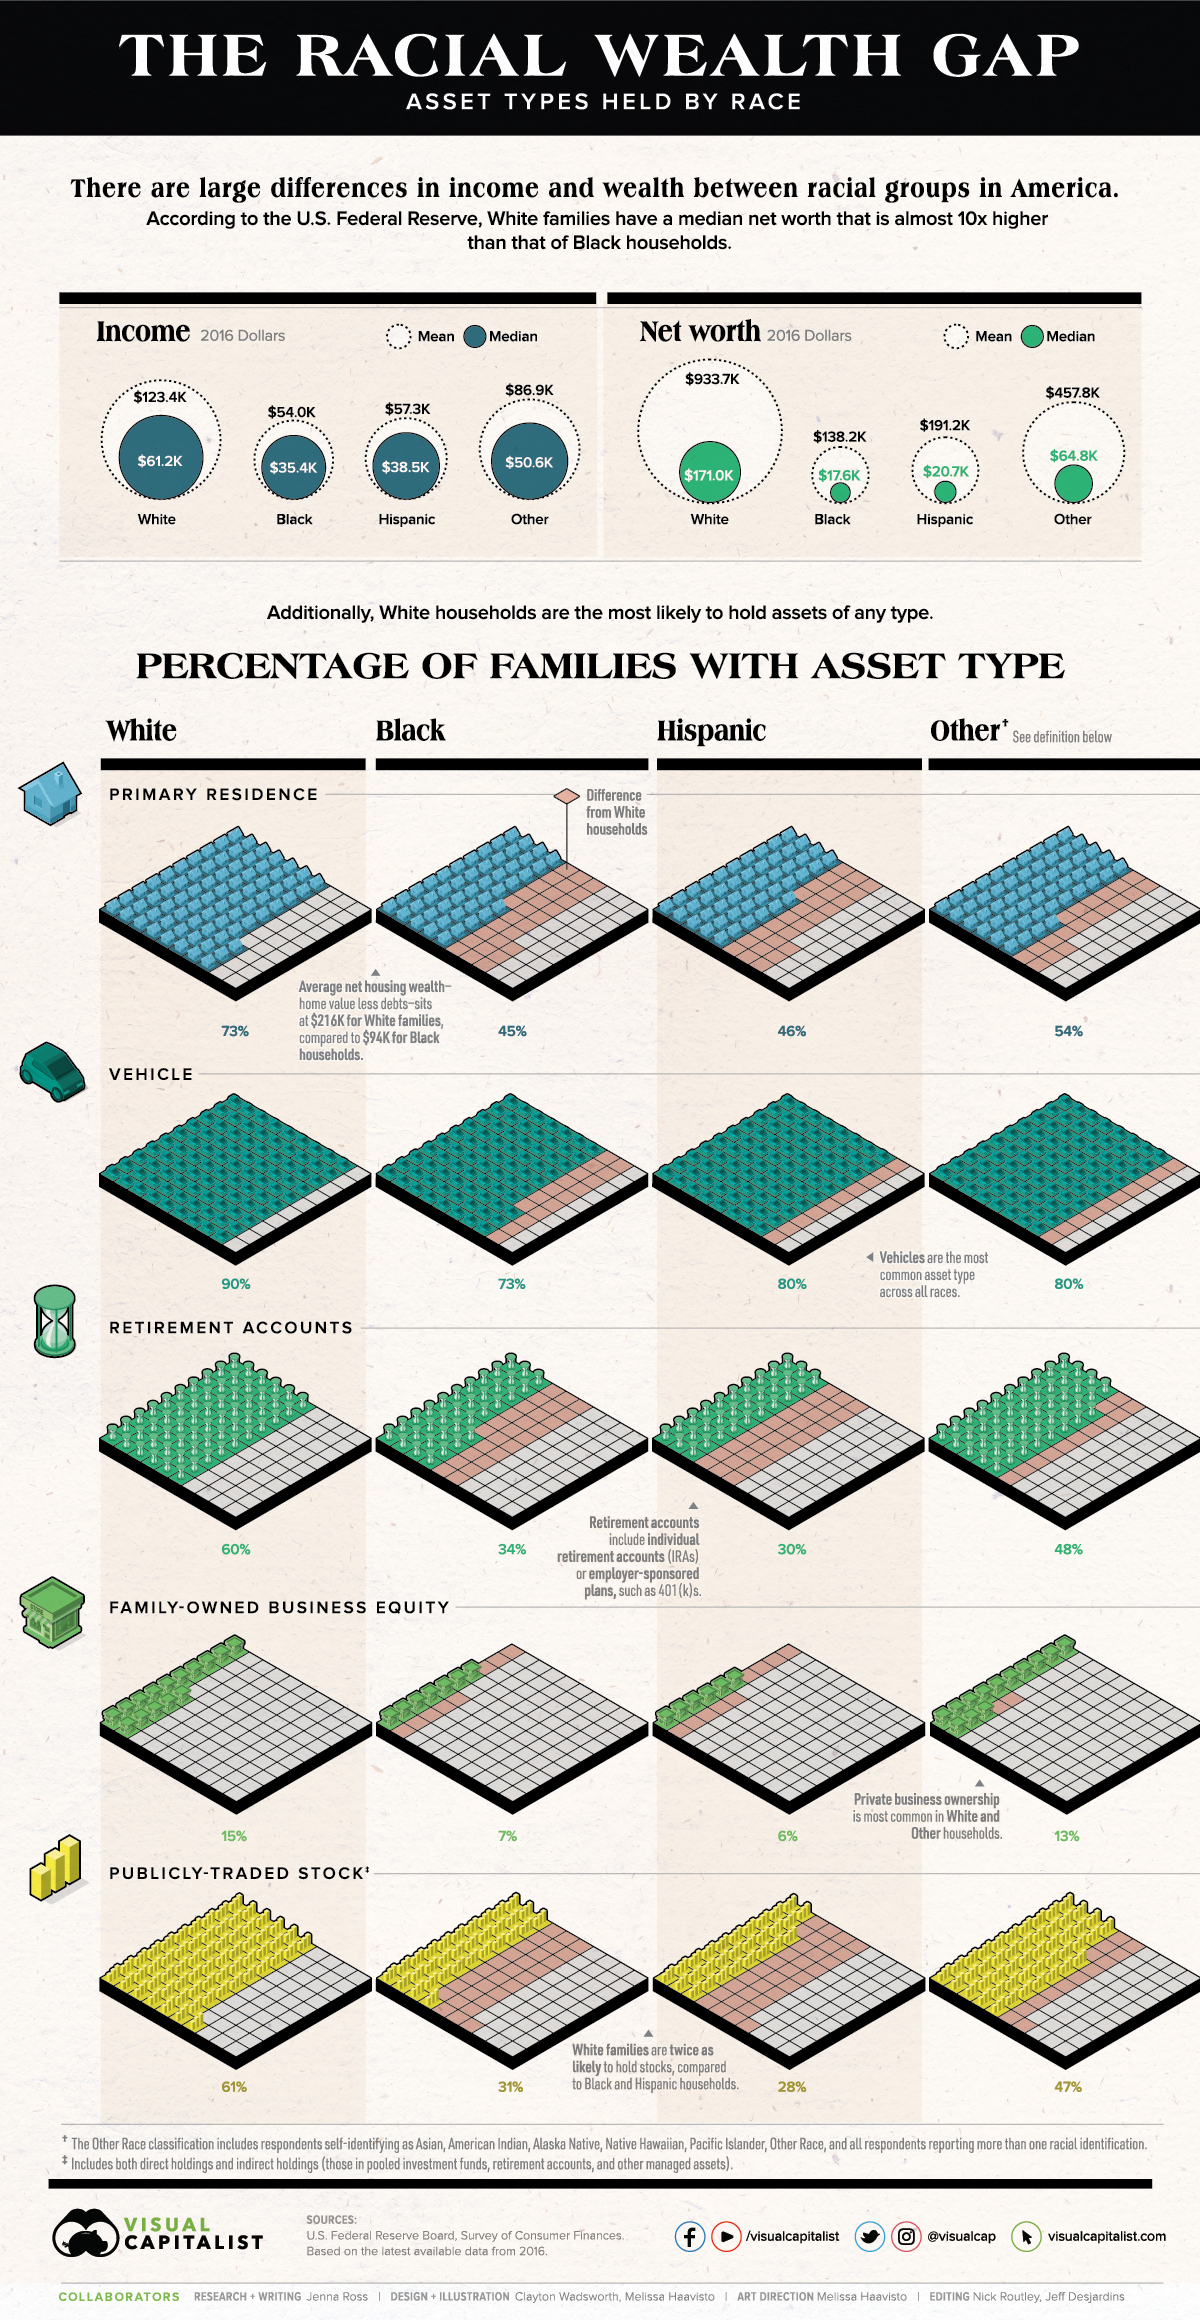
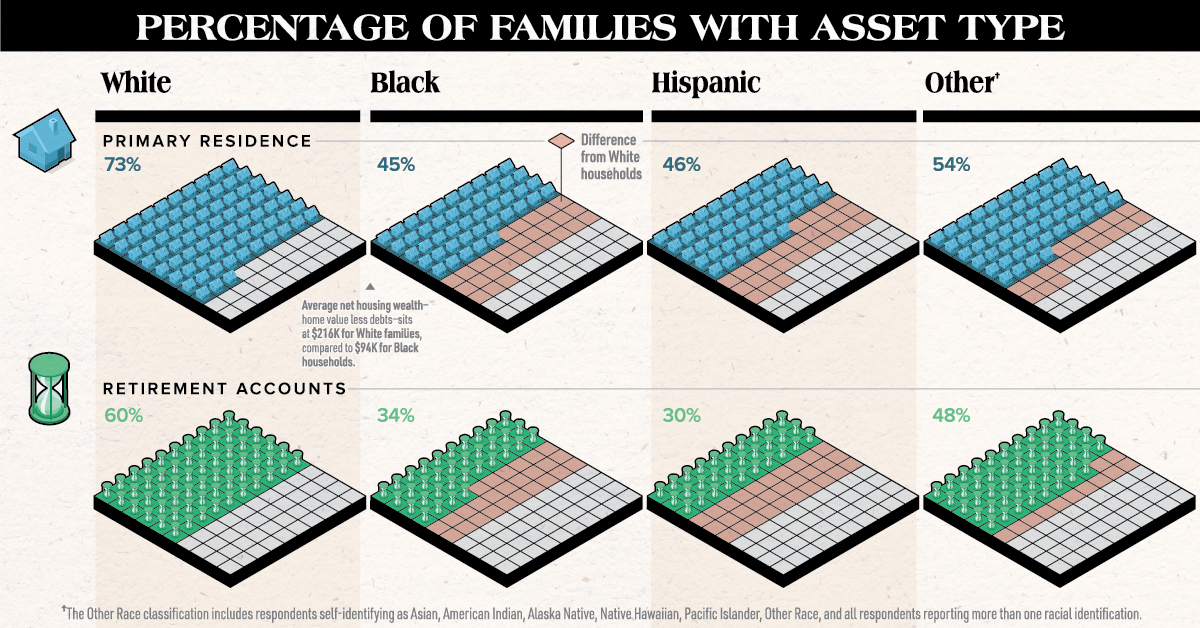
The financial profile between racial groups varies widely. Below is the percentage of U.S. families with each type of asset, according to the most recent survey from 2016.
| White | Black | Hispanic | Other | |
|---|---|---|---|---|
| Primary Residence | 73% | 45% | 46% | 54% |
| Vehicle | 90% | 73% | 80% | 80% |
| Retirement Accounts | 60% | 34% | 30% | 48% |
| Family-owned Business Equity | 15% | 7% | 6% | 13% |
| Publicly-traded Stocks | 61% | 31% | 28% | 47% |
Vehicles are the most common asset across all racial groups, followed by a primary residence.
However, the level of equity—or home value less debts—families have in their houses differs by race. White families have equity of $215,800, whereas Black and Hispanic households have net housing wealth of $94,400 and $129,800 respectively.
In addition, White households are more likely to hold financial assets such as retirement accounts, family businesses, and stocks. These assets are instrumental in building wealth, and are prominent in the wealth composition of America’s richest families.
With fewer people of color holding these assets, they miss out on higher average returns than low-risk assets, as well as the power of compound interest. These portfolio differences are striking, but they are not the most important contributing factor in the racial wealth gap.
Demographic and Economic Variations
White households are also more likely to have demographic characteristics that are associated with wealth. According to the U.S. Federal Reserve, they are:
- Older, with more than half of households age 55 and up
- More highly educated, with 51% having some type of degree
- Less likely to have a single parent
- More likely to have received an inheritance
For example, 39% of White heads of households have a bachelor’s degree or higher, compared to 23% and 17% for Black and Hispanic household heads, respectively. However, education doesn’t fully explain the wealth inequities.
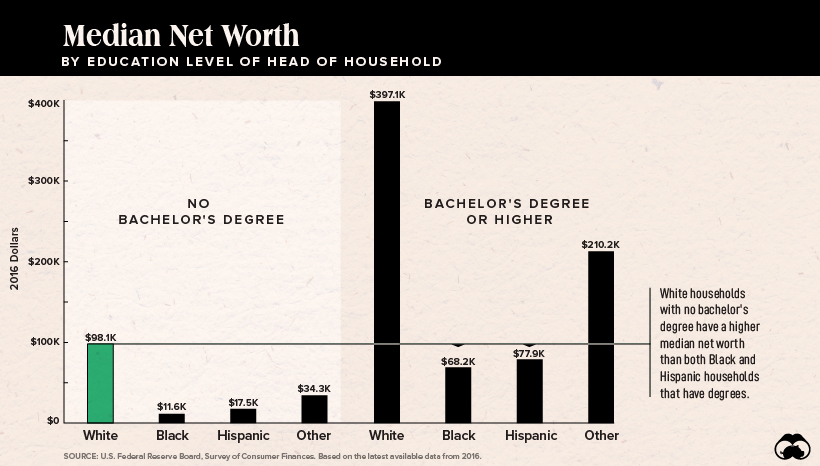
Enormous wealth disparities exist between families with the same education level. Even in cases where Black and Hispanic household heads have obtained a bachelor’s degree, their families’ median wealth of $68,000 and $78,000 respectively is still lower than the $98,000 median wealth for White families where the head has no bachelor’s degree.
After accounting for demographic factors, researchers still found there were considerable inequities. What, then, could be primarily responsible for the racial wealth gap?
The Income Gap
While previous research found that the wealth gap is “too big” to be explained by a difference in income, a recent study from the Federal Reserve Bank of Cleveland offers a new perspective. Focusing on White and Black U.S. households only, researchers analyzed the dynamics of wealth accumulation over time, as opposed to previous studies that considered short time periods.
They found that income inequality was the primary contributor to the racial wealth gap. According to the model, if Black and White households had earned the same labor income from 1962 onwards, the Black-to-White wealth ratio would have reached 0.9 by 2007.
Moving forward, the study concludes that policy changes will likely have a positive impact if they address issues contributing to income gaps. This includes reducing racial discrimination in the labor market, and creating programs, such as mentorships, that improve environments for specific racial subgroups.


Money
Charted: Which City Has the Most Billionaires in 2024?
Just two countries account for half of the top 20 cities with the most billionaires. And the majority of the other half are found in Asia.


Charted: Which Country Has the Most Billionaires in 2024?
This was originally posted on our Voronoi app. Download the app for free on iOS or Android and discover incredible data-driven charts from a variety of trusted sources.
Some cities seem to attract the rich. Take New York City for example, which has 340,000 high-net-worth residents with investable assets of more than $1 million.
But there’s a vast difference between being a millionaire and a billionaire. So where do the richest of them all live?
Using data from the Hurun Global Rich List 2024, we rank the top 20 cities with the highest number of billionaires in 2024.
A caveat to these rich lists: sources often vary on figures and exact rankings. For example, in last year’s reports, Forbes had New York as the city with the most billionaires, while the Hurun Global Rich List placed Beijing at the top spot.
Ranked: Top 20 Cities with the Most Billionaires in 2024
The Chinese economy’s doldrums over the course of the past year have affected its ultra-wealthy residents in key cities.
Beijing, the city with the most billionaires in 2023, has not only ceded its spot to New York, but has dropped to #4, overtaken by London and Mumbai.
| Rank | City | Billionaires | Rank Change YoY |
|---|---|---|---|
| 1 | 🇺🇸 New York | 119 | +1 |
| 2 | 🇬🇧 London | 97 | +3 |
| 3 | 🇮🇳 Mumbai | 92 | +4 |
| 4 | 🇨🇳 Beijing | 91 | -3 |
| 5 | 🇨🇳 Shanghai | 87 | -2 |
| 6 | 🇨🇳 Shenzhen | 84 | -2 |
| 7 | 🇭🇰 Hong Kong | 65 | -1 |
| 8 | 🇷🇺 Moscow | 59 | No Change |
| 9 | 🇮🇳 New Delhi | 57 | +6 |
| 10 | 🇺🇸 San Francisco | 52 | No Change |
| 11 | 🇹🇭 Bangkok | 49 | +2 |
| 12 | 🇹🇼 Taipei | 45 | +2 |
| 13 | 🇫🇷 Paris | 44 | -2 |
| 14 | 🇨🇳 Hangzhou | 43 | -5 |
| 15 | 🇸🇬 Singapore | 42 | New to Top 20 |
| 16 | 🇨🇳 Guangzhou | 39 | -4 |
| 17T | 🇮🇩 Jakarta | 37 | +1 |
| 17T | 🇧🇷 Sao Paulo | 37 | No Change |
| 19T | 🇺🇸 Los Angeles | 31 | No Change |
| 19T | 🇰🇷 Seoul | 31 | -3 |
In fact all Chinese cities on the top 20 list have lost billionaires between 2023–24. Consequently, they’ve all lost ranking spots as well, with Hangzhou seeing the biggest slide (-5) in the top 20.
Where China lost, all other Asian cities—except Seoul—in the top 20 have gained ranks. Indian cities lead the way, with New Delhi (+6) and Mumbai (+3) having climbed the most.
At a country level, China and the U.S combine to make up half of the cities in the top 20. They are also home to about half of the world’s 3,200 billionaire population.
In other news of note: Hurun officially counts Taylor Swift as a billionaire, estimating her net worth at $1.2 billion.

-

 Debt1 week ago
How Debt-to-GDP Ratios Have Changed Since 2000
-

 Markets2 weeks ago
Ranked: The World’s Top Flight Routes, by Revenue
-

 Countries2 weeks ago
Population Projections: The World’s 6 Largest Countries in 2075
-

 Markets2 weeks ago
The Top 10 States by Real GDP Growth in 2023
-

 Demographics2 weeks ago
The Smallest Gender Wage Gaps in OECD Countries
-

 United States2 weeks ago
Where U.S. Inflation Hit the Hardest in March 2024
-

 Green2 weeks ago
Top Countries By Forest Growth Since 2001
-

 United States2 weeks ago
Ranked: The Largest U.S. Corporations by Number of Employees