Misc
Visualizing Women’s Economic Rights Around the World


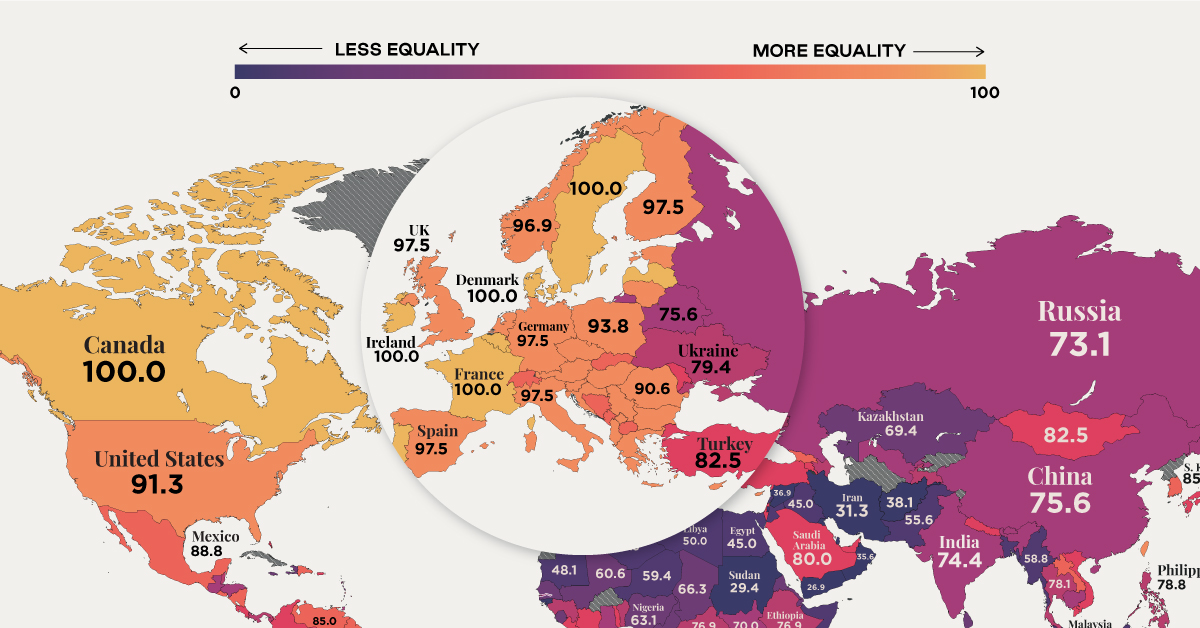
Visualizing Women’s Economic Rights in Each Country
In recent years, many economies have made women’s rights a priority by eliminating job restrictions, working to reduce the gender wage gap, or changing legislation related to marriage and parenthood.
Still, many laws continue to inhibit women’s ability to enter the workforce or start a business—and even to travel outside their homes in the same way as men. In fact, on average globally, women have just three-quarters of the economic rights of men.
This map uses data from the Women, Business and Law 2021 report by the World Bank, to visualize women’s economic rights around the world.
Legal Protections
According to the World Bank, only 10 countries offer full legal protections to women, and all of them are in the Northern Hemisphere.
In ranking countries, the institution considers indicators like equal remuneration, legal rights, and mobility. A score of 100 means that women are on equal legal standing with men across all areas measured.
| Rank | Country/Territory | Score |
|---|---|---|
| 1 | Belgium | 100.0 |
| 1 | Canada | 100.0 |
| 1 | Denmark | 100.0 |
| 1 | France | 100.0 |
| 1 | Iceland | 100.0 |
| 1 | Ireland | 100.0 |
| 1 | Latvia | 100.0 |
| 1 | Luxembourg | 100.0 |
| 1 | Portugal | 100.0 |
| 1 | Sweden | 100.0 |
| 2 | Estonia | 97.5 |
| 2 | Finland | 97.5 |
| 2 | Germany | 97.5 |
| 2 | Greece | 97.5 |
| 2 | Italy | 97.5 |
| 2 | Netherlands | 97.5 |
| 2 | New Zealand | 97.5 |
| 2 | Spain | 97.5 |
| 2 | United Kingdom | 97.5 |
| 3 | Australia | 96.9 |
| 3 | Austria | 96.9 |
| 3 | Hungary | 96.9 |
| 3 | Norway | 96.9 |
| 3 | Slovenia | 96.9 |
| 4 | Peru | 95.0 |
| 5 | Paraguay | 94.4 |
| 6 | Croatia | 93.8 |
| 6 | Czech Republic | 93.8 |
| 6 | Lithuania | 93.8 |
| 6 | Poland | 93.8 |
| 6 | Serbia | 93.8 |
| 7 | Kosovo | 91.9 |
| 7 | Mauritius | 91.9 |
| 8 | Albania | 91.3 |
| 8 | Cyprus | 91.3 |
| 8 | Taiwan, China | 91.3 |
| 8 | United States | 91.3 |
| 9 | Bulgaria | 90.6 |
| 9 | Romania | 90.6 |
| 10 | Ecuador | 89.4 |
| 10 | Hong Kong, China | 89.4 |
| 11 | Bolivia | 88.8 |
| 11 | El Salvador | 88.8 |
| 11 | Malta | 88.8 |
| 11 | Mexico | 88.8 |
| 11 | Uruguay | 88.8 |
| 12 | Lao PDR | 88.1 |
| 12 | Montenegro | 88.1 |
| 12 | South Africa | 88.1 |
| 13 | Guyana | 86.9 |
| 13 | Zimbabwe | 86.9 |
| 14 | Cabo Verde | 86.3 |
| 14 | Dominican Republic | 86.3 |
| 14 | Namibia | 86.3 |
| 14 | Nicaragua | 86.3 |
| 14 | São Tomé and Príncipe | 86.3 |
| 15 | Georgia | 85.6 |
| 15 | Switzerland | 85.6 |
| 16 | Bosnia and Herzegovina | 85.0 |
| 16 | Brazil | 85.0 |
| 16 | Korea, Rep. | 85.0 |
| 16 | North Macedonia | 85.0 |
| 16 | Slovak Republic | 85.0 |
| 16 | Venezuela | 85.0 |
| 17 | Moldova | 84.4 |
| 17 | Togo | 84.4 |
| 18 | Liberia | 83.8 |
| 18 | Puerto Rico (US) | 83.8 |
| 18 | St. Lucia | 83.8 |
| 19 | Costa Rica | 83.1 |
| 19 | Côte d'Ivoire | 83.1 |
| 19 | Timor-Leste | 83.1 |
| 20 | Armenia | 82.5 |
| 20 | Fiji | 82.5 |
| 20 | Mongolia | 82.5 |
| 20 | Mozambique | 82.5 |
| 20 | Singapore | 82.5 |
| 20 | Turkey | 82.5 |
| 20 | United Arab Emirates | 82.5 |
| 21 | Colombia | 81.9 |
| 21 | Japan | 81.9 |
| 21 | Vietnam | 81.9 |
| 22 | Bahamas | 81.3 |
| 22 | Tanzania | 81.3 |
| 22 | Zambia | 81.3 |
| 23 | Grenada | 80.6 |
| 23 | Israel | 80.6 |
| 23 | Kenya | 80.6 |
| 23 | Nepal | 80.6 |
| 23 | Rwanda | 80.6 |
| 24 | Chile | 80.0 |
| 24 | Samoa | 80.0 |
| 24 | San Marino | 80.0 |
| 24 | Saudi Arabia | 80.0 |
| 25 | Belize | 79.4 |
| 25 | Burkina Faso | 79.4 |
| 25 | Panama | 79.4 |
| 25 | Ukraine | 79.4 |
| 26 | Azerbaijan | 78.8 |
| 26 | Congo, Dem. Rep. | 78.8 |
| 26 | Kiribati | 78.8 |
| 26 | Philippines | 78.8 |
| 26 | Tajikistan | 78.8 |
| 27 | Lesotho | 78.1 |
| 27 | Thailand | 78.1 |
| 28 | Benin | 77.5 |
| 28 | Malawi | 77.5 |
| 29 | Barbados | 76.9 |
| 29 | Central African Republic | 76.9 |
| 29 | Ethiopia | 76.9 |
| 29 | Kyrgyz Republic | 76.9 |
| 30 | Argentina | 76.3 |
| 30 | Guinea | 76.3 |
| 30 | Seychelles | 76.3 |
| 31 | Belarus | 75.6 |
| 31 | China | 75.6 |
| 31 | Morocco | 75.6 |
| 32 | Cambodia | 75.0 |
| 32 | Ghana | 75.0 |
| 32 | Honduras | 75.0 |
| 32 | Trinidad and Tobago | 75.0 |
| 33 | Gambia | 74.4 |
| 33 | India | 74.4 |
| 33 | Madagascar | 74.4 |
| 34 | Maldives | 73.8 |
| 34 | Suriname | 73.8 |
| 35 | Angola | 73.1 |
| 35 | Burundi | 73.1 |
| 35 | Russia | 73.1 |
| 35 | Uganda | 73.1 |
| 36 | Bhutan | 71.9 |
| 37 | St. Kitts and Nevis | 71.3 |
| 38 | Guatemala | 70.6 |
| 38 | Uzbekistan | 70.6 |
| 39 | South Sudan | 70.0 |
| 40 | Eritrea | 69.4 |
| 40 | Kazakhstan | 69.4 |
| 40 | Sierra Leone | 69.4 |
| 41 | Dijibouti | 68.1 |
| 41 | Jamaica | 68.1 |
| 41 | Marshall Islands | 68.1 |
| 41 | St. Vicent and the Grenadines | 68.1 |
| 42 | Tunisia | 67.5 |
| 43 | Senegal | 66.9 |
| 44 | Antigua and Barbuda | 66.3 |
| 44 | Chad | 66.3 |
| 45 | Sri Lanka | 65.6 |
| 46 | Comoros | 65.0 |
| 47 | Indonesia | 64.4 |
| 48 | Botswana | 63.8 |
| 48 | Haiti | 63.8 |
| 48 | Micronesia | 63.8 |
| 49 | Nigeria | 63.1 |
| 50 | Dominica | 62.5 |
| 51 | Mali | 60.6 |
| 52 | Cameroon | 60.0 |
| 52 | Papua New Guinea | 60.0 |
| 53 | Niger | 59.4 |
| 54 | Myanmar | 58.8 |
| 54 | Palau | 58.8 |
| 54 | Tonga | 58.8 |
| 55 | Vanuatu | 58.1 |
| 56 | Algeria | 57.5 |
| 56 | Gabon | 57.5 |
| 57 | Solomon Islands | 56.9 |
| 58 | Bahrain | 55.6 |
| 58 | Pakistan | 55.6 |
| 59 | Brunei Darussalam | 53.1 |
| 60 | Lebanon | 52.5 |
| 61 | Equatorial Guinea | 51.9 |
| 62 | Libya | 50.0 |
| 62 | Malaysia | 50.0 |
| 63 | Bangladesh | 49.4 |
| 63 | Congo, Rep. | 49.4 |
| 64 | Mauritania | 48.1 |
| 65 | Jordan | 46.9 |
| 65 | Somalia | 46.9 |
| 66 | Eswatini | 46.3 |
| 67 | Egypt | 45.0 |
| 67 | Iraq | 45.0 |
| 68 | Guinea-Bissau | 42.5 |
| 69 | Afghanistan | 38.1 |
| 70 | Syria | 36.9 |
| 71 | Oman | 35.6 |
| 72 | Iran | 31.3 |
| 73 | Qatar | 29.4 |
| 73 | Sudan | 29.4 |
| 74 | Kuwait | 28.8 |
| 75 | Yemen | 26.9 |
| 76 | West Bank and Gaza | 26.3 |
According to the report, there are 20 economies in the world where women still have half or fewer of the legal economic rights of men.
Under Taliban rule, for example, women in Afghanistan have limited access to education and work. In the Gaza Strip, women must have the permission of a male guardian to travel.
Yet, some differences are also seen in developed countries.
In the U.S, women still earn an average of about 82 cents for each dollar earned by men, and the gap across many countries in Europe is similar. Meanwhile, women are represented in just 23% of seats in national parliaments globally, and make up just 13% of agricultural landholders.
The Shadow Pandemic
COVID-19 has exacerbated existing inequalities that disadvantage girls and women, including barriers to attend school and maintain jobs, according to the United Nations.
In fact, new research shows that the sectors that have been most affected by the pandemic so far are those with high levels of women workers, including the restaurant and hospitality business, as well as the travel sector.
While leaders debate recovery in a post-pandemic world, rights equality remains a central topic for social and economic development.


Misc
Visualizing the Most Common Pets in the U.S.
Lions, tigers, and bears, oh my!—these animals do not feature on this list of popular American household pets.


Visualizing The Most Common Pets in the U.S.
This was originally posted on our Voronoi app. Download the app for free on iOS or Android and discover incredible data-driven charts from a variety of trusted sources.
In this graphic, we visualized the most common American household pets, based on 2023-2024 data from the American Pet Products Association (accessed via Forbes Advisor).
Figures represent the number of households that own each pet type, rather than the actual number of each animal. The “small animal” category includes hamsters, gerbils, rabbits, guinea pigs, chinchillas, mice, rats, and ferrets.
What is the Most Popular American Household Pet?
Based on this data, dogs—one of the first domesticated animals—are the most common pets in the United States. In fact, around 65 million households own a dog, and spend an average of $900 a year on their care.
| Rank | Species | Households |
|---|---|---|
| 1 | 🐶 Dog | 65M |
| 2 | 🐱 Cat | 47M |
| 3 | 🐟 Freshwater Fish | 11M |
| 4 | 🐰 Small Animals | 7M |
| 5 | 🐦 Bird | 6M |
| 6 | 🦎 Reptile | 6M |
| 7 | 🐴 Horse | 2M |
| 8 | 🐠 Saltwater Fish | 2M |
Note: Households can own multiple pets, and are counted for all relevant categories.
Cats rank second, at 47 million households, and these smaller felines are a little less expensive to own at $700/year according to Forbes estimates.
But aside from these two juggernauts, there are plenty of other common pet types found in households across the country.
Freshwater fish can be found in 11 million households, along with small animals—rabbits, hamsters, guinea pigs—in 7 million. Meanwhile, nearly 6 million homes have birds or reptiles.
Pet Ownership is on the Rise in America
Forbes found that 66% of all American households (numbering 87 million) own at least one pet, up from 56% in 1988. One third of these (29 million) own multiple pets.
A combination of factors is driving this increase: rising incomes, delayed childbirth, and of course the impact of the pandemic which nearly cleared out animal shelters across the globe.
America’s loneliness epidemic may also be a factor. Fledgling research has shown that single-individual households with pets recorded lower rates of loneliness during the pandemic than those without a pet.

-

 Science1 week ago
Visualizing the Average Lifespans of Mammals
-

 Demographics2 weeks ago
The Smallest Gender Wage Gaps in OECD Countries
-

 United States2 weeks ago
Where U.S. Inflation Hit the Hardest in March 2024
-

 Green2 weeks ago
Top Countries By Forest Growth Since 2001
-

 United States2 weeks ago
Ranked: The Largest U.S. Corporations by Number of Employees
-

 Maps2 weeks ago
The Largest Earthquakes in the New York Area (1970-2024)
-

 Green2 weeks ago
Ranked: The Countries With the Most Air Pollution in 2023
-

 Green2 weeks ago
Ranking the Top 15 Countries by Carbon Tax Revenue