Money
Visualizing the Pyramid of Global Wealth Distribution
Visualizing the Pyramid of Global Wealth Distribution
Who controls global wealth?
In 2022, the world’s millionaires held nearly half of net household wealth. Decades of low interest rates led equities and real estate values to soar, and these assets are disproportionately held among the world’s wealthiest.
While a steep rise in interest rates decreased these fortunes in 2022, the share of wealth controlled by the global millionaire population remains substantial.
The above graphic shows the distribution of global household wealth, based on the annual 2023 UBS Global Wealth Report.
The Distribution of Global Wealth
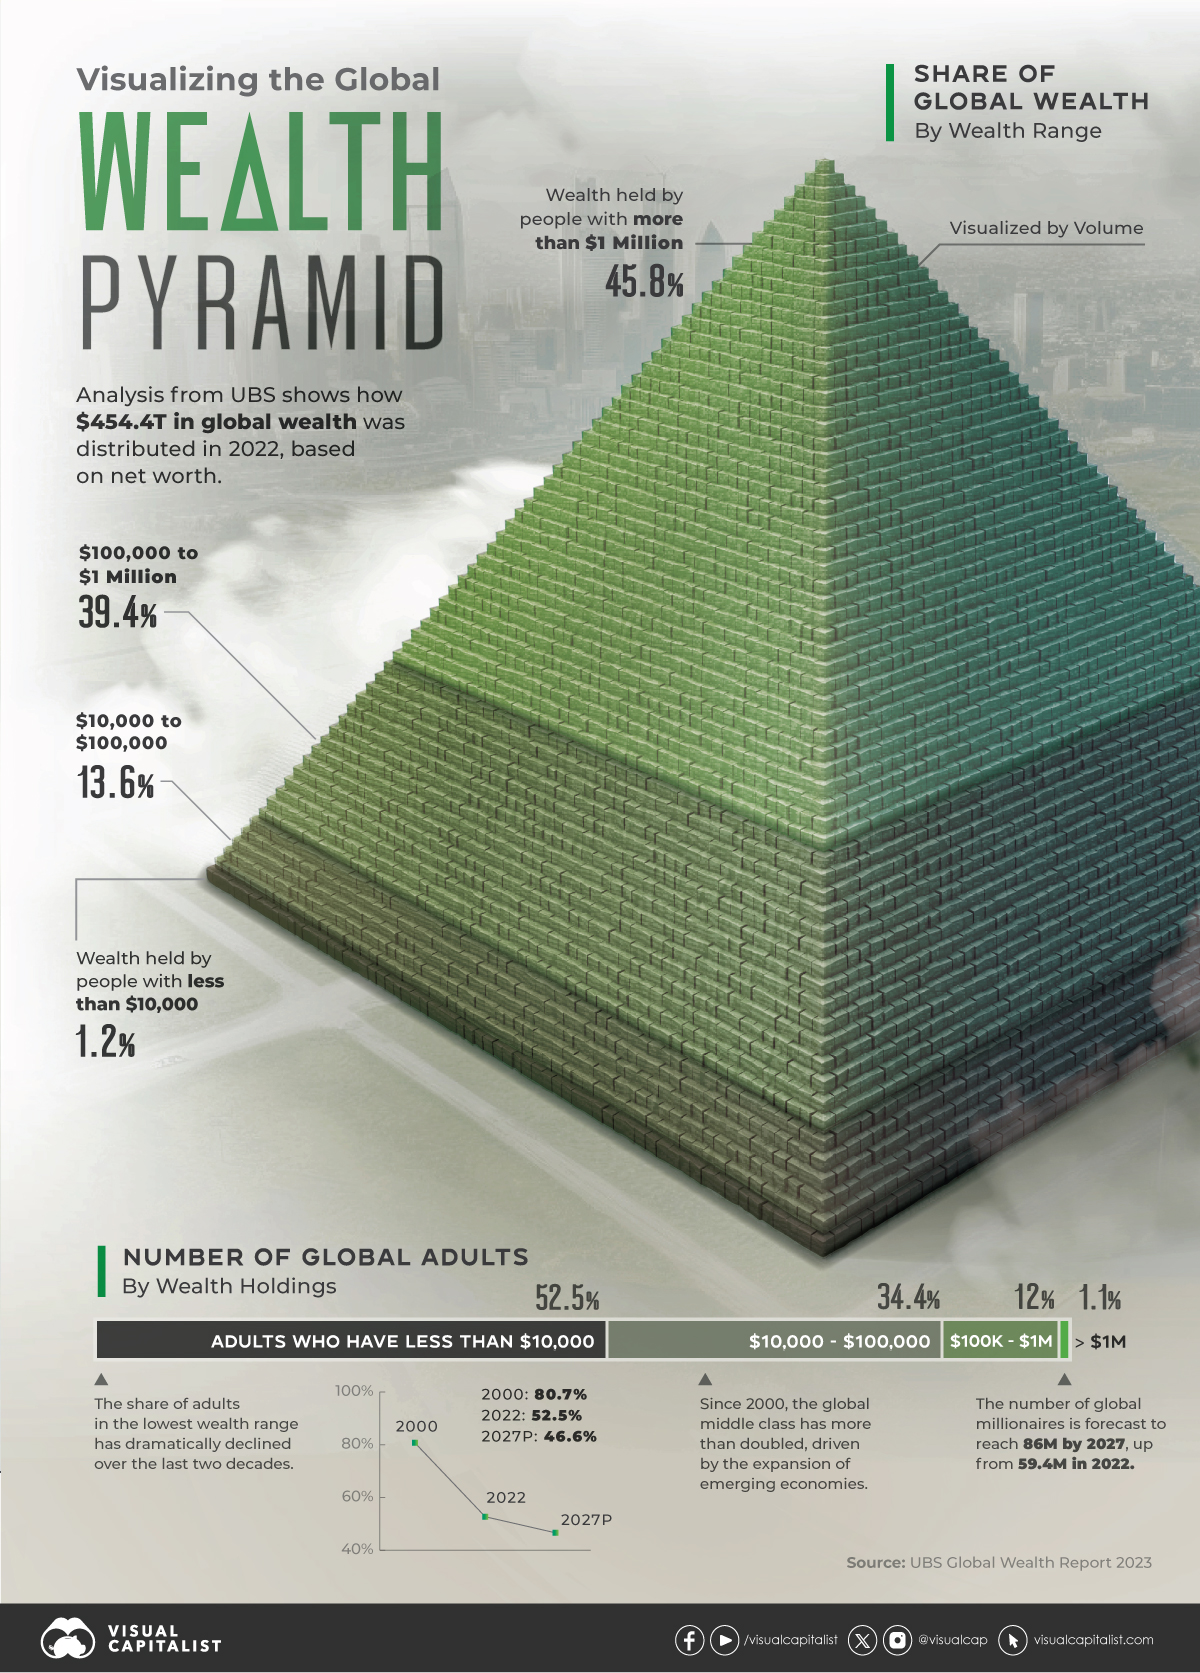
Worldwide net private wealth stood at $454.4 trillion in 2022.
Here’s how it was distributed across various levels of net worth, which takes a person’s financial and real assets such as housing, and subtracts their debt:
| Net Worth | Number of Adults | Share of Adults | Total Wealth | Share of Global Wealth |
|---|---|---|---|---|
| More than $1 million | 59.4M | 1.1% | $208.3T | 45.8% |
| $100,000 to $1 million | 642.0M | 12.0% | $178.9T | 39.4% |
| $10,000 to $100,000 | 1.8B | 34.4% | $61.9T | 13.6% |
| Less than $10,000 | 2.8B | 52.5% | $5.3T | 1.2% |
The highest wealth rung controls $208.3 trillion in wealth, or 45.8% of the global total. Just 1.1% of the world adult population fall in this bracket.
Those with $100,000 to $1 million have the next greatest share, at 39.4% of net household wealth.
We can see that wealth ownership begins to decline dramatically in the next bracket. People with $10,000 to $100,000 control just 13.6% of global wealth. However, the number of people in the global middle class have more than doubled over the last two decades, driven by the rapid expansion of China.
Interestingly, the lowest segment of wealth has shrunk considerably since 2000. Between 2000 and 2022, it fell from 80.7% to 52.5% of the global population, and is projected to keep decreasing. Despite this, the total share of wealth controlled by this rung is just 1.2% of the global total.
Future Outlook
By 2027, global wealth is estimated to reach $629 trillion. Here’s the forecast for how wealth distribution is set to evolve:
| Net Worth | Percent of Global Adults 2000 | Percent of Global Adults 2022 | Percent of Global Adults 2027P |
|---|---|---|---|
| More than $1 million | 0.4% | 1.1% | 1.5% |
| $100,000 to $1 million | 5.5% | 12.0% | 14.8% |
| $10,000 to $100,000 | 13.4% | 34.4% | 37.0% |
| Less than $10,000 | 80.7% | 52.5% | 46.6% |
Over this time period, the global millionaire population is set to reach 86 million. Below, we show how this is projected to change in select markets:
| Country / Region | Number of Millionaires 2022 | Number of Millionaires 2027P | Change 2022-2027P |
|---|---|---|---|
| 🇺🇸 U.S. | 22.7M | 26.4M | 16% |
| 🇨🇳 China | 6.2M | 13.2M | 112% |
| 🇫🇷 France | 2.8M | 4.0M | 43% |
| 🇯🇵 Japan | 2.8M | 3.9M | 40% |
| 🇩🇪 Germany | 2.6M | 3.4M | 30% |
| 🇬🇧 UK | 2.6M | 4.8M | 86% |
| 🇨🇦 Canada | 2.0M | 3.3M | 63% |
| 🇦🇺 Australia | 1.8M | 2.8M | 53% |
| 🇮🇹 Italy | 1.3M | 1.7M | 25% |
| 🇰🇷 South Korea | 1.3M | 2.1M | 64% |
| 🇳🇱 Netherlands | 1.2M | 1.4M | 17% |
| 🇪🇸 Spain | 1.1M | 1.4M | 25% |
| 🇨🇭 Switzerland | 1.1M | 1.5M | 39% |
| 🇮🇳 India | 849,000 | 1.4M | 69% |
| 🇹🇼 Taiwan | 765,000 | 1.3M | 70% |
| 🇭🇰 Hong Kong SAR | 630,000 | 1.1M | 73% |
| 🇧🇪 Belgium | 536,000 | 746,000 | 39% |
| 🇸🇪 Sweden | 467,000 | 670,000 | 44% |
| 🇧🇷 Brazil | 413,000 | 788,000 | 91% |
| 🇷🇺 Russia | 408,000 | 569,000 | 40% |
As the above table shows, double-digit growth in the millionaire population is projected for many markets, with China, Brazil, and the UK forecast to see the fastest growth by 2027.
Overall, total global wealth is forecast to increase 6.7% annually on average by 2027 factoring in current global inflation forecasts and GDP projections.


Money
Charted: Which City Has the Most Billionaires in 2024?
Just two countries account for half of the top 20 cities with the most billionaires. And the majority of the other half are found in Asia.


Charted: Which Country Has the Most Billionaires in 2024?
This was originally posted on our Voronoi app. Download the app for free on iOS or Android and discover incredible data-driven charts from a variety of trusted sources.
Some cities seem to attract the rich. Take New York City for example, which has 340,000 high-net-worth residents with investable assets of more than $1 million.
But there’s a vast difference between being a millionaire and a billionaire. So where do the richest of them all live?
Using data from the Hurun Global Rich List 2024, we rank the top 20 cities with the highest number of billionaires in 2024.
A caveat to these rich lists: sources often vary on figures and exact rankings. For example, in last year’s reports, Forbes had New York as the city with the most billionaires, while the Hurun Global Rich List placed Beijing at the top spot.
Ranked: Top 20 Cities with the Most Billionaires in 2024
The Chinese economy’s doldrums over the course of the past year have affected its ultra-wealthy residents in key cities.
Beijing, the city with the most billionaires in 2023, has not only ceded its spot to New York, but has dropped to #4, overtaken by London and Mumbai.
| Rank | City | Billionaires | Rank Change YoY |
|---|---|---|---|
| 1 | 🇺🇸 New York | 119 | +1 |
| 2 | 🇬🇧 London | 97 | +3 |
| 3 | 🇮🇳 Mumbai | 92 | +4 |
| 4 | 🇨🇳 Beijing | 91 | -3 |
| 5 | 🇨🇳 Shanghai | 87 | -2 |
| 6 | 🇨🇳 Shenzhen | 84 | -2 |
| 7 | 🇭🇰 Hong Kong | 65 | -1 |
| 8 | 🇷🇺 Moscow | 59 | No Change |
| 9 | 🇮🇳 New Delhi | 57 | +6 |
| 10 | 🇺🇸 San Francisco | 52 | No Change |
| 11 | 🇹🇭 Bangkok | 49 | +2 |
| 12 | 🇹🇼 Taipei | 45 | +2 |
| 13 | 🇫🇷 Paris | 44 | -2 |
| 14 | 🇨🇳 Hangzhou | 43 | -5 |
| 15 | 🇸🇬 Singapore | 42 | New to Top 20 |
| 16 | 🇨🇳 Guangzhou | 39 | -4 |
| 17T | 🇮🇩 Jakarta | 37 | +1 |
| 17T | 🇧🇷 Sao Paulo | 37 | No Change |
| 19T | 🇺🇸 Los Angeles | 31 | No Change |
| 19T | 🇰🇷 Seoul | 31 | -3 |
In fact all Chinese cities on the top 20 list have lost billionaires between 2023–24. Consequently, they’ve all lost ranking spots as well, with Hangzhou seeing the biggest slide (-5) in the top 20.
Where China lost, all other Asian cities—except Seoul—in the top 20 have gained ranks. Indian cities lead the way, with New Delhi (+6) and Mumbai (+3) having climbed the most.
At a country level, China and the U.S combine to make up half of the cities in the top 20. They are also home to about half of the world’s 3,200 billionaire population.
In other news of note: Hurun officially counts Taylor Swift as a billionaire, estimating her net worth at $1.2 billion.

-

 Debt1 week ago
How Debt-to-GDP Ratios Have Changed Since 2000
-

 Countries2 weeks ago
Population Projections: The World’s 6 Largest Countries in 2075
-

 Markets2 weeks ago
The Top 10 States by Real GDP Growth in 2023
-

 Demographics2 weeks ago
The Smallest Gender Wage Gaps in OECD Countries
-

 United States2 weeks ago
Where U.S. Inflation Hit the Hardest in March 2024
-

 Green2 weeks ago
Top Countries By Forest Growth Since 2001
-

 United States2 weeks ago
Ranked: The Largest U.S. Corporations by Number of Employees
-

 Maps2 weeks ago
The Largest Earthquakes in the New York Area (1970-2024)