Money
Visualizing the Investments of the Ultra-Wealthy
Visualizing Investments of the Ultra-Wealthy
How do the world’s richest people invest their money?
This graphic shows how ultra high net worth individuals (UHNWIs)—people with a net worth of $30 million or more including their primary residence—allocate their wealth based on data from Knight Frank’s 2023 Wealth Report.
How the Ultra-Wealthy Invest
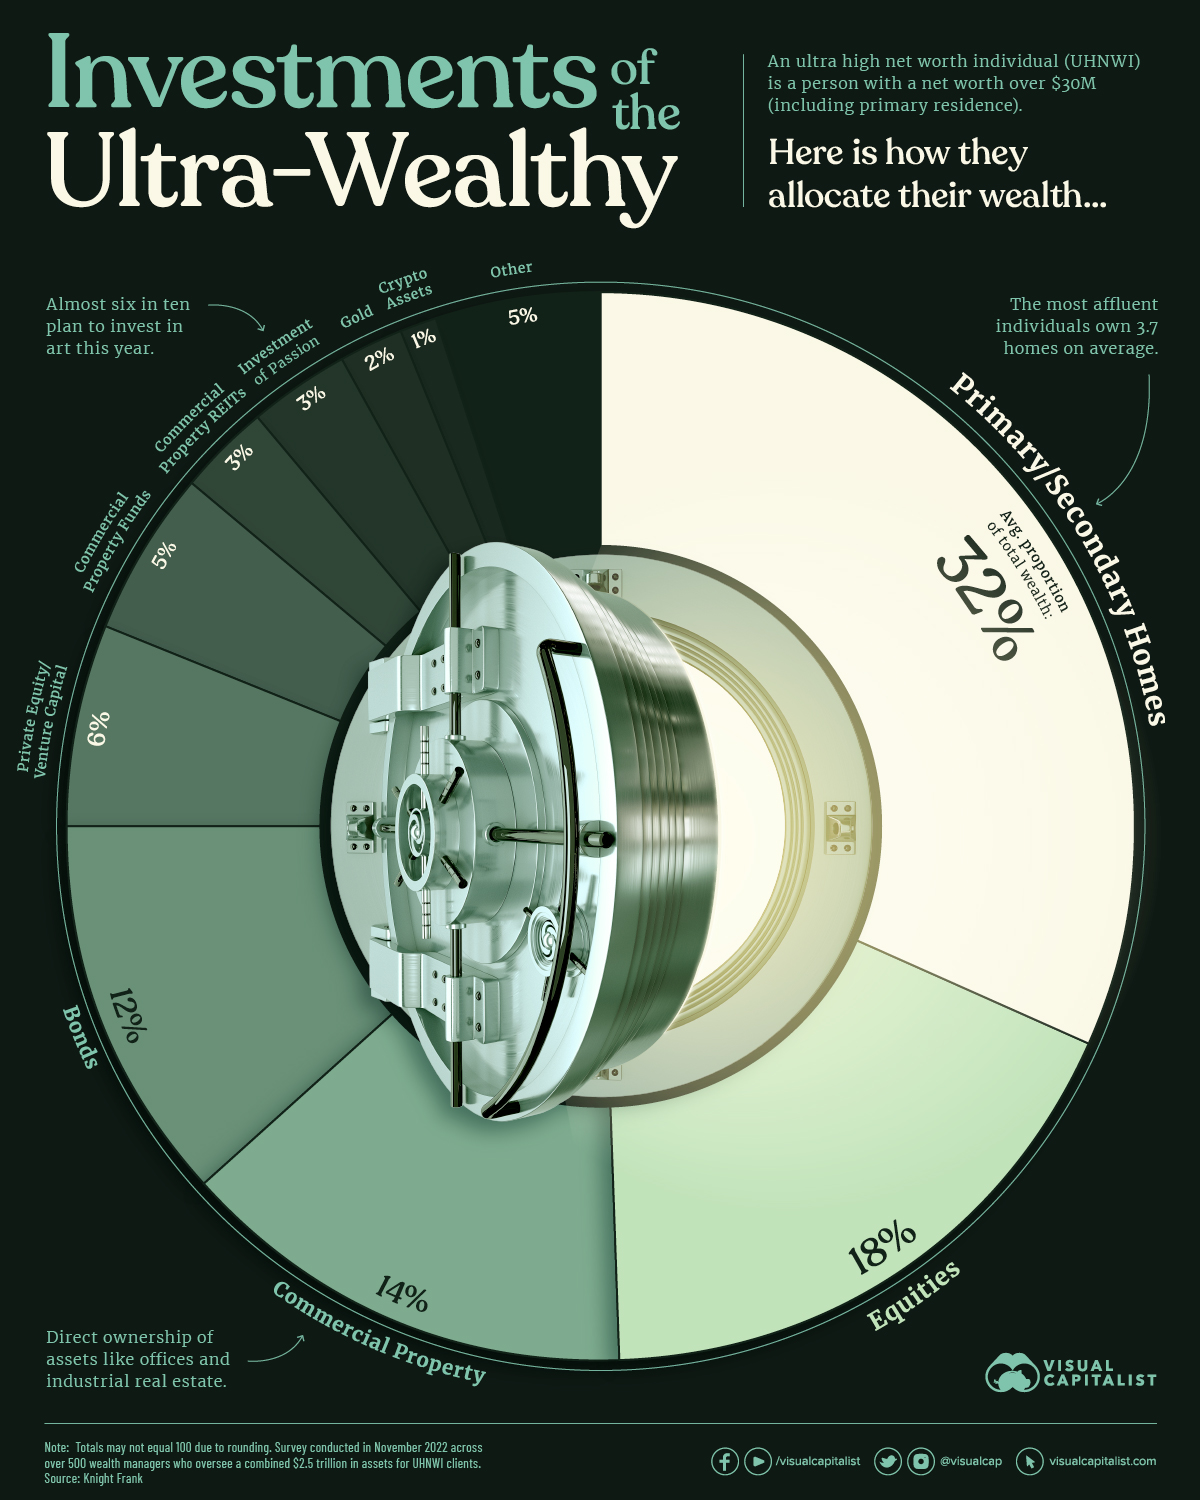
Below, we show where UHNWIs invest their fortunes, based on a global survey of over 500 wealth managers, family offices, and private bankers that oversee a combined $2.5 trillion in assets:
| Rank | Asset | Average Proportion of Total Wealth |
|---|---|---|
| 1 | Primary and Secondary Homes | 32% |
| 2 | Equities | 18% |
| 3 | Commercial Property | 14% |
| 4 | Bonds | 12% |
| 5 | Private Equity / Venture Capital | 6% |
| 6 | Commercial Property Funds | 5% |
| 7 | Commercial Property REITs | 3% |
| 8 | Investment of Passion (e.g. art, cars, wine) | 3% |
| 9 | Gold | 2% |
| 10 | Crypto Assets | 1% |
| 11 | Other | 5% |
Numbers may not total 100 due to rounding.
As the table above shows, primary and secondary homes make up 32% of total wealth, the largest share across assets. The average UHNWI owns 3.7 homes.
Investments in stocks comprised almost 20% of UHNWI wealth, with those in the Americas having the highest share of wealth in equities (33%) followed by Europe (28%) and Asia (26%).
Private equity and venture capital investments, which include investments in startup companies that have not yet gone public, accounted for 6% of total wealth on average. A separate report shows that the average investment in a private equity company ranges between $1.8 million and $6.9 million for UHNWI investors.
Luxury Investments of the Ultra-Rich
Investments of passion, which include a range of luxury items from art to classic cars, make up an average 3% of the total wealth of the ultra-rich.
In 2023, nearly six in 10 UHNWIs said they plan to purchase art.
| Likely to Purchase in 2023 | Global Average |
|---|---|
| Art | 59% |
| Watches | 46% |
| Wine | 39% |
| Classic Cars | 34% |
| Jewelry | 33% |
| Luxury Handbags | 20% |
| Rare Whiskey Bottles | 18% |
| Furniture | 14% |
| Colored Diamonds | 9% |
| Coins | 8% |
Many of these items retain their value over time. In fact, all 10 of these items increased in value over 2022 despite a challenging economic environment which saw the S&P 500 fall over 19%.
The art market saw prices increase 29% last year, the highest across luxury items. Luxury cars (25%) and watches (18%) also saw some of the highest price increases.
The Growth of the Uber-Affluent
In 2022, there were roughly 579,000 people globally with wealth that exceeded $30 million. New York, Tokyo, and San Francisco are home to the most ultra-rich individuals worldwide. Over the next five years, this number is projected to reach 744,000—a 29% increase.
As these numbers continue to climb, demand for luxury real estate, equity investments, and luxury items will likely grow given the investment patterns of the ultra-wealthy illustrated today.


Money
Charted: Which City Has the Most Billionaires in 2024?
Just two countries account for half of the top 20 cities with the most billionaires. And the majority of the other half are found in Asia.


Charted: Which Country Has the Most Billionaires in 2024?
This was originally posted on our Voronoi app. Download the app for free on iOS or Android and discover incredible data-driven charts from a variety of trusted sources.
Some cities seem to attract the rich. Take New York City for example, which has 340,000 high-net-worth residents with investable assets of more than $1 million.
But there’s a vast difference between being a millionaire and a billionaire. So where do the richest of them all live?
Using data from the Hurun Global Rich List 2024, we rank the top 20 cities with the highest number of billionaires in 2024.
A caveat to these rich lists: sources often vary on figures and exact rankings. For example, in last year’s reports, Forbes had New York as the city with the most billionaires, while the Hurun Global Rich List placed Beijing at the top spot.
Ranked: Top 20 Cities with the Most Billionaires in 2024
The Chinese economy’s doldrums over the course of the past year have affected its ultra-wealthy residents in key cities.
Beijing, the city with the most billionaires in 2023, has not only ceded its spot to New York, but has dropped to #4, overtaken by London and Mumbai.
| Rank | City | Billionaires | Rank Change YoY |
|---|---|---|---|
| 1 | 🇺🇸 New York | 119 | +1 |
| 2 | 🇬🇧 London | 97 | +3 |
| 3 | 🇮🇳 Mumbai | 92 | +4 |
| 4 | 🇨🇳 Beijing | 91 | -3 |
| 5 | 🇨🇳 Shanghai | 87 | -2 |
| 6 | 🇨🇳 Shenzhen | 84 | -2 |
| 7 | 🇭🇰 Hong Kong | 65 | -1 |
| 8 | 🇷🇺 Moscow | 59 | No Change |
| 9 | 🇮🇳 New Delhi | 57 | +6 |
| 10 | 🇺🇸 San Francisco | 52 | No Change |
| 11 | 🇹🇭 Bangkok | 49 | +2 |
| 12 | 🇹🇼 Taipei | 45 | +2 |
| 13 | 🇫🇷 Paris | 44 | -2 |
| 14 | 🇨🇳 Hangzhou | 43 | -5 |
| 15 | 🇸🇬 Singapore | 42 | New to Top 20 |
| 16 | 🇨🇳 Guangzhou | 39 | -4 |
| 17T | 🇮🇩 Jakarta | 37 | +1 |
| 17T | 🇧🇷 Sao Paulo | 37 | No Change |
| 19T | 🇺🇸 Los Angeles | 31 | No Change |
| 19T | 🇰🇷 Seoul | 31 | -3 |
In fact all Chinese cities on the top 20 list have lost billionaires between 2023–24. Consequently, they’ve all lost ranking spots as well, with Hangzhou seeing the biggest slide (-5) in the top 20.
Where China lost, all other Asian cities—except Seoul—in the top 20 have gained ranks. Indian cities lead the way, with New Delhi (+6) and Mumbai (+3) having climbed the most.
At a country level, China and the U.S combine to make up half of the cities in the top 20. They are also home to about half of the world’s 3,200 billionaire population.
In other news of note: Hurun officially counts Taylor Swift as a billionaire, estimating her net worth at $1.2 billion.

-

 Education1 week ago
How Hard Is It to Get Into an Ivy League School?
-

 Technology2 weeks ago
Ranked: Semiconductor Companies by Industry Revenue Share
-

 Markets2 weeks ago
Ranked: The World’s Top Flight Routes, by Revenue
-

 Demographics2 weeks ago
Population Projections: The World’s 6 Largest Countries in 2075
-

 Markets2 weeks ago
The Top 10 States by Real GDP Growth in 2023
-

 Demographics2 weeks ago
The Smallest Gender Wage Gaps in OECD Countries
-

 Economy2 weeks ago
Where U.S. Inflation Hit the Hardest in March 2024
-

 Environment2 weeks ago
Top Countries By Forest Growth Since 2001