Technology
Visualizing the Rise of Digital Payment Adoption
Digital Payments: The Evolution of Currency
Over the last decade, the digital payments landscape has undergone a structural shift.
Consumer behaviors are changing—moving towards contactless and cashless transactions. Meanwhile, as the magnitude of COVID-19 grows, these trends have only accelerated.
Today’s infographic navigates the digital payments ecosystem, exploring its history and innovative technologies, and how it continues to grow as a solution of choice for trillions of dollars of transactions each year.
Digital Payments Timeline
The origins of digital payments began over 25 years ago with then 21 year-old entrepreneur Dan Kohn in Nashua, New Hampshire, who sold a CD over the internet via credit card payment.
- 1994: First online purchase is made
A CD of Sting’s Ten Summoner’s Tales is sold for $12.48 on NetMarket. - 1997: First mobile payments and first contactless payments
Coca-Cola installs two vending machines in Helsinki that accept payment by text message. - 1999: Paypal launches electronic money transfer service
Early on, PayPal’s user base grew nearly 10% daily. Tesla CEO Elon Musk and venture capitalist Peter Thiel were among its co-founders. - 2003: Alibaba launches Alipay in China
Today, the mobile payment platform has witnessed stunning growth — leveraging digital wallets accepted by merchants in over 50 countries and regions. - 2007: M-PESA creates the first payments system for mobile phones
Kenya-based M-PESA launched its mobile banking and microfinancing service. Today, it has over 37 million active users on its platform across Africa. - 2009: Bitcoin enables secure, untraceable payments
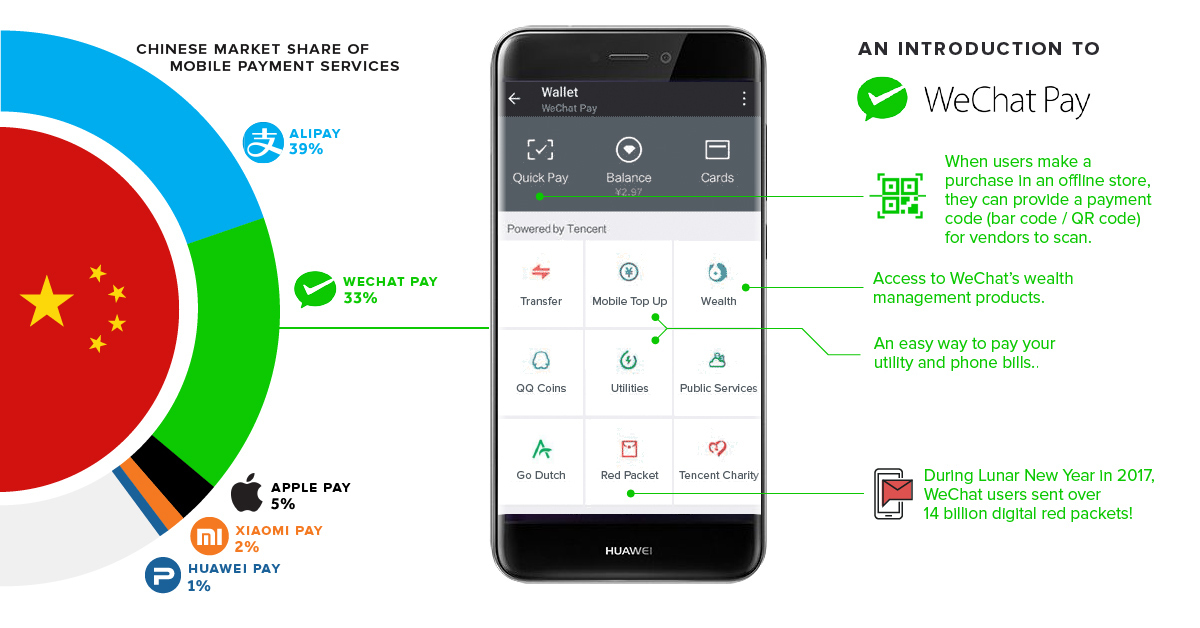
Satoshi Nakamoto develops the first decentralized payment network in the world. - 2013: WeChat Pay is rolled into the popular messaging platform
By 2018, it surpasses 800 million monthly active users. - 2014: Apple Pay launches
By 2023, over $2 trillion of mobile payment transactions could be authenticated by biometric technology.
As technological advances continue to unfold, advances in digital payment technologies are creating ripple effects globally.
Geographical Differences in Adoption
Unsurprisingly, the sheer volume of digital payments has continued to grow at a double-digit pace, now surpassing the $4.1 trillion mark.
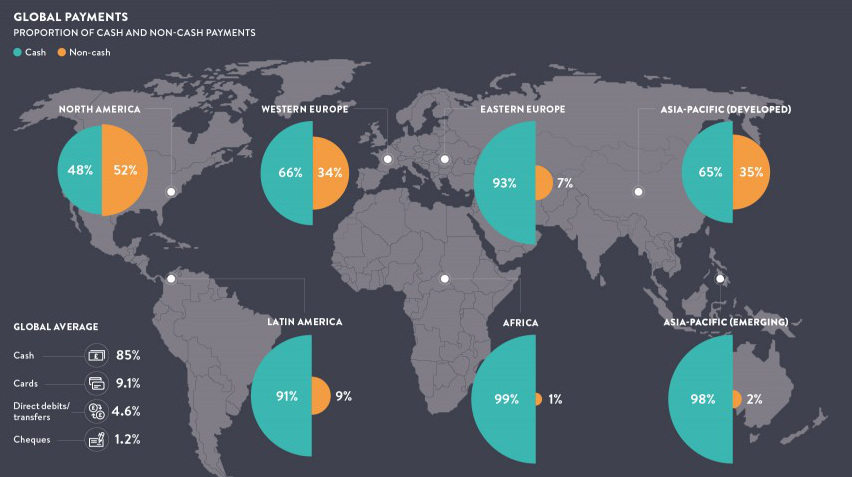
How do cashless payments break down across different countries?
| Country | Daily Average Volume of Cashless Payments | Average Annual Cashless Payments Per Person |
|---|---|---|
| Singapore | 13M | 831 |
| South Korea | 77M | 547 |
| Sweden | 15M | 529 |
| Netherlands | 24M | 505 |
| U.S. | 444M | 495 |
| UK | 82M | 448 |
| Canada | 40M | 393 |
| Belgium | 12M | 372 |
| France | 64M | 363 |
| Switzerland | 7M | 299 |
| Germany | 61M | 269 |
| Russia | 95M | 237 |
| Spain | 24M | 185 |
| Brazil | 95M | 166 |
| China | 543M | 142 |
| Italy | 18M | 111 |
| Turkey | 17M | 77 |
| Indonesia | 30M | 42 |
| Mexico | 14M | 40 |
| India | 67M | 18 |
Source: BIS
Singapore has the highest number of cashless payments per individual, averaging 831 cashless payments annually. The country’s robust e-commerce market is supported by high-speed, reliable internet and a young, tech-savvy population.
With e-commerce spending accounting for about 6% of South Korea’s national GDP, it is another leading purveyor of a cashless society. Meanwhile, Sweden is projected to become a cashless nation as early as 2023.
Pivotal factors—including core infrastructure, consumer behavior and rising revenues—provide a glimpse into the rapidly changing payment horizon.
The Future of Digital Payments
As transactions rise, a number of other technological innovations could be instrumental to shaping the evolution of the digital payments industry:
- Messaging-app payments
Facebook Messenger, WhatsApp, and WeChat can leverage the reach of billions of users. - Voice-activated commands
Paying for gas, groceries, or retail via voice could soar. - Peer-to-peer (P2P) payments
Bank of America and Visa are investing heavily into P2P partnerships. - Cryptocurrencies
Over one million transactions take place daily on average. - Biometric payments
Smartphone biometric security features could spur traction across digital payments. - Facial recognition
May soon replace QR codes across retail, transit, and airports in China. - Crypto wallet adoption
Blockchain wallet users are predicted to soar to 200 million by 2030. - Hardware & in-store interfaces
Square, Stripe, and Clover are driving new mobile processing integrations.
The $4.1T digital payments ecosystem is facing a notable transition, catalyzed by a wave of global advancements and disruption. As the industry continues to widen its reach, consumers and investors alike can benefit from the shift towards a cashless economy.


Technology
All of the Grants Given by the U.S. CHIPS Act
Intel, TSMC, and more have received billions in subsidies from the U.S. CHIPS Act in 2024.


All of the Grants Given by the U.S. CHIPS Act
This was originally posted on our Voronoi app. Download the app for free on iOS or Android and discover incredible data-driven charts from a variety of trusted sources.
This visualization shows which companies are receiving grants from the U.S. CHIPS Act, as of April 25, 2024. The CHIPS Act is a federal statute signed into law by President Joe Biden that authorizes $280 billion in new funding to boost domestic research and manufacturing of semiconductors.
The grant amounts visualized in this graphic are intended to accelerate the production of semiconductor fabrication plants (fabs) across the United States.
Data and Company Highlights
The figures we used to create this graphic were collected from a variety of public news sources. The Semiconductor Industry Association (SIA) also maintains a tracker for CHIPS Act recipients, though at the time of writing it does not have the latest details for Micron.
| Company | Federal Grant Amount | Anticipated Investment From Company |
|---|---|---|
| 🇺🇸 Intel | $8,500,000,000 | $100,000,000,000 |
| 🇹🇼 TSMC | $6,600,000,000 | $65,000,000,000 |
| 🇰🇷 Samsung | $6,400,000,000 | $45,000,000,000 |
| 🇺🇸 Micron | $6,100,000,000 | $50,000,000,000 |
| 🇺🇸 GlobalFoundries | $1,500,000,000 | $12,000,000,000 |
| 🇺🇸 Microchip | $162,000,000 | N/A |
| 🇬🇧 BAE Systems | $35,000,000 | N/A |
BAE Systems was not included in the graphic due to size limitations
Intel’s Massive Plans
Intel is receiving the largest share of the pie, with $8.5 billion in grants (plus an additional $11 billion in government loans). This grant accounts for 22% of the CHIPS Act’s total subsidies for chip production.
From Intel’s side, the company is expected to invest $100 billion to construct new fabs in Arizona and Ohio, while modernizing and/or expanding existing fabs in Oregon and New Mexico. Intel could also claim another $25 billion in credits through the U.S. Treasury Department’s Investment Tax Credit.
TSMC Expands its U.S. Presence
TSMC, the world’s largest semiconductor foundry company, is receiving a hefty $6.6 billion to construct a new chip plant with three fabs in Arizona. The Taiwanese chipmaker is expected to invest $65 billion into the project.
The plant’s first fab will be up and running in the first half of 2025, leveraging 4 nm (nanometer) technology. According to TrendForce, the other fabs will produce chips on more advanced 3 nm and 2 nm processes.
The Latest Grant Goes to Micron
Micron, the only U.S.-based manufacturer of memory chips, is set to receive $6.1 billion in grants to support its plans of investing $50 billion through 2030. This investment will be used to construct new fabs in Idaho and New York.

-

 Debt1 week ago
How Debt-to-GDP Ratios Have Changed Since 2000
-

 Markets2 weeks ago
Ranked: The World’s Top Flight Routes, by Revenue
-

 Countries2 weeks ago
Population Projections: The World’s 6 Largest Countries in 2075
-

 Markets2 weeks ago
The Top 10 States by Real GDP Growth in 2023
-

 Demographics2 weeks ago
The Smallest Gender Wage Gaps in OECD Countries
-

 United States2 weeks ago
Where U.S. Inflation Hit the Hardest in March 2024
-

 Green2 weeks ago
Top Countries By Forest Growth Since 2001
-

 United States2 weeks ago
Ranked: The Largest U.S. Corporations by Number of Employees