Technology
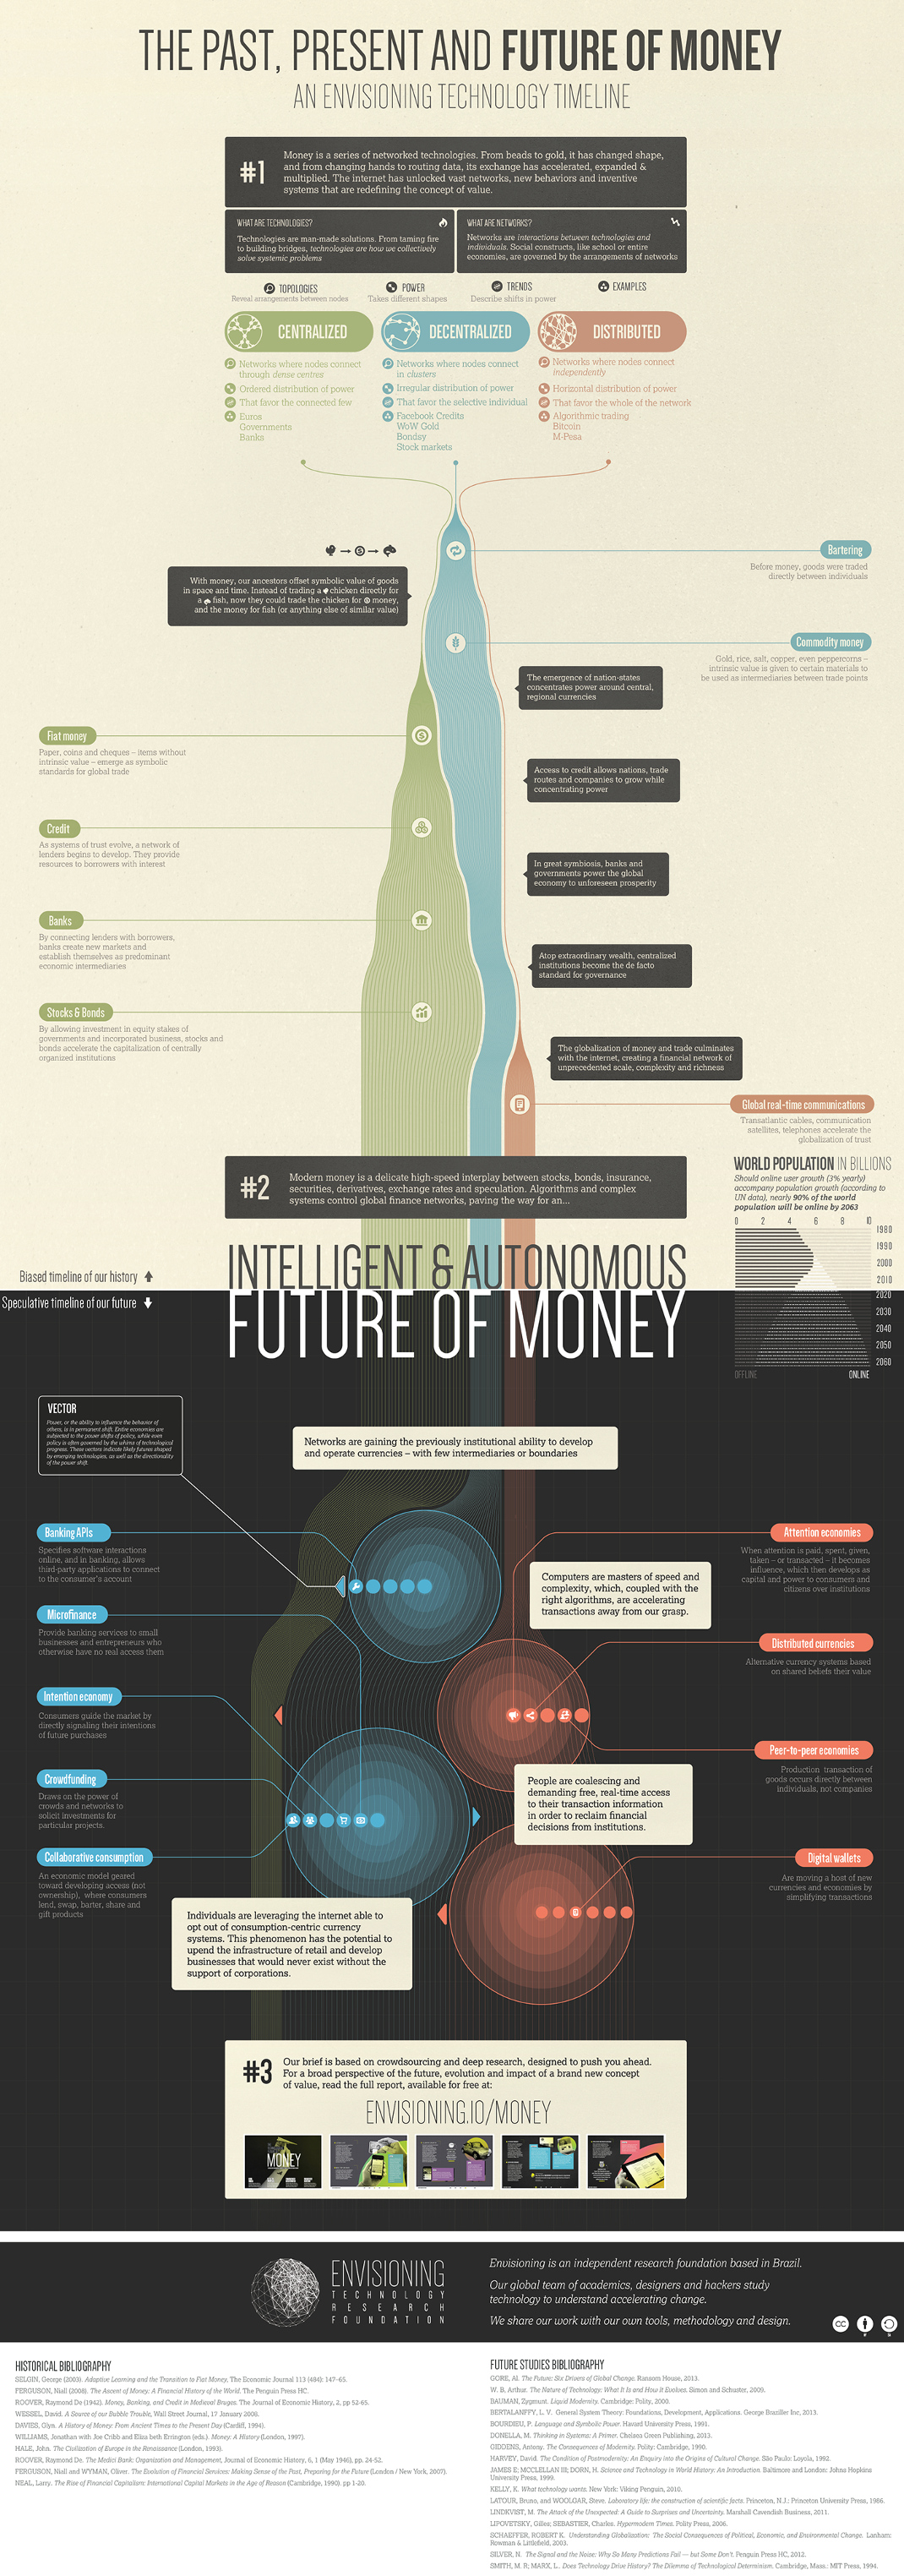
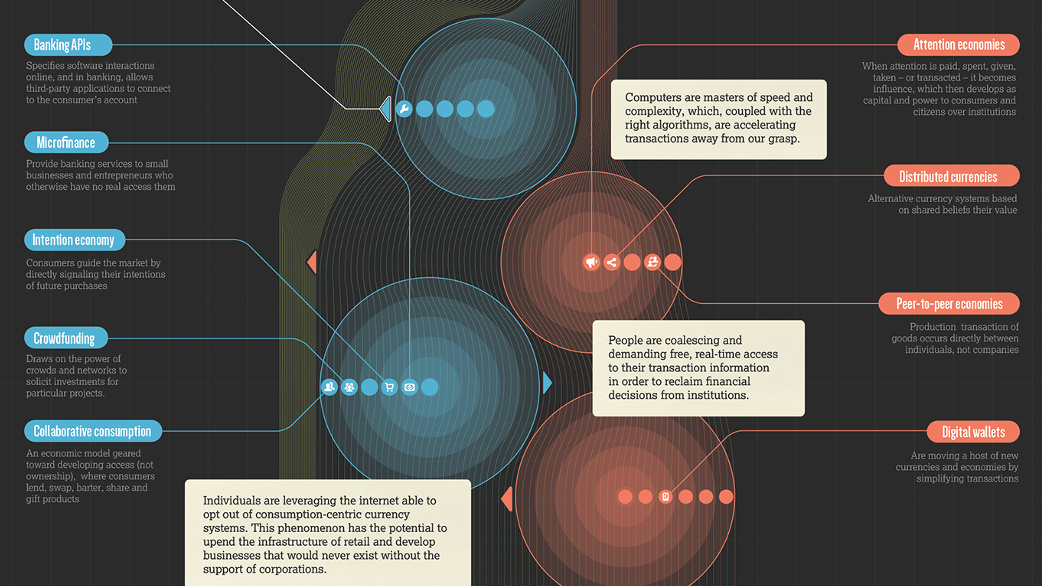
Timeline: The Future of Money
For a larger version of this infographic, click here.
Timeline: The Future of Money
For a larger version of this infographic, click here.
Predicting the future isn’t easy. For example, in 1977 it was predicted by Ken Olsen, a well-known tech entrepreneur at the time, that “There is no reason for any individual to have a computer in his home.”
It was not only an inaccurate prediction, but decades later the exact opposite has happened. Billions of computers now fit in our homes and our pockets. Even refrigerators, thermostats, and alarm clocks are armed with computers that connect to us as the Internet of Things grows exponentially.
As a result, we should take any forward-looking guesses with an open mind and a light heart.
In this visualization, Envisioning.io looks at the historical relationship between currencies and technology. The graphic also looks forward to the future of trade, where new applications of technology may change and expand the ways our financial system works.
Importantly, the visualization also makes the distinction between the different types of networks that encompass currency and trade. Centralized networks are where nodes connect through dense centres that support the connected few, such as governments and banks. Decentralized networks are where nodes connect in clusters under no centralized authority. These networks favour the selective individual and give rise to things such as stock markets. Lastly, there is the distinction of distributed networks, where network nodes connect independently. This is what has enabled bitcoin and cryptocurrencies, where the whole of the network is reinforced and supported.
There are several topics covered here that we have looked at in the past in much more depth. Most recently, we showed the opportunity in mobile and electronic payments, the evolution of US currency, and also how cryptocurrencies could disrupt the financial system. We’ve also covered precious metals in depth with our gold and silver series.
Original graphic by: Envisioning


Technology
All of the Grants Given by the U.S. CHIPS Act
Intel, TSMC, and more have received billions in subsidies from the U.S. CHIPS Act in 2024.


All of the Grants Given by the U.S. CHIPS Act
This was originally posted on our Voronoi app. Download the app for free on iOS or Android and discover incredible data-driven charts from a variety of trusted sources.
This visualization shows which companies are receiving grants from the U.S. CHIPS Act, as of April 25, 2024. The CHIPS Act is a federal statute signed into law by President Joe Biden that authorizes $280 billion in new funding to boost domestic research and manufacturing of semiconductors.
The grant amounts visualized in this graphic are intended to accelerate the production of semiconductor fabrication plants (fabs) across the United States.
Data and Company Highlights
The figures we used to create this graphic were collected from a variety of public news sources. The Semiconductor Industry Association (SIA) also maintains a tracker for CHIPS Act recipients, though at the time of writing it does not have the latest details for Micron.
| Company | Federal Grant Amount | Anticipated Investment From Company |
|---|---|---|
| 🇺🇸 Intel | $8,500,000,000 | $100,000,000,000 |
| 🇹🇼 TSMC | $6,600,000,000 | $65,000,000,000 |
| 🇰🇷 Samsung | $6,400,000,000 | $45,000,000,000 |
| 🇺🇸 Micron | $6,100,000,000 | $50,000,000,000 |
| 🇺🇸 GlobalFoundries | $1,500,000,000 | $12,000,000,000 |
| 🇺🇸 Microchip | $162,000,000 | N/A |
| 🇬🇧 BAE Systems | $35,000,000 | N/A |
BAE Systems was not included in the graphic due to size limitations
Intel’s Massive Plans
Intel is receiving the largest share of the pie, with $8.5 billion in grants (plus an additional $11 billion in government loans). This grant accounts for 22% of the CHIPS Act’s total subsidies for chip production.
From Intel’s side, the company is expected to invest $100 billion to construct new fabs in Arizona and Ohio, while modernizing and/or expanding existing fabs in Oregon and New Mexico. Intel could also claim another $25 billion in credits through the U.S. Treasury Department’s Investment Tax Credit.
TSMC Expands its U.S. Presence
TSMC, the world’s largest semiconductor foundry company, is receiving a hefty $6.6 billion to construct a new chip plant with three fabs in Arizona. The Taiwanese chipmaker is expected to invest $65 billion into the project.
The plant’s first fab will be up and running in the first half of 2025, leveraging 4 nm (nanometer) technology. According to TrendForce, the other fabs will produce chips on more advanced 3 nm and 2 nm processes.
The Latest Grant Goes to Micron
Micron, the only U.S.-based manufacturer of memory chips, is set to receive $6.1 billion in grants to support its plans of investing $50 billion through 2030. This investment will be used to construct new fabs in Idaho and New York.

-

 Lithium6 days ago
Ranked: The Top 10 EV Battery Manufacturers in 2023
-

 Green2 weeks ago
Top Countries By Forest Growth Since 2001
-

 United States2 weeks ago
Ranked: The Largest U.S. Corporations by Number of Employees
-

 Maps2 weeks ago
The Largest Earthquakes in the New York Area (1970-2024)
-

 Green2 weeks ago
Ranked: The Countries With the Most Air Pollution in 2023
-

 Green2 weeks ago
Ranking the Top 15 Countries by Carbon Tax Revenue
-

 Markets2 weeks ago
U.S. Debt Interest Payments Reach $1 Trillion
-

 Mining2 weeks ago
Gold vs. S&P 500: Which Has Grown More Over Five Years?