Precious Metals
The Silver Series: The Many Phases of Silver (Part 1 of 4)


2015 Silver Series Part 1: The Many Phases of Silver
Since the early days of civilization, the ancients connected the brilliance of silver to the moon. Artemis, the Greek goddess of the moon, wore silver sandals and shot from a silver bow and arrow. This lunar comparison might be fitting because like the moon, silver also has many phases. The properties of silver make it the most dynamic of precious metals.
Evidence shows that silver was first separated from lead as far back in 3,000 BC. Many ancient civilizations used silver as money, including the Greeks, Romans, and Ottomans. This was because of silver’s natural properties which make it malleable, divisible, durable, consistent, and rare.
Throughout history, people have used silver to prevent and combat illness. We now know today that silver has unique and impressive antibacterial properties that help it break down the cell walls of harmful bacteria. Silver also is the most conductive metal, and one of the three most reflective metals (along with gold and aluminum, and depending on the wavelength of light). These properties help make silver one of the most important industrial metals, with uses from photography to solar cells.
Don’t miss another part of the Silver Series by connecting with Visual Capitalist.


Mining
Visualizing the New Era of Gold Mining
This infographic highlights the need for new gold mining projects and shows the next generation of America’s gold deposits.
Visualizing the New Era of Gold Mining
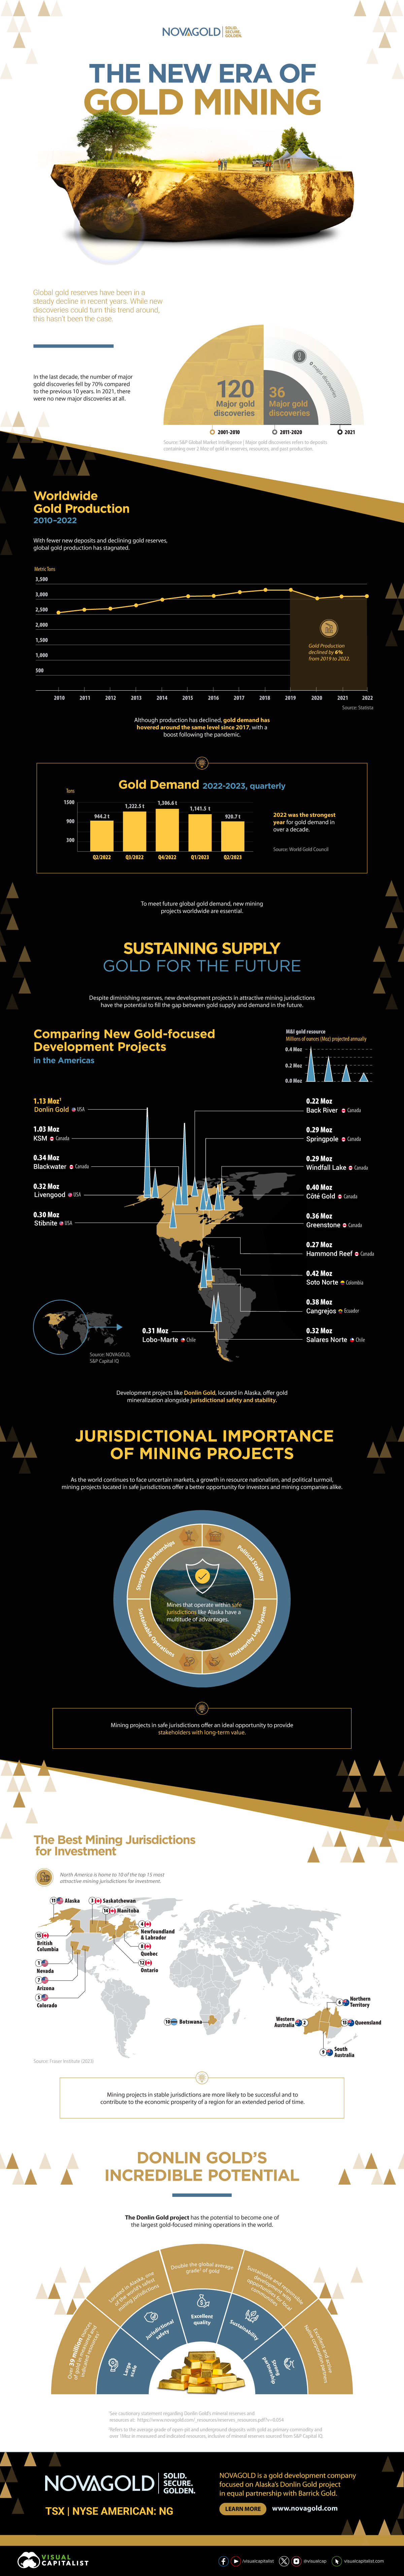
Between 2011 and 2020, the number of major gold discoveries fell by 70% relative to 2001-2010.
The lack of discoveries, alongside stagnating gold production, has cast a shadow of doubt on the future of gold supply.
This infographic sponsored by NOVAGOLD highlights the need for new gold mining projects with a focus on the company’s Donlin Gold project in Alaska.
The Current State of Gold Production
Between 2010 and 2019, gold production increased steadily, though this growth has stagnated over the past few years.
| Year | Gold Production, tonnes | YoY % Change |
|---|---|---|
| 2010 | 2,560 | - |
| 2011 | 2,660 | 3.9% |
| 2012 | 2,690 | 1.1% |
| 2013 | 2,800 | 4.1% |
| 2014 | 2,990 | 6.8% |
| 2015 | 3,100 | 3.7% |
| 2016 | 3,110 | 0.3% |
| 2017 | 3,230 | 3.9% |
| 2018 | 3,300 | 2.2% |
| 2019 | 3,300 | 0.0% |
| 2020 | 3,030 | -8.2% |
| 2021 | 3,090 | 2.0% |
| 2022 | 3,100 | 0.3% |
Along with a small decrease in gold production in 2020, there were no new major gold discoveries in 2021.
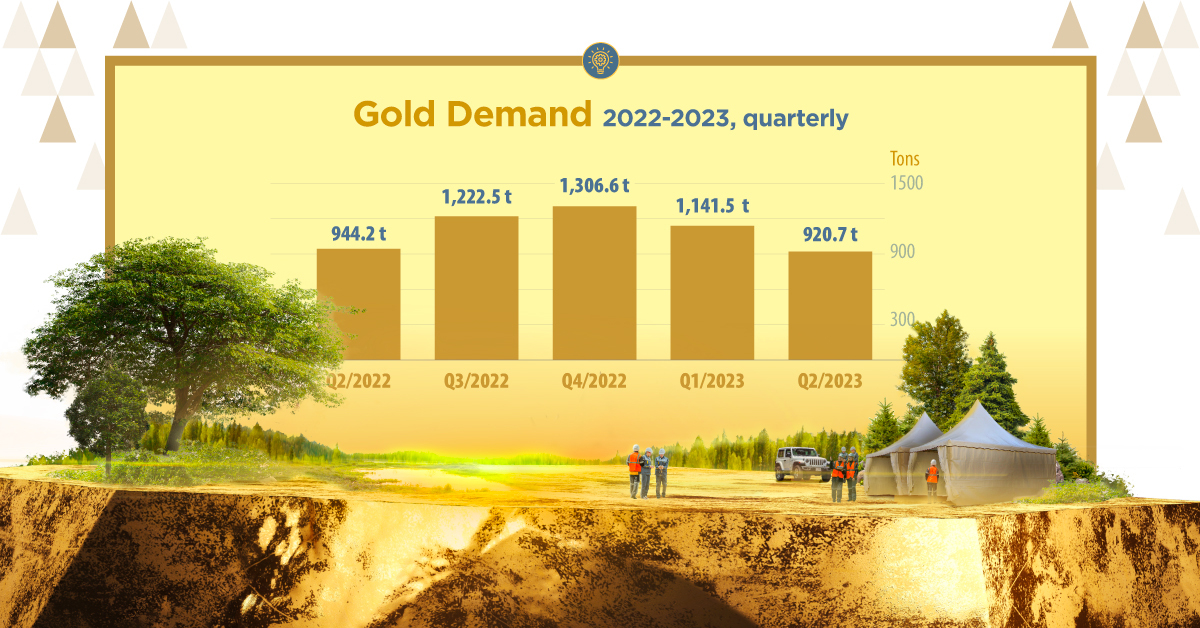
The fall in production and long-term lack of gold discoveries point towards a possible imbalance in gold supply and demand. This calls for the introduction of new gold development projects that can fill the supply-demand gap in the future.
Sustaining Supply: Gold for the Future
Jurisdictions play an important role when looking for projects that could sustain gold production well into the future.
From political stability to trustworthy legal systems, the characteristics of a jurisdiction can make or break mining projects. Amid ongoing market uncertainty, political turmoil, and resource nationalism, projects in safe jurisdictions offer a better investment opportunity for investors and mining companies.
Today, 10 of the top 15 mining jurisdictions for investment are located in North America, according to the Fraser Institute report published in 2023.
A Golden Opportunity
Located in Alaska, one of the world’s safest mining jurisdictions, NOVAGOLD’s 50% owned Donlin Gold project has the highest average grade of gold among major development projects in the Americas. For every tonne of ore, Donlin Gold offers 2.24 grams of gold, which is more than twice the global average grade of 1.04g/t.
Additionally, Donlin Gold is the second-largest gold-focused development project in the Americas, with over 39 million ounces of gold in M&I resources inclusive of reserves.
NOVAGOLD is focused on the Donlin Gold project in equal partnership with Barrick Gold.
Learn more about Donlin Gold .

-

 Lithium4 days ago
Ranked: The Top 10 EV Battery Manufacturers in 2023
Asia dominates this ranking of the world’s largest EV battery manufacturers in 2023.
-

 Mining1 week ago
Gold vs. S&P 500: Which Has Grown More Over Five Years?
The price of gold has set record highs in 2024, but how has this precious metal performed relative to the S&P 500?
-

 Mining3 weeks ago
Charted: The Value Gap Between the Gold Price and Gold Miners
While the price of gold has reached new record highs in 2024, gold mining stocks are still far from their 2011 peaks.
-

 Uranium2 months ago
Charted: Global Uranium Reserves, by Country
We visualize the distribution of the world’s uranium reserves by country, with 3 countries accounting for more than half of total reserves.
-

 Energy4 months ago
The Periodic Table of Commodity Returns (2014-2023)
Commodity returns in 2023 took a hit. This graphic shows the performance of commodities like gold, oil, nickel, and corn over the last decade.
-

 Mining4 months ago
China Dominates the Supply of U.S. Critical Minerals List
The U.S. Geological Survey estimates that in 2022, China was the world’s leading producer of 30 out of 50 entries on the U.S. critical minerals list.


-
Mining1 week ago
Gold vs. S&P 500: Which Has Grown More Over Five Years?
-

 Markets2 weeks ago
Ranked: The Most Valuable Housing Markets in America
-

 Money2 weeks ago
Which States Have the Highest Minimum Wage in America?
-

 AI2 weeks ago
Ranked: Semiconductor Companies by Industry Revenue Share
-

 Markets2 weeks ago
Ranked: The World’s Top Flight Routes, by Revenue
-

 Countries2 weeks ago
Population Projections: The World’s 6 Largest Countries in 2075
-

 Markets2 weeks ago
The Top 10 States by Real GDP Growth in 2023
-

 Demographics2 weeks ago
The Smallest Gender Wage Gaps in OECD Countries