Gold
Everything You Need to Know About the Swiss Gold Referendum

Everything You Need to Know About the Swiss Gold Referendum
Presented by: Gainesville Coins
On November 30, Swiss nationals head to the polls on three separate issues: abolishing a flat tax on resident, non-working foreigners, an immigration cap, and a proposal on Swiss gold reserves.
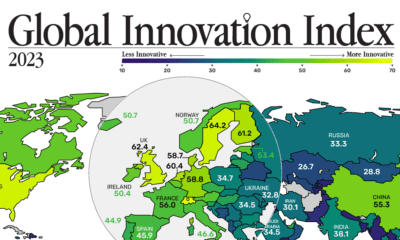
At Visual Capitalist, the one we are most interested in is the latter section of the ballot, and today’s infographic sums up everything you need to know about the upcoming Swiss gold referendum.
The referendum, if passed, will mean that (1) The Swiss National Bank must hold 20% of all assets as gold, (2) Switzerland will repatriate the 30% of their gold held abroad by England and Canada, and (3) Switzerland may no longer sell any gold they accumulate.
In the most recent polling, 38% of respondents supported the initiative, 47% were against, and 15% were undecided. The poll has a 3% margin of error as well. While support is down from the previous poll, anything is still possible on November 30th.
Switzerland currently holds 1,040 tonnes, or 7.7% of its reserves in gold. The country actually holds the highest amount of gold per capita (4.09 oz per citizen). However, it used to be an even bigger holder of the yellow metal. In 2000, the SNB held 2,500 tonnes of gold and it has also been the biggest national seller since.
The implications of the vote are huge. With a “yes”, the SNB would have to purchase at least 1,500 tonnes of gold to meet the 20% threshold for 2019. That’s about half the world’s annual production. It would also put Switzerland back in the top three for most gold holdings worldwide.


Mining
Gold vs. S&P 500: Which Has Grown More Over Five Years?
The price of gold has set record highs in 2024, but how has this precious metal performed relative to the S&P 500?

Gold vs. S&P 500: Which Has Grown More Over Five Years?
This was originally posted on our Voronoi app. Download the app for free on Apple or Android and discover incredible data-driven charts from a variety of trusted sources.
Gold is considered a unique asset due to its enduring value, historical significance, and application in various technologies like computers, spacecraft, and communications equipment.
Commonly regarded as a “safe haven asset”, gold is something investors typically buy to protect themselves during periods of global uncertainty and economic decline.
It is for this reason that gold has performed rather strongly in recent years, and especially in 2024. Persistent inflation combined with multiple wars has driven up demand for gold, helping it set a new all-time high of over $2,400 per ounce.
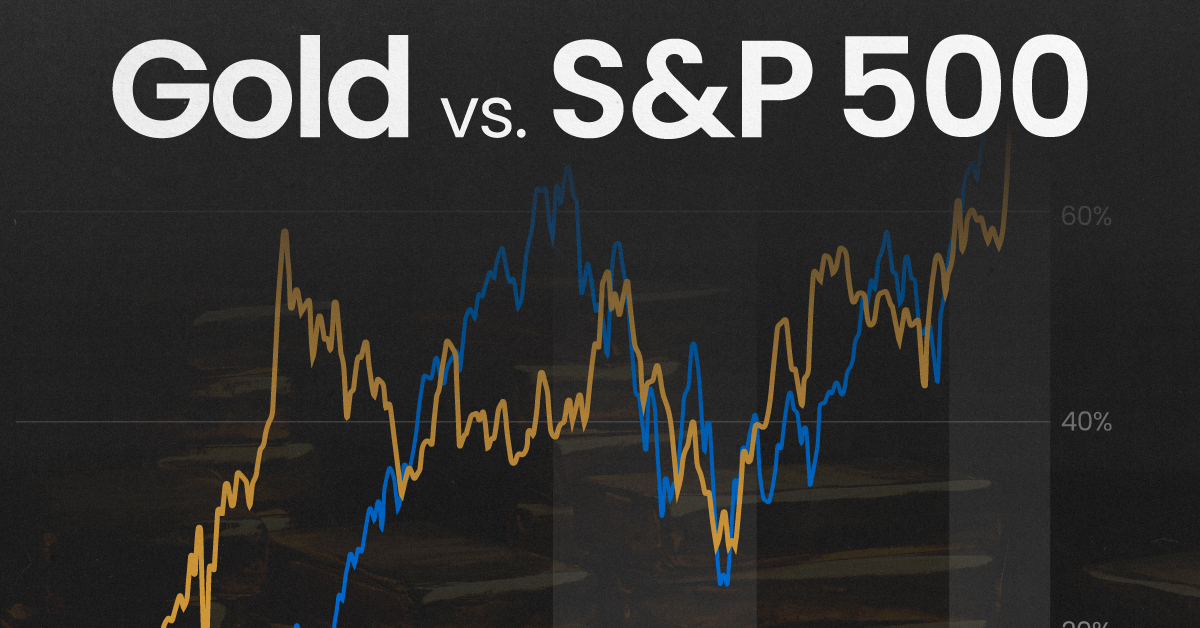
To put this into perspective, we visualized the performance of gold alongside the S&P 500. See the table below for performance figures as of April 12, 2024.
| Asset/Index | 1 Yr (%) | 5 Yr (%) |
|---|---|---|
| 🏆 Gold | +16.35 | +81.65 |
| 💼 S&P 500 | +25.21 | +76.22 |
Over the five-year period, gold has climbed an impressive 81.65%, outpacing even the S&P 500.
Get Your Gold at Costco
Perhaps a sign of how high the demand for gold is becoming, wholesale giant Costco is reportedly selling up to $200 million worth of gold bars every month in the United States. The year prior, sales only amounted to $100 million per quarter.
Consumers aren’t the only ones buying gold, either. Central banks around the world have been accumulating gold in very large quantities, likely as a hedge against inflation.
According to the World Gold Council, these institutions bought 1,136 metric tons in 2022, marking the highest level since 1950. Figures for 2023 came in at 1,037 metric tons.
See More Graphics on Gold
If you’re fascinated by gold, be sure to check out more Visual Capitalist content including 200 Years of Global Gold Production, by Country or Ranked: The Largest Gold Reserves by Country.

-

 Markets1 week ago
U.S. Debt Interest Payments Reach $1 Trillion
-

 Markets2 weeks ago
Ranked: The Most Valuable Housing Markets in America
-

 Money2 weeks ago
Which States Have the Highest Minimum Wage in America?
-

 AI2 weeks ago
Ranked: Semiconductor Companies by Industry Revenue Share
-

 Markets2 weeks ago
Ranked: The World’s Top Flight Routes, by Revenue
-

 Countries2 weeks ago
Population Projections: The World’s 6 Largest Countries in 2075
-

 Markets2 weeks ago
The Top 10 States by Real GDP Growth in 2023
-

 Money2 weeks ago
The Smallest Gender Wage Gaps in OECD Countries