Mining
How to Avoid Common Mistakes With Mining Stocks (Part 3: Jurisdiction)
“Location, location, location…”
This famous real estate adage also matters in mining. After all, it’s an industry that is all about the geology—but beyond the physical aspects and the location of a mineral deposit, there are also social and environmental factors that create a mining jurisdiction.
Common Mistakes With Jurisdiction
We’ve partnered with Eclipse Gold Mining on an infographic series to show you how to avoid common mistakes when evaluating and investing in mining exploration stocks.
Part 3 of the series focuses on six signals investors can use to gauge a company’s preparedness for the jurisdictions they operate in.

View the two other parts of this series so far, covering mistakes made in choosing the team as well as those made with a company’s business plan.
#1: Geological Potential: Methodical Prospecting or Wild Goose Chase?
It all starts with a great drill result, but even these can be “one-off” anomalies.
Mineral exploration is a methodical process of drawing a subsurface picture with the tip of a drill bit. A mineral discovery is the cumulative effort of years of research and drilling.
The key to reducing this geological risk is to find a setting that has shown previous potential and committing to it. Typically, a region is known to have hosted other great discoveries or shares a geology similar to other mining districts.
Signs of Methodical Prospecting:
- Lots of geological indicators
- Potential for further discovery
- Sound science
#2: Legal Environment: Well-Paved Path or Minotaur’s Maze?
Now that you have identified a region with the prospective geology you think could host a discovery, a company will have to secure the permits to explore and operate any further.
However, a management team that cannot navigate a country’s bureaucracy will face delays and obstacles, costing investors both time and money.
Without clear laws and competent management, a mining company’s best laid plans become lost in a maze with legal monsters around every legal corner.
Signs of a Well-Paved Highway:
- Existing laws encourage mining investment
- Relatively low bureaucracy
- Well-established permitting process
- Legacy of mining contributing to economy
#3: Politics: Professional Politics or Banana Republics?
A good legal framework is often the outcome of politics and stable governance—however so is a difficult legal framework.
The political stability of a nation can turn on one election and so can the prospects for developing a mine. An anti-mining leader can halt a mining project, or a pro-mining leader can usher forward one.
A positive national viewpoint on mining may be enough to lure investment dollars, but local politics may determine the success of a mining company.
Signs of Professional Politics:
- Positive history with mining companies
- Politically stable jurisdiction
- Rule of law respected
- Changes in government have little effect on the mining industry
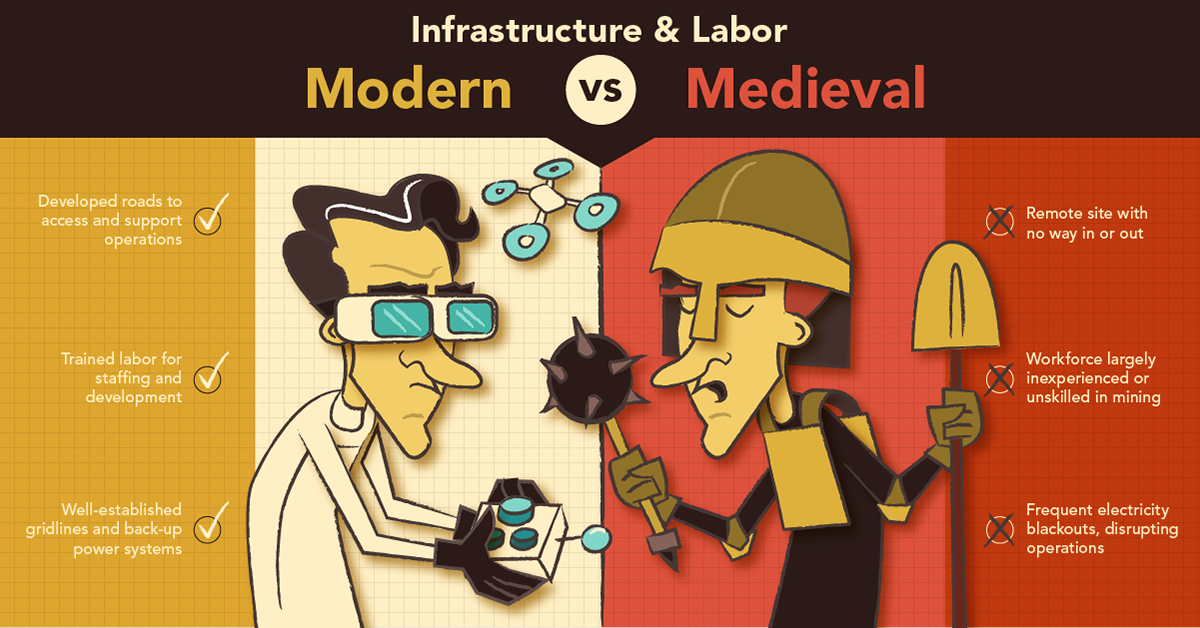
#4: Infrastructure & Labor: Modern or Medieval
Sometimes it is the discovery of valuable minerals that spurs national development, but this can also happen the other way around, in which development can encourage mineral discovery.
A mining company looking to build a new mine in a country with a tradition of mining will have an easier time. Access or lack thereof to modern machinery and trained employees will determine how much money will be needed.
That said, if a company is looking to develop a mining project in a new mining region, they must be ready to help create the skills and infrastructure it needs to mine.
Signs of a Modern Jurisdiction:
- Developed roads to access and support operations
- Trained labor for staffing and development
- Well-established grid lines and back-up power systems
#5: Community: Fostering Friendship or Sowing Enemies
Mining operations have a significant impact on the local community. Good companies look to make mutually beneficial partnerships of equals with local communities.
Ignoring or failing to respect the local community will jeopardize a mining project at every stage of its mine life. A local community that does not want mining to occur will oppose even the best laid plans.
Signs of a Friendly Relations:
- Operations bring community together
- Local history shows support for mining
- Understanding of local concerns and regional variety
- Company contributes to economic growth and health of the community
#6: Environment: Clean Campsite or One Night Party
There is no way around it: mining impacts the environment and local ecosystems. But, mining operations are a blip on the radar when it comes to Earth’s timeline.
Mine sites can again become productive ecosystems, if a company has the capacity and plan to mitigate mining’s impacts at every stage of the life of a mine—even beyond the life of a mine.
Signs of a Clean Campsite:
- Development plan mitigates environmental damage
- Well-planned closure and remediation
- Understand how communities use their environment
Bringing it together: ESG Investing
These six points outlined above point towards a more complete picture of the impacts of a mining project. Currently, this falls under what is labeled as Environmental, Social and Governance “ESG” standards.
Mining companies are the forefront of a big push to adopt these types of considerations into their business, because they directly affect natural and human environments.
ESG is no longer green wash, especially for the mining industry. Companies that understand and apply these concepts in their business will have better outcomes in the jurisdictions they operate within, hopefully offering investors a more successful venture.
Geology does not change on the human time scale, but bad management can quickly lose a good project and investor’s money if they do not pay attention to the other attributes of a jurisdiction.


Lithium
Ranked: The Top 10 EV Battery Manufacturers in 2023
Asia dominates this ranking of the world’s largest EV battery manufacturers in 2023.


The Top 10 EV Battery Manufacturers in 2023
This was originally posted on our Voronoi app. Download the app for free on iOS or Android and discover incredible data-driven charts from a variety of trusted sources.
Despite efforts from the U.S. and EU to secure local domestic supply, all major EV battery manufacturers remain based in Asia.
In this graphic we rank the top 10 EV battery manufacturers by total battery deployment (measured in megawatt-hours) in 2023. The data is from EV Volumes.
Chinese Dominance
Contemporary Amperex Technology Co. Limited (CATL) has swiftly risen in less than a decade to claim the title of the largest global battery group.
The Chinese company now has a 34% share of the market and supplies batteries to a range of made-in-China vehicles, including the Tesla Model Y, SAIC’s MG4/Mulan, and various Li Auto models.
| Company | Country | 2023 Production (megawatt-hour) | Share of Total Production |
|---|---|---|---|
| CATL | 🇨🇳 China | 242,700 | 34% |
| BYD | 🇨🇳 China | 115,917 | 16% |
| LG Energy Solution | 🇰🇷 Korea | 108,487 | 15% |
| Panasonic | 🇯🇵 Japan | 56,560 | 8% |
| SK On | 🇰🇷 Korea | 40,711 | 6% |
| Samsung SDI | 🇰🇷 Korea | 35,703 | 5% |
| CALB | 🇨🇳 China | 23,493 | 3% |
| Farasis Energy | 🇨🇳 China | 16,527 | 2% |
| Envision AESC | 🇨🇳 China | 8,342 | 1% |
| Sunwoda | 🇨🇳 China | 6,979 | 1% |
| Other | - | 56,040 | 8% |
In 2023, BYD surpassed LG Energy Solution to claim second place. This was driven by demand from its own models and growth in third-party deals, including providing batteries for the made-in-Germany Tesla Model Y, Toyota bZ3, Changan UNI-V, Venucia V-Online, as well as several Haval and FAW models.
The top three battery makers (CATL, BYD, LG) collectively account for two-thirds (66%) of total battery deployment.
Once a leader in the EV battery business, Panasonic now holds the fourth position with an 8% market share, down from 9% last year. With its main client, Tesla, now sourcing batteries from multiple suppliers, the Japanese battery maker seems to be losing its competitive edge in the industry.
Overall, the global EV battery market size is projected to grow from $49 billion in 2022 to $98 billion by 2029, according to Fortune Business Insights.

-

 Debt1 week ago
How Debt-to-GDP Ratios Have Changed Since 2000
-

 Markets2 weeks ago
Ranked: The World’s Top Flight Routes, by Revenue
-

 Countries2 weeks ago
Population Projections: The World’s 6 Largest Countries in 2075
-

 Markets2 weeks ago
The Top 10 States by Real GDP Growth in 2023
-

 Demographics2 weeks ago
The Smallest Gender Wage Gaps in OECD Countries
-

 United States2 weeks ago
Where U.S. Inflation Hit the Hardest in March 2024
-

 Green2 weeks ago
Top Countries By Forest Growth Since 2001
-

 United States2 weeks ago
Ranked: The Largest U.S. Corporations by Number of Employees