Mining
The Silver Series: Making The Case For Silver (Part 4 of 4)

2015 Silver Series Part 4: Making The Case For Silver
In the previous parts of The Silver Series, we’ve shown that silver has a rich and multi-faceted history with applications in money, health, and technology. We’ve covered the metal’s supply and geological origins, as well as the growing demand stemming from industry, investment, and other areas.
However, the real question for investors boils down to this: is it worth it to hold silver bullion or equities in a portfolio?
Silver and Gold
The two major precious metals are alike in many ways. They’ve both been used as money for thousands of years, and both are considered a store of wealth today. However, to understand the nuances of silver as an asset, it is important to keep in mind a couple of key differences that it holds from the yellow metal.
The most obvious difference is that silver is used much more widespread in industry than gold. Approximately 50% of all demand stems from technological applications like photovoltaics, automobiles, batteries, and other such uses. This gives silver a potentially wider range of demand triggers.
The other major difference is that in comparison to the gold market, silver trades thinly and with much higher volatility. In 2014, there was $20.4 billion of demand for physical silver and $159.7 billion demand for physical gold. Even more interesting, these physical markets are less than 1% the size of the total markets when factoring paper trades like derivatives, futures contracts, and options.
Silver typically hits higher highs and lower lows than gold. To the savvy investor, this creates great opportunity.
Why Own Silver?
The reasons an investor should consider exposure to silver can be summed up with three key points.
1. Diversification.
Silver has little or no correlation with most asset classes such as bonds, stocks, or real estate. This is because silver prices move based on supply and demand, but also because of other factors such as the global economic environment, futures market speculators, currency markets, the level of inflation or deflation, and central bank policy decisions. Even though silver itself is more volatile than many other asset classes, it does help reduce the overall risk of a portfolio by having less correlation to other asset classes. Over the last eight years, silver’s correlation to treasuries and bonds have been basically zero (-0.07 and 0.08 respectively). It has slightly higher correlation with US equities (0.23) and real estate (0.13).
2. Safe Haven
When the times get tough, silver is your friend. Even in the most challenging environments it holds its value or bucks the negative global trends.
How did silver do in the four years surrounding the Financial Crisis? Over a period where US equities, emerging markets, and REITs were down, silver more than doubled in value from 2007-2011.
3. Fundamentals and Value
The fundamental numbers around silver make it quite clear that silver could provide extreme value as an investment. Here are some key numbers:
- In the earth’s crust, there is 1 gram of silver for every 12.5 tonnes of rock.
- For centuries since ancient times, the gold-to-silver ratio was 15 to 1. That means 1 oz of gold could buy 15 oz of silver.
- In the earth’s crust, there is 19x more silver than gold by mass.
- The “modern” gold-to-silver ratio is closer to 50 to 1.
- Yet, in mid-2015 the ratio is 75 to 1, which means silver could be very undervalued relative to gold.
- The silver price, in terms of USD, is also at its lowest point in five years.
- Silver miners are even cheaper, trading at their lowest valuation in years.
Silver, the metal itself, continues to have the same impressive properties, supply and demand fundamentals, and a rich history as money. What has changed is what people are willing to pay for it at a given time.
Right now it seems that silver is being sold for half price.
That’s the end of our Silver Series. Thanks for reading!
Copper
Brass Rods: The Secure Choice
This graphic shows why brass rods are the secure choice for precision-machined and forged parts.

Brass Rods: The Secure Choice
The unique combination of machinability and recyclability makes brass rods the secure choice for manufacturers seeking future-proof raw material solutions.
This infographic, from the Copper Development Association, shows three ways brass rods give manufacturers greater control and a license to grow in the competitive market for precision-machined and forged products.
Future-Proof Investments in New Machine Tools
A material’s machinability directly impacts machine throughput, which typically has the largest impact on machine shop profitability.
The high-speed machining capabilities of brass rods maximize machine tool performance, allowing manufacturers to run the material faster and longer without sacrificing tool life, chip formation, or surface quality.
The high machining efficiency of brass leads to reduced per-part costs, quicker return on investment (ROI) for new machine tools, and expanded production capacity for new projects.
Supply Security Through Closed Loop Recycling
Brass, like its parent element copper, can be infinitely recycled.
In 2022, brass- and wire-rod mills accounted for the majority of the 830,000 tonnes of copper recycled from scrap in the United States.
Given that scrap ratios for machined parts typically range from 60-70% by weight, producing mills benefit from a secure and steady supply of clean scrap returned directly from customers, which is recycled to create new brass rods.
The high residual value of brass scrap creates a strong recycling incentive. Scrap buy back programs give manufacturers greater control over raw material net costs as scrap value is often factored into supplier purchase agreements.
Next Generation Alloys for a Lead-Free Future
Increasingly stringent global regulations continue to pressure manufacturers to minimize the use of materials containing trace amounts of lead and other harmful impurities.
The latest generation of brass-rod alloys is engineered to meet the most demanding criteria for lead leaching in drinking water and other sensitive applications.
Seven brass-rod alloys passed rigorous testing to become the only ‘Acceptable Materials’ against lower lead leaching criteria recently adopted in the national U.S. drinking water quality standard, NSF 61.

Learn more about the advantages of brass rods solutions.

-
 Base Metals1 year ago
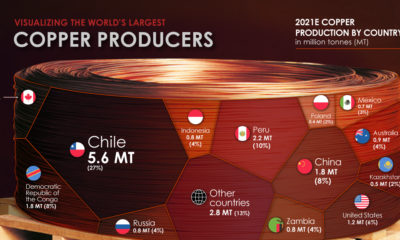
Ranked: The World’s Largest Copper Producers
Many new technologies critical to the energy transition rely on copper. Here are the world’s largest copper producers.
-

 Silver2 years ago
Mapped: Solar Power by Country in 2021
In 2020, solar power saw its largest-ever annual capacity expansion at 127 gigawatts. Here’s a snapshot of solar power capacity by country.
-
 Batteries5 years ago
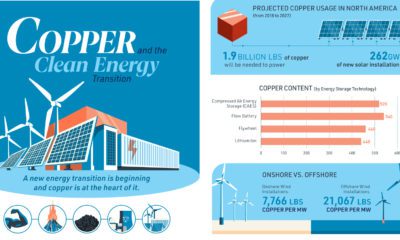
Visualizing Copper’s Role in the Transition to Clean Energy
A clean energy transition is underway as wind, solar, and batteries take center stage. Here’s how copper plays the critical role in these technologies.
-
 Science5 years ago
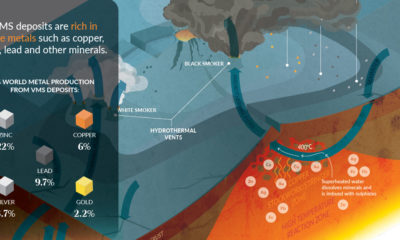
Everything You Need to Know on VMS Deposits
Deep below the ocean’s waves, VMS deposits spew out massive amounts of minerals like copper, zinc, and gold, making them a key source of the metals…
-
 Copper5 years ago
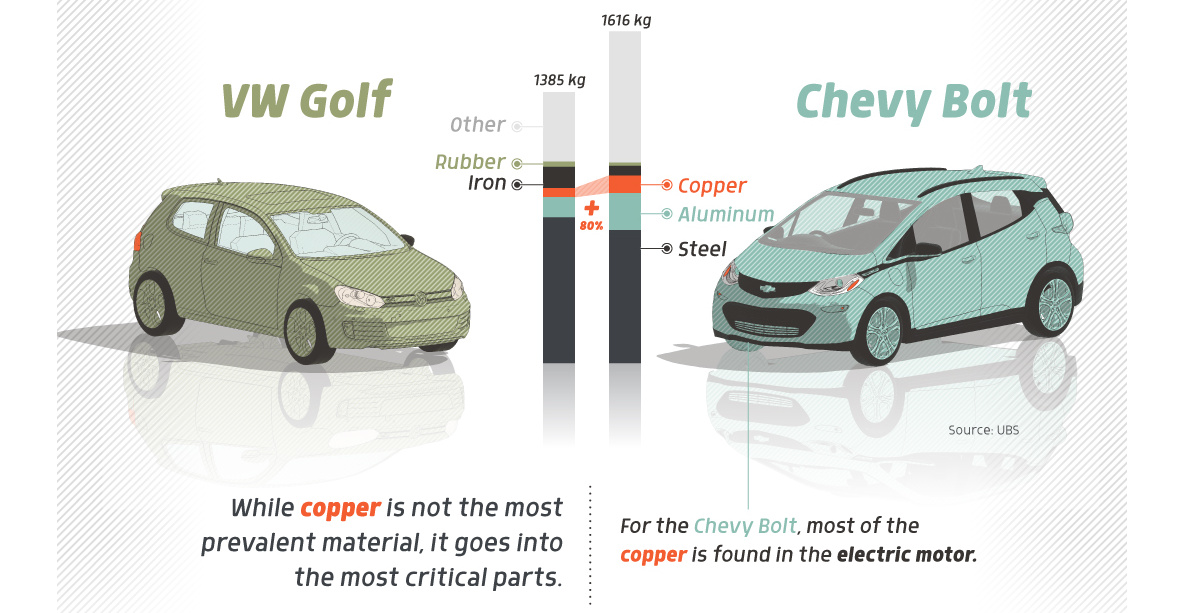
How Much Copper is in an Electric Vehicle?
Have you ever wondered how much copper is in an electric vehicle? This infographic shows the metal’s properties as well as the quantity of copper used.
-
 Copper6 years ago
Copper: Driving the Green Energy Revolution
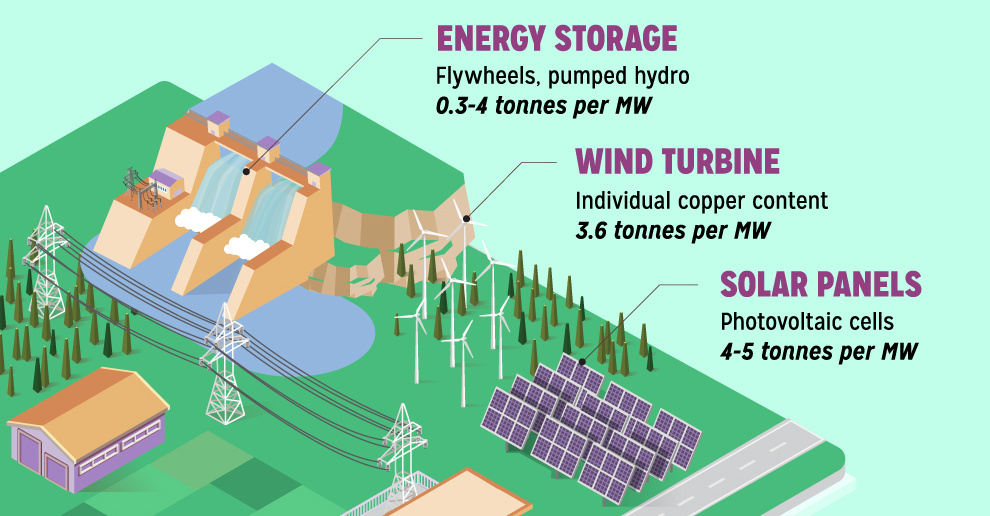
Renewable energy is set to fuel a new era of copper demand – here’s how much copper is used in green applications from EVs to photovoltaics.
-

 Real Estate2 weeks ago
Visualizing America’s Shortage of Affordable Homes
-

 Technology1 week ago
Ranked: Semiconductor Companies by Industry Revenue Share
-

 Money1 week ago
Which States Have the Highest Minimum Wage in America?
-

 Real Estate1 week ago
Ranked: The Most Valuable Housing Markets in America
-

 Business2 weeks ago
Charted: Big Four Market Share by S&P 500 Audits
-

 AI2 weeks ago
The Stock Performance of U.S. Chipmakers So Far in 2024
-

 Misc2 weeks ago
Almost Every EV Stock is Down After Q1 2024
-

 Money2 weeks ago
Where Does One U.S. Tax Dollar Go?


