Markets
The Shift to a Cashless Society is Snowballing
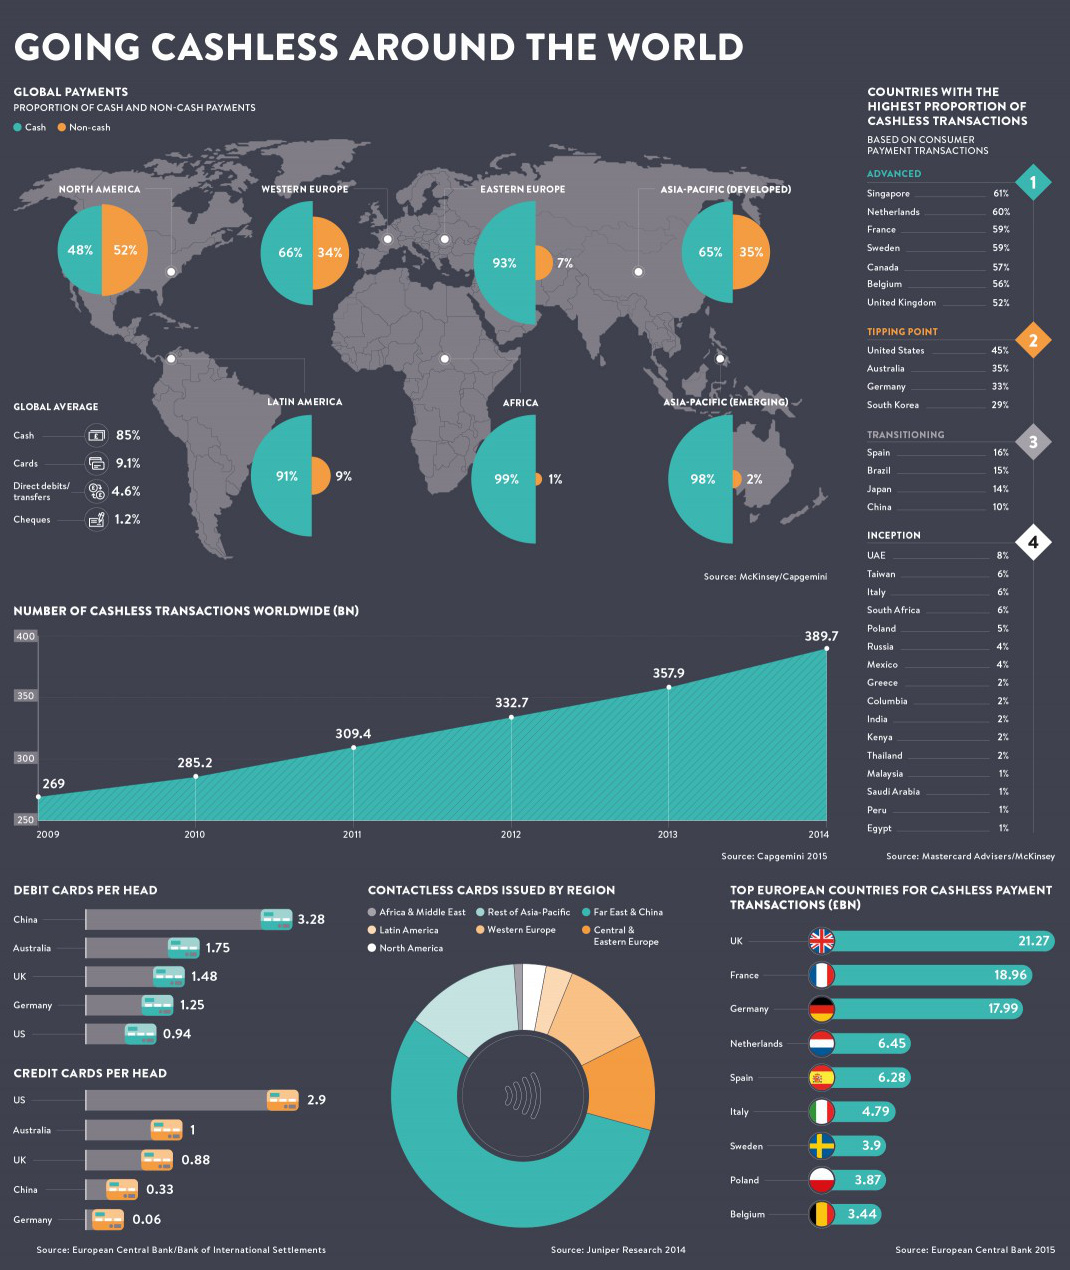
Image courtesy of: Raconteur
The Shift to a Cashless Society is Snowballing
Love it or hate it, cash is playing an increasingly less important role in society.
In some ways this is great news for consumers. The rise of mobile and electronic payments means faster, convenient, and more efficient purchases in most instances. New technologies are being built and improved to facilitate these transactions, and improving security is also a priority for many payment providers.
However, there is also a darker side in the shift to a cashless society. Governments and central banks have a different rationale behind the elimination of cash transactions, and as a result, the so-called “war on cash” is on.
On the Path to a Cashless Society
The Federal Reserve estimates that there will be $616.9 billion in cashless transactions in 2016. That’s up from around $60 billion in 2010.
Despite the magnitude of this overall shift, what is happening from country to country varies quite considerably. Consider the contradicting evidence between Sweden and Germany.
In Sweden, about 59% of all consumer transactions are cashless, and hard currency makes up just 2% of the economy. Yet, across the Baltic Sea, Germans are far bigger proponents of modern cash. This should not be too surprising, considering that the German words for “debt” and “guilt” are the exact same.
Within Germany, only 33% of consumer transactions are cashless, and there are only 0.06 credit cards in existence per person.
The Dark Side of Cashless
The shift to a cashless society is even gaining momentum in Germany, but it is not because of the willing adoption from the general public. According to Handelsblatt, a leading German business newspaper, a proposal to eliminate the €500 note while capping all cash transactions at €5,000 was made in February by the junior partner of the coalition government.
Governments have been increasingly pushing for a cashless society. Ostensibly, by having a paper trail for all transactions, such a move would decrease crime, money laundering, and tax evasion. France’s finance minister recently stated that he would “fight against the use of cash and anonymity in the French economy” in order to prevent terrorism and other threats. Meanwhile, former Secretary of the Treasury and economist Larry Summers has called for scrapping the U.S. $100 bill – the most widely used currency note in the world.
“Smoother” Aggregate Demand?
It’s not simply an argument of the above government rationale versus that of privacy and anonymity. Perhaps the least talked-about implication of a cashless society is the way that it could potentially empower central banking to have more ammunition in “smoothing” out the way people save and spend money.
By eliminating the prospect of cash savings, monetary policy options like negative interest rates would be much more effective if implemented. All money would presumably be stored under the same banking system umbrella, and even the most prudent savers could be taxed with negative rates to encourage consumer spending.
While there are certainly benefits to using digital payments, our view is that going digital should be an individual consumer choice that can be based on personal benefits and drawbacks. People should have the voluntary choice of going plastic or using apps for payment, but they shouldn’t be pushed into either option unwillingly.
Forced banishment of cash is a completely different thing, and we should be increasingly wary and suspicious of the real rationale behind such a scheme.


Economy
The Most Valuable Companies in Major EU Economies
From semiconductor equipment manufacturers to supercar makers, the EU’s most valuable companies run the gamut of industries.
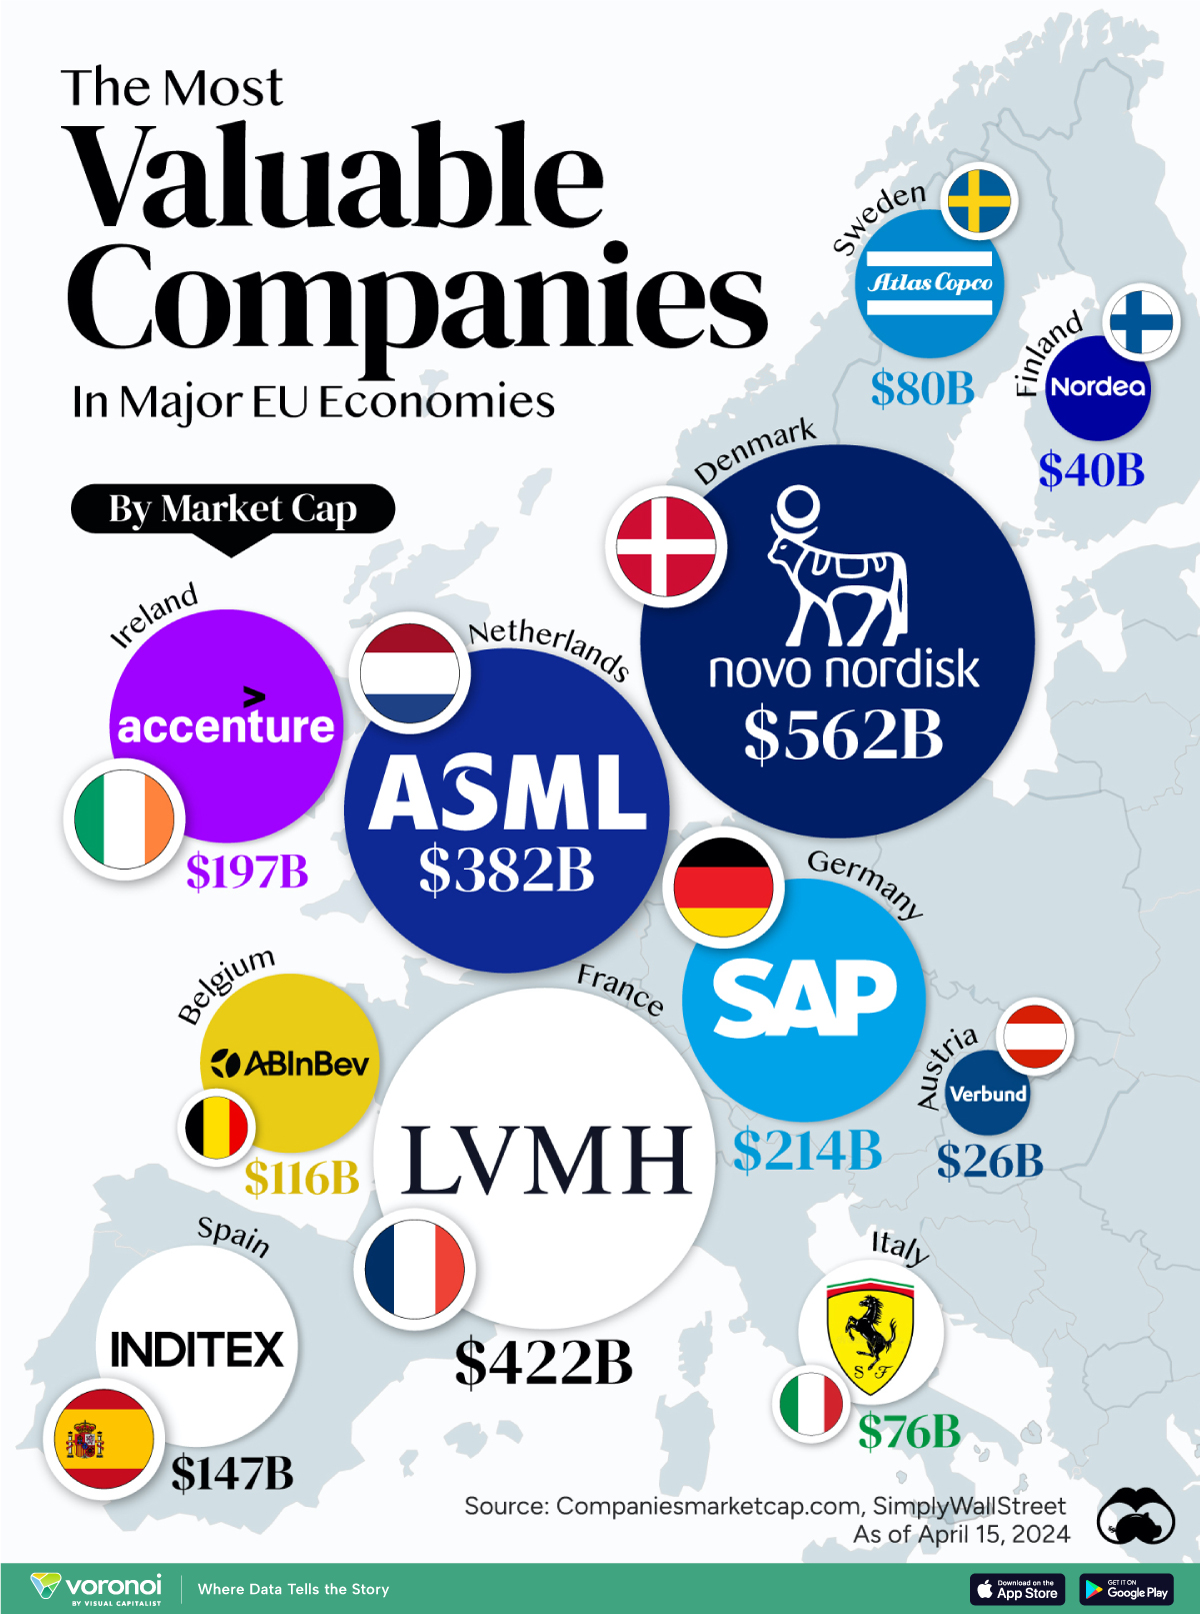
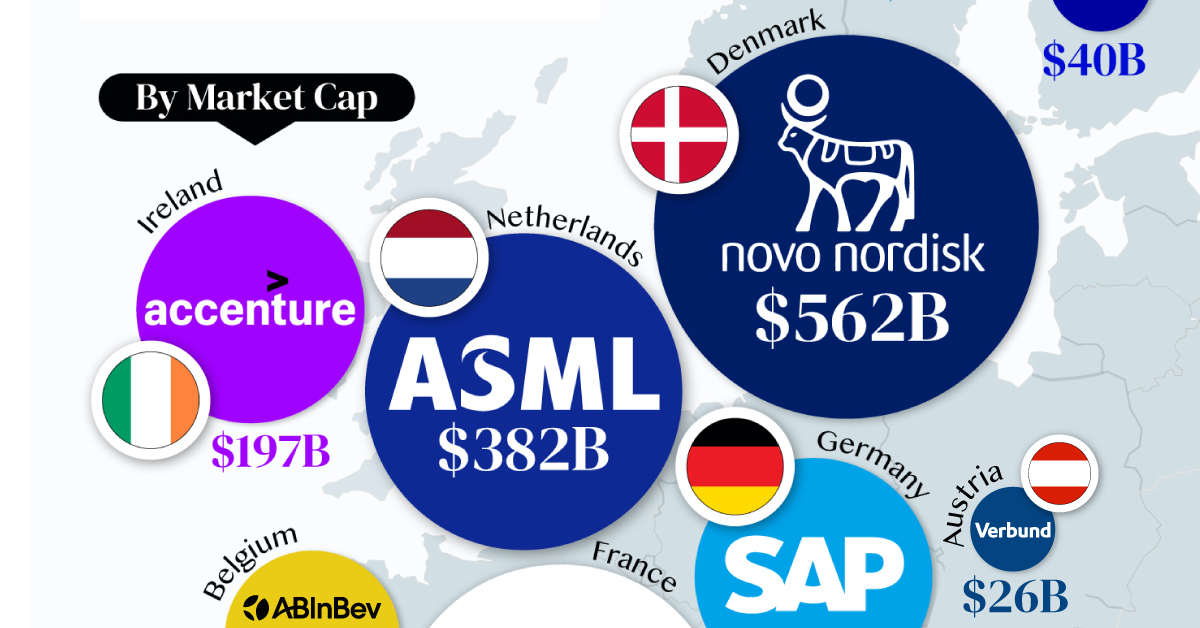
Most Valuable Companies in the EU, by Country
This was originally posted on our Voronoi app. Download the app for free on iOS or Android and discover incredible data-driven charts from a variety of trusted sources.
In this graphic, we mapped out the most valuable corporations in 11 major EU economies, based on their market capitalizations as of April 15th, 2024. All figures are in USD, and were sourced from Companiesmarketcap.com.
Novo Nordisk is currently worth more than $550 billion, making it Europe’s most valuable company by a wide margin. The pharmaceutical giant specializes in diabetes and weight-loss drugs. Demand for two of them, Ozempic and Wegovy, has surged due to their weight-loss capabilities, even causing nationwide shortages in the United States.
The following table includes an expanded list of the most valuable publicly-traded company in larger EU economies. Many of these were not included in the graphic due to space limitations.
| Country | Company | Sector | Market Cap |
|---|---|---|---|
| 🇩🇰 Denmark | 💊 Novo Nordisk | Pharmaceuticals | $562B |
| 🇫🇷 France | 👜 LVMH | Luxury Goods | $422B |
| 🇳🇱 Netherlands | 🔧 ASML | Semiconductor Equipment | $382B |
| 🇩🇪 Germany | 💼 SAP | Enterprise Software | $214B |
| 🇮🇪 Ireland | 🖥️ Accenture | IT Services | $197B |
| 🇪🇸 Spain | 👗 Inditex | Retail | $147B |
| 🇧🇪 Belgium | 🍻 Anheuser-Busch InBev | Beverages | $116B |
| 🇸🇪 Sweden | 🛠️ Atlas Copco | Industrial Equipment | $80B |
| 🇮🇹 Italy | 🏎️ Ferrari | Automotive | $76B |
| 🇫🇮 Finland | 🏦 Nordea Bank | Banking | $40B |
| 🇦🇹 Austria | 🔌 Verbund AG | Energy | $26B |
| 🇱🇺 Luxembourg | 🏗️ Tenaris | Oil & Gas Equipment | $22B |
| 🇨🇿 Czech Republic | 💡 CEZ Group | Energy | $20B |
| 🇵🇱 Poland | ⛽ PKN Orlen | Energy | $20B |
| 🇵🇹 Portugal | 🔌 EDP Group | Energy | $16B |
| 🇬🇷 Greece | 🏦 Eurobank | Banking | $7B |
| 🇭🇺 Hungary | ⛽ MOL Group | Energy | $7B |
| 🇭🇷 Croatia | 🏦 Zagrebacka Banka | Banking | $6B |
| 🇷🇴 Romania | ⛽ Romgaz | Energy | $4B |
| 🇸🇮 Slovenia | 💊 Krka | Pharmaceuticals | $4B |
Note: Figures are rounded and last updated on April 15th, 2024. Countries with top publicly-traded companies worth under $4 billion are excluded.
Luxury supergiant LVMH—which owns brands like Tiffany, Christian Dior, and TAG Heuer to name a few—is Europe’s second largest company by market cap, at $420 billion.
Rounding out the top three is ASML, which produces equipment crucial to chip manufacturers, worth $380 billion.
When looking at the region, there is a vast disparity between EU member states and their most valuable companies.
For example, as mentioned earlier, Denmark’s Novo Nordisk and France’s LVMH are worth between $400-550 billion each. Meanwhile, some countries don’t even have a single publicly-listed company that is worth over $1 billion.
In fact, only 12 EU countries (less than half of the union) are home to the top 100 most valuable companies within the bloc. An additional four countries are represented if you look at the list of the top 200 companies.

-

 Wealth6 days ago
Charted: Which City Has the Most Billionaires in 2024?
-

 Mining2 weeks ago
Gold vs. S&P 500: Which Has Grown More Over Five Years?
-

 Uranium2 weeks ago
The World’s Biggest Nuclear Energy Producers
-

 Education2 weeks ago
How Hard Is It to Get Into an Ivy League School?
-

 Debt2 weeks ago
How Debt-to-GDP Ratios Have Changed Since 2000
-

 Sports2 weeks ago
The Highest Earning Athletes in Seven Professional Sports
-

 Science2 weeks ago
Visualizing the Average Lifespans of Mammals
-

 Brands1 week ago
How Tech Logos Have Evolved Over Time