Markets
China’s Debt Bomb: No One Really Knows the Payload [Chart]
![China's Debt Bomb [Chart]](https://www.visualcapitalist.com/wp-content/uploads/2016/05/china-debt-bomb.png)
China’s Debt Bomb [Chart]
No One Knows if its a Hand Grenade or a Nuclear Explosion
The Chart of the Week is a weekly Visual Capitalist feature on Fridays.
The ramp up in Chinese debt accumulation has been a leading concern of investors for years. The average total debt of emerging market economies is 175% of GDP, and skyrocketing corporate non-financial debt has launched China far beyond that number.
The real question is: by how far?
The answer is disconcerting, because nobody really knows.
If the Chinese debt bomb is detonated, the impact on markets is anybody’s guess. Kyle Bass says the losses would be 5x that of the subprime mortgage crisis, while Moody’s says the bomb will be safely disarmed by authorities far before it goes off.
In today’s chart, we look at various estimates to the size of China’s debt bomb, its payload, and what might spark the fuse.
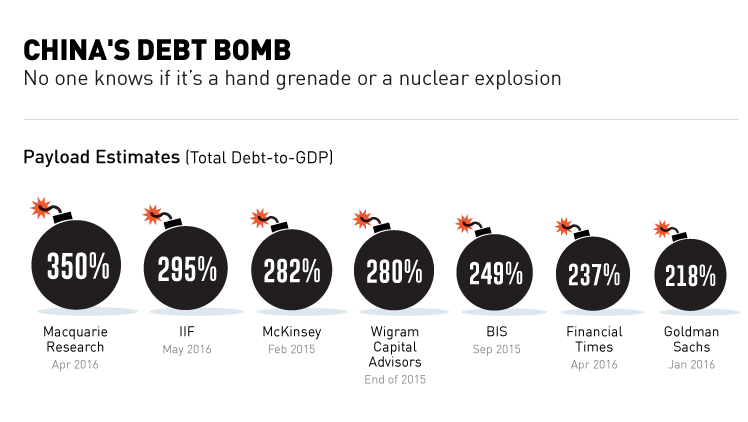
China’s Debt Bomb: The Payload
Mckinsey came out with a widely-publicized estimate of China’s debt at the beginning of 2015. Using figures up to Q2 2014, they estimated that total Chinese debt was 282% of GDP, an increase from 158% in 2007.
Since then, various trusted organizations have come up with follow-up estimates.
On the low end, Goldman Sachs came out with an estimate in January 2016 of 216% total debt-to-GDP for 2015. (A few months later, they put out a separate report saying that total debt-to-GDP was estimated to be closer to 270% for 2016.)
On the high end, Macquarie analyst Viktor Shvets said that China’s debt was $35 trillion, or “nearly 350%” of GDP.
The truth is that it’s anybody’s guess. China’s official estimates are fairly useless, and the country has a massive and quickly evolving shadow banking sector that complicates these projections significantly.
Explosive Materials
Total debt is made up of various components, including government, corporate, banking, and household debts.
In the case of China, it is corporate debt that is particularly explosive. According to Mckinsey, the country’s corporate sector already has a higher debt-to-GDP than the United States, Canada, South Korea, or Germany, even while still being considered an “emerging market”.
S&P Global Ratings now figures that Chinese corporate debt is in the 160% range, up from 98% in 2008. The current number in the United States is a less ominous 70%.
China’s central bank is just as concerned as anyone else. Here’s what the Governor of the People’s Bank of China, Zhou Xiaochuan, had to say about a month ago:
Lending as a share of GDP, especially corporate lending as a share of GDP, is too high.
Xiaochuan also noted that a high leverage ratio is more prone to macroeconomic risk.
Defusing the Bomb
If there’s something that can ignite the fuse of China’s debt bomb, it’s non-performing loans (NPLs).
An NPL is a sum of money borrowed upon which the debtor has not made scheduled payments. They are essentially loans that are either close to defaulting, or already in default territory.
China has an official estimate for this number, and it is a benign 1.7% of debt. Unfortunately, independent researchers peg it much higher.
Bullish analysts have the number pegged in the high single-digits, while bearish analysts put the range anywhere between 15% and 21%. Even the IMF says that loans “potentially at risk” would be equal to 15.5% of total commercial lending.
If there’s a place to start defusing the bomb, this is it.


Markets
Ranked: The Largest U.S. Corporations by Number of Employees
We visualized the top U.S. companies by employees, revealing the massive scale of retailers like Walmart, Target, and Home Depot.


The Largest U.S. Corporations by Number of Employees
This was originally posted on our Voronoi app. Download the app for free on Apple or Android and discover incredible data-driven charts from a variety of trusted sources.
Revenue and profit are common measures for measuring the size of a business, but what about employee headcount?
To see how big companies have become from a human perspective, we’ve visualized the top U.S. companies by employees. These figures come from companiesmarketcap.com, and were accessed in March 2024. Note that this ranking includes publicly-traded companies only.
Data and Highlights
The data we used to create this list of largest U.S. corporations by number of employees can be found in the table below.
| Company | Sector | Number of Employees |
|---|---|---|
| Walmart | Consumer Staples | 2,100,000 |
| Amazon | Consumer Discretionary | 1,500,000 |
| UPS | Industrials | 500,000 |
| Home Depot | Consumer Discretionary | 470,000 |
| Concentrix | Information Technology | 440,000 |
| Target | Consumer Staples | 440,000 |
| Kroger | Consumer Staples | 430,000 |
| UnitedHealth | Health Care | 400,000 |
| Berkshire Hathaway | Financials | 383,000 |
| Starbucks | Consumer Discretionary | 381,000 |
| Marriott International | Consumer Discretionary | 377,000 |
| Cognizant | Information Technology | 346,600 |
Retail and Logistics Top the List
Companies like Walmart, Target, and Kroger have a massive headcount due to having many locations spread across the country, which require everything from cashiers to IT professionals.
Moving goods around the world is also highly labor intensive, explaining why UPS has half a million employees globally.
Below the Radar?
Two companies that rank among the largest U.S. corporations by employees which may be less familiar to the public include Concentrix and Cognizant. Both of these companies are B2B brands, meaning they primarily work with other companies rather than consumers. This contrasts with brands like Amazon or Home Depot, which are much more visible among average consumers.
A Note on Berkshire Hathaway
Warren Buffett’s company doesn’t directly employ 383,000 people. This headcount actually includes the employees of the firm’s many subsidiaries, such as GEICO (insurance), Dairy Queen (retail), and Duracell (batteries).
If you’re curious to see how Buffett’s empire has grown over the years, check out this animated graphic that visualizes the growth of Berkshire Hathaway’s portfolio from 1994 to 2022.

-

 Business2 weeks ago
America’s Top Companies by Revenue (1994 vs. 2023)
-

 Environment1 week ago
Ranked: Top Countries by Total Forest Loss Since 2001
-

 Real Estate1 week ago
Visualizing America’s Shortage of Affordable Homes
-

 Maps2 weeks ago
Mapped: Average Wages Across Europe
-

 Mining2 weeks ago
Charted: The Value Gap Between the Gold Price and Gold Miners
-

 Demographics2 weeks ago
Visualizing the Size of the Global Senior Population
-

 Misc2 weeks ago
Tesla Is Once Again the World’s Best-Selling EV Company
-

 Technology2 weeks ago
Ranked: The Most Popular Smartphone Brands in the U.S.