Misc
Why the Lottery is a Regressive Tax on the Nation’s Poorest
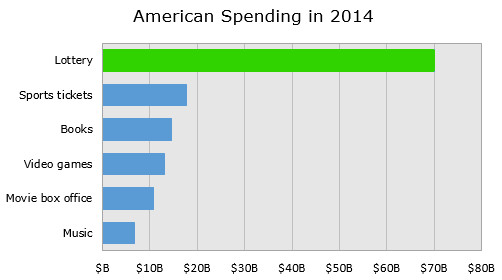
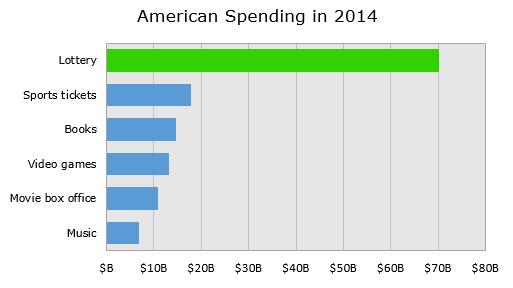
Every year, Americans spend a mind-blowing $70.1 billion on the lottery. That works out to an average of $630 per household, representing more money spent on gambling than on books, sports tickets, recorded music sales, video games, and the movie box office – all combined!
This is according to data visualization expert Max Galka, who published a series of posts and visualizations on the economics of the lottery in his Metrocosm blog. The numbers he provides are both astounding and alarming, ultimately making a convincing case that the lottery is a regressive and inefficient tax on some of the nation’s poorest people.
Let’s start with the economics. Here’s the math on the New York Lottery, which is a starting point to understanding the inefficiency behind lottos in the first place:
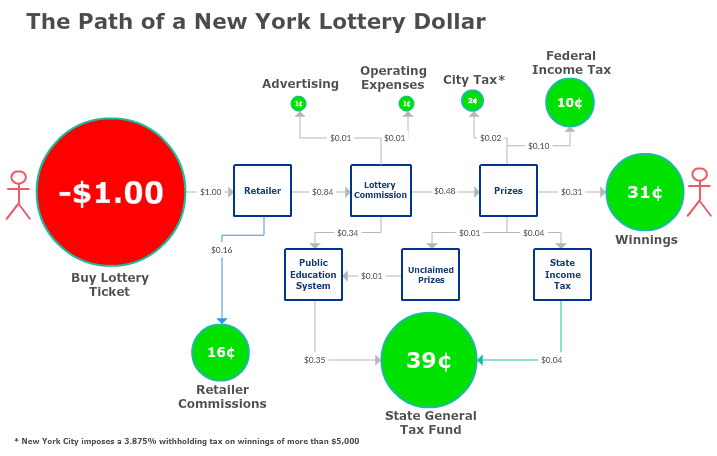
To sum up the math:
- 51% of each dollar goes to tax revenue: federal, state, and municipal.
- 18% goes to covering expenses, such as advertising or retailer commissions. This is the part that makes the process inefficient.
- 31% of each dollar actually goes to the prize money, and that basically sums up the terrible odds behind winning in the first place.
In other words, for every $3 spent on the New York Lottery, less than $1 is paid out to winners, while the other $2 is going to expenses and tax revenues.
The House Advantage
As Max notes in one of his posts, the lottery itself is not a tax – but the artificially inflated price of lottery tickets ultimately ends up as an indirect excise tax:
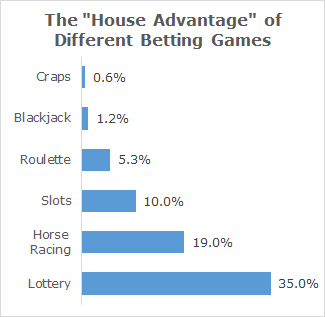
Choosing to play the lottery is voluntary. But much like sales taxes, the inflated price of lottery tickets is not.
It is illegal for anyone but the state to run a lottery. So unlike casinos, which face competition from other casinos, lotteries operate as a monopoly, so they can set their pricing artificially high, or equivalently, their payout rates artificially low.
While it is true that many people stay away from lottery tickets because the odds are not in their favor, there are groups of people that are far less fortunate. They and their families bear the brunt of inefficient lotto economics, as well as the house advantage.
Who’s Buying Lottery Tickets?
Lottery sales follow the 80/20 rule. It turns out that 82% of all sales come from 20% of the players.
Many of these players are compulsive gamblers, and many also come from lower income brackets.
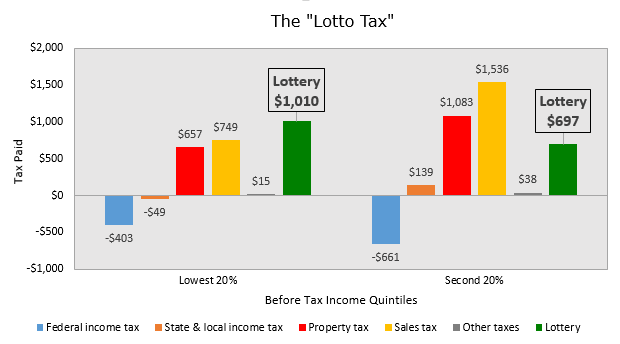
In this post, which includes some key assumptions, Max shows that the “lottery tax” is a significant burden for many low-income households even in contrast with other taxes:
Want more perspective on lottery ticket sales? We previously showed a similar comparison of U.S. consumption numbers in real-time.


VC+
VC+: Get Our Key Takeaways From the IMF’s World Economic Outlook
A sneak preview of the exclusive VC+ Special Dispatch—your shortcut to understanding IMF’s World Economic Outlook report.

Have you read IMF’s latest World Economic Outlook yet? At a daunting 202 pages, we don’t blame you if it’s still on your to-do list.
But don’t worry, you don’t need to read the whole April release, because we’ve already done the hard work for you.
To save you time and effort, the Visual Capitalist team has compiled a visual analysis of everything you need to know from the report—and our upcoming VC+ Special Dispatch will be available exclusively to VC+ members on Thursday, April 25th.
If you’re not already subscribed to VC+, make sure you sign up now to receive the full analysis of the IMF report, and more (we release similar deep dives every week).
For now, here’s what VC+ members can expect to receive.
Your Shortcut to Understanding IMF’s World Economic Outlook
With long and short-term growth prospects declining for many countries around the world, this Special Dispatch offers a visual analysis of the key figures and takeaways from the IMF’s report including:
- The global decline in economic growth forecasts
- Real GDP growth and inflation forecasts for major nations in 2024
- When interest rate cuts will happen and interest rate forecasts
- How debt-to-GDP ratios have changed since 2000
- And much more!

Get the Full Breakdown in the Next VC+ Special Dispatch
VC+ members will receive the full Special Dispatch on Thursday, April 25th.
Make sure you join VC+ now to receive exclusive charts and the full analysis of key takeaways from IMF’s World Economic Outlook.
Don’t miss out. Become a VC+ member today.
What You Get When You Become a VC+ Member
VC+ is Visual Capitalist’s premium subscription. As a member, you’ll get the following:
- Special Dispatches: Deep dive visual briefings on crucial reports and global trends
- Markets This Month: A snappy summary of the state of the markets and what to look out for
- The Trendline: Weekly curation of the best visualizations from across the globe
- Global Forecast Series: Our flagship annual report that covers everything you need to know related to the economy, markets, geopolitics, and the latest tech trends
- VC+ Archive: Hundreds of previously released VC+ briefings and reports that you’ve been missing out on, all in one dedicated hub
You can get all of the above, and more, by joining VC+ today.

-

 Green1 week ago
Ranked: The Countries With the Most Air Pollution in 2023
-

 Automotive2 weeks ago
Almost Every EV Stock is Down After Q1 2024
-

 AI2 weeks ago
The Stock Performance of U.S. Chipmakers So Far in 2024
-

 Markets2 weeks ago
Charted: Big Four Market Share by S&P 500 Audits
-

 Real Estate2 weeks ago
Ranked: The Most Valuable Housing Markets in America
-

 Money2 weeks ago
Which States Have the Highest Minimum Wage in America?
-

 AI2 weeks ago
Ranked: Semiconductor Companies by Industry Revenue Share
-

 Travel2 weeks ago
Ranked: The World’s Top Flight Routes, by Revenue