Leadership
The New Rules of Leadership: 5 Forces Shaping Expectations of CEOs
It’s common knowledge that CEOs assume a long list of roles and responsibilities.
But in today’s world, more and more people rely on them to go beyond their day-to-day responsibilities and advocate for broader social change. In fact, a number of external forces are changing how leaders are now expected to behave.
How can leaders juggle these evolving expectations while successfully leading their companies into the future?
The New Rules of Leadership
This infographic from bestselling author Vince Molinaro explores five drivers reshaping our world that leaders must pay attention to in order to bring about real change.

How is the World Being Reshaped?
Leaders need to constantly stay one step ahead of the transformative forces that impact businesses on a broader scale.
Below we outline five key drivers that are changing what it means to be a leader in today’s world:
1. Transformative Technologies
Over the last number of decades, several technologies have emerged that could either accelerate the disruption of companies, or provide them with new opportunities for growth. According to KPMG, 72% of CEOs believe the next three years will be more critical for their industry than the previous 50 years.
For example, artificial intelligence (AI), can now provide companies with insights into what motivates their employees and how they can help them succeed. IBM’s AI predictive attrition program can even predict when employees are about to quit—saving them roughly $300 million in retention costs.
Leaders must accept that the future will be mediated by technology, and how they respond could determine whether or not their organization survives entirely.
2. Geopolitical Instability
Geopolitical risks—such as trade disputes or civil unrest—can have a catastrophic impact on a business’s bottom line, no matter its industry. Although 52% of CEOs believe the geopolitical landscape is having a significant impact on their companies, only a small portion say they have taken active steps to address these risks.
By being more sensitive to the world around them, leaders can anticipate and potentially mitigate these risks. Extensive research into geopolitical trends and leveraging the appropriate experts could support a geopolitical risk strategy, and alleviate some of the potential repercussions.
3. Revolutionizing the Working Environment
As the future of work looms, leaders are being presented with the opportunity to reimagine the inner workings of their company. But right now, they are fighting against a wide spectrum of predictions around what they should expect, with estimations surrounding the automation risk of jobs ranging from 5% to 61% as a prime example.
While physical, repetitive, or basic cognitive tasks carry a higher risk of automation, the critical work that remains will require human interaction, creativity, and judgment.
Leaders should avoid getting caught up in the hype regarding the future of work, and simply focus on helping their employees navigate the next decade.
By creating an inspiring work environment and investing in retraining and reskilling, leaders can nurture employee well-being and create a sense of connectedness and resilience in the workplace.
4. Delivering Diversity
Diversity and inclusion can serve as a path to engaging employees, and leaders are being asked to step up and deliver like never before. A staggering 77% of people feel that CEOs are responsible for leading change on important social issues like racial inequality.
But while delivering diversity, equity, and inclusion seems to be growing in importance, many companies are struggling to understand the weight of this issue.
An example of this is Noah’s Ark Paradox, which describes the belief that hiring “two of every kind” creates a diverse work environment. In reality, this creates a false sense of inclusion because the voices of these people may never actually be heard.
Modern day leaders must create a place of belonging where everyone—regardless of gender, race, sexual orientation, ability, or age—is listened to.
5. Repurposing Corporations
The drivers listed above ladder up to the fact that society is looking to businesses to help solve important issues, and leaders are the ones being held accountable.
With 84% of people expecting CEOs to inform conversations and policy debates on one or more pressing issues, from job automation to the impact of globalization, CEOs have the potential to transform their organization by galvanizing employees on the topics that matter to them.
For a long time, the purpose of corporations was purely to create value for shareholders. Now, leaders are obligated to follow a set of five commitments:
- Deliver value to customers
- Invest in employees
- Deal fairly and ethically with suppliers
- Support communities
- Generate long-term value for shareholders
Ultimately, these five commitments build currency for trust, which is critical for sustained growth and building a productive and satisfied workforce.
Lead the Future
If leaders understand the context they operate in, they can identify opportunities that could fuel their organization’s growth, or alternatively, help them pivot in the face of impending threats.
But organizations must invest in the development of their leaders so that they can see the bigger picture—and many are failing to do so.
By recognizing the new rules of leadership, CEOs and managers can successfully lead their organizations, and the world, into a new and uncertain future.


Leadership
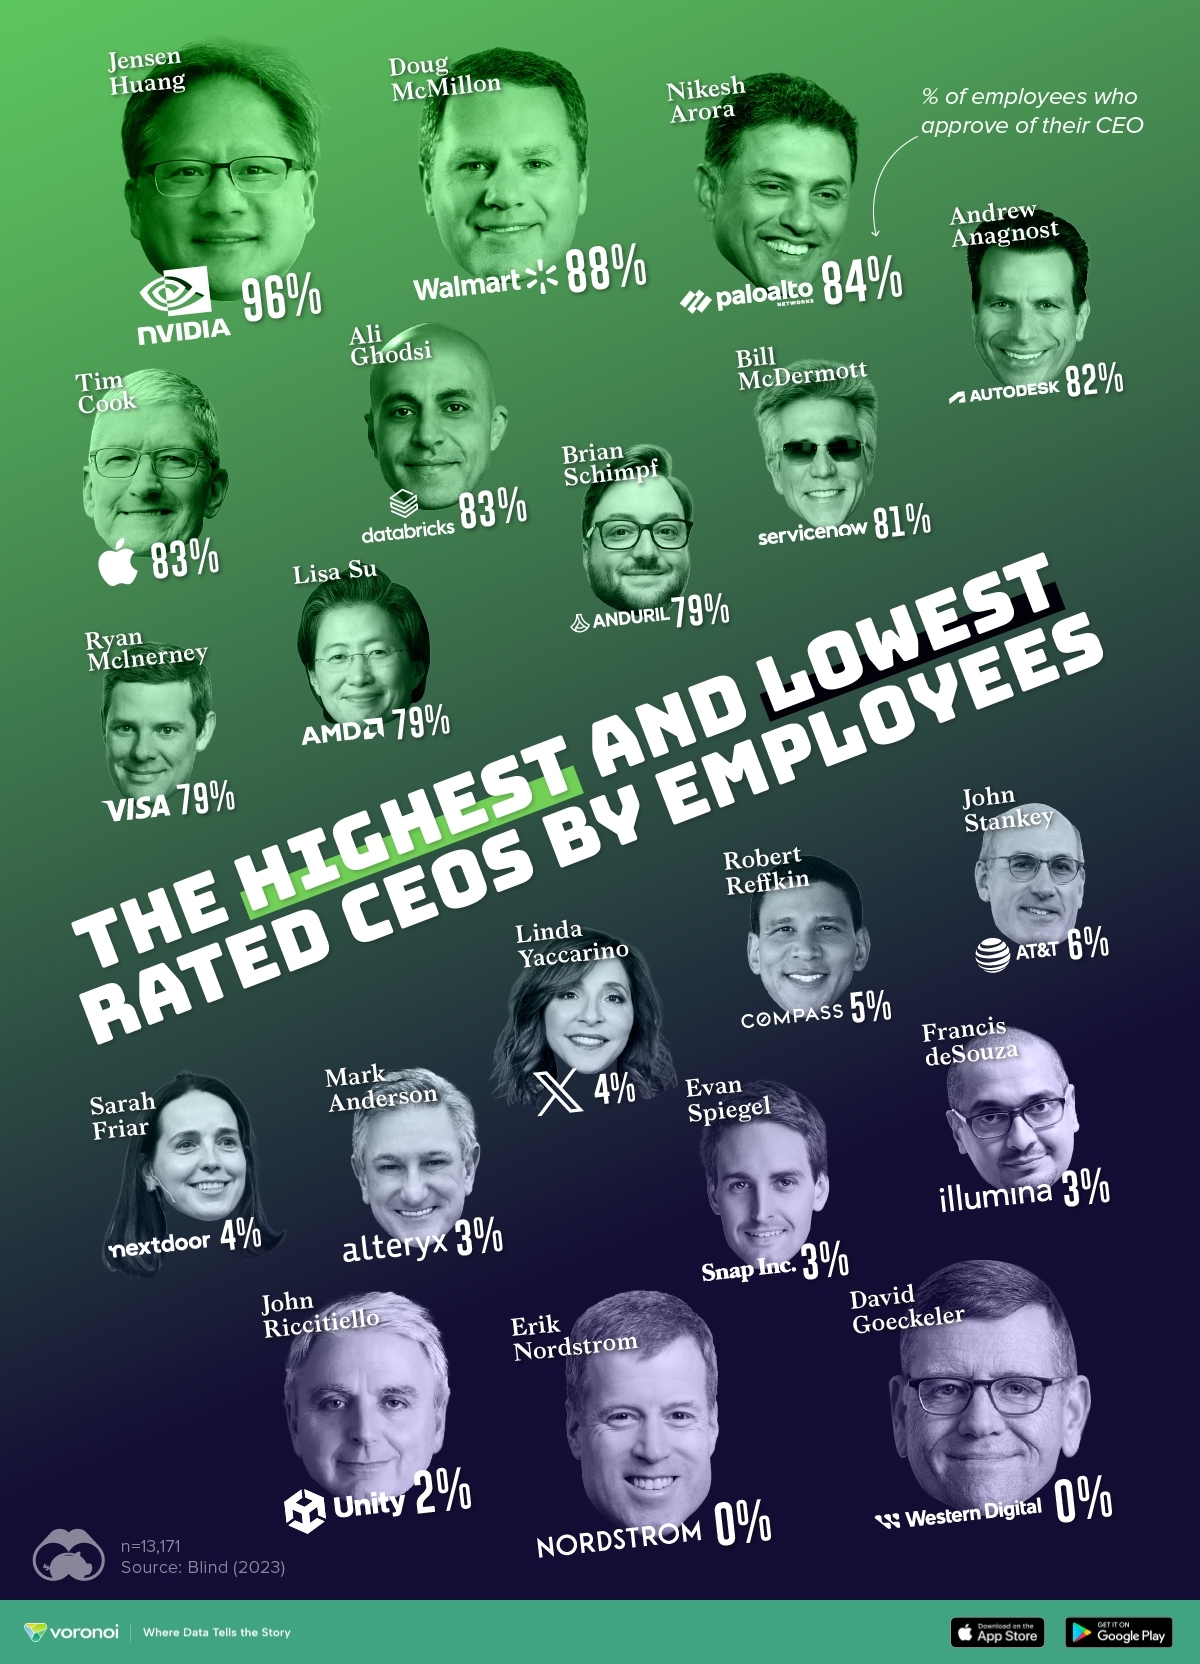
Who Are America’s Most Popular CEOs?
Social network Blind polled 13,000+ respondents on whether they approved or disapproved of the way their CEO handled the job, generating the approval rating of more than 100 CEOs.
Who Are America’s Most Popular CEOs?
What do the employees at America’s largest companies think of the leadership?
To answer that, we visualize CEO approval ratings gathered by professional social network Blind.
The results are based on a survey of 13,171 verified professionals in the U.S., conducted between August 18th–23rd, 2023. Respondents were asked if they approve or disapprove of the way their CEO is handling their job.
Top 10 Popular CEOs By Their Employees’ Approval Ratings
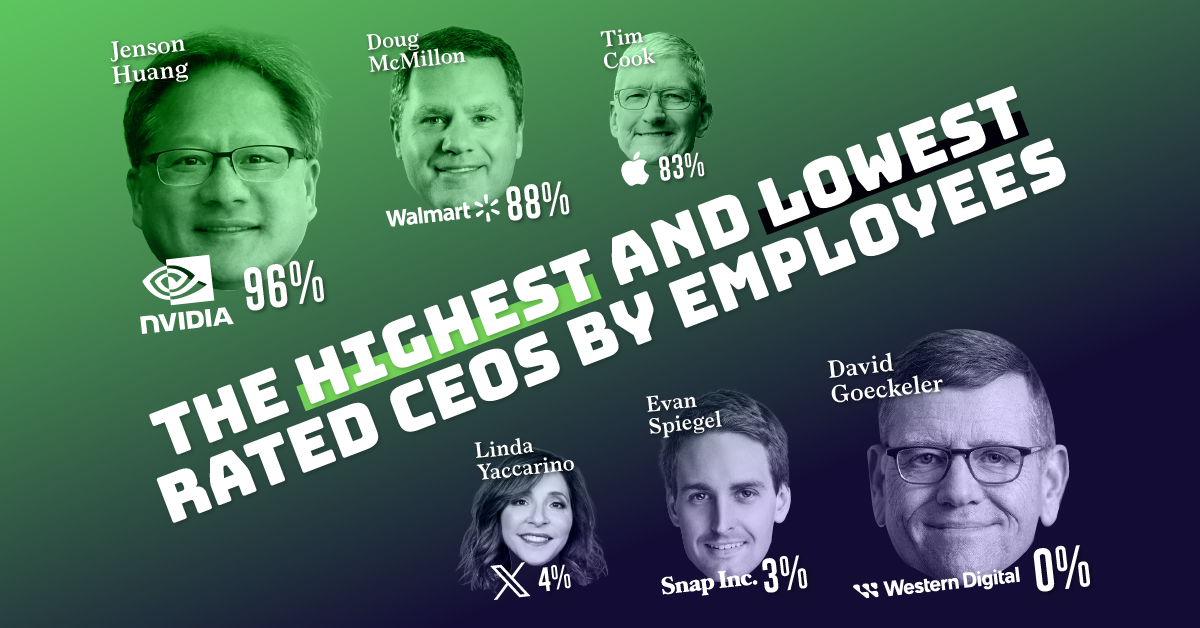
By far, the most popular CEO right now (according to Blind’s respondents anyway) is Nvidia’s Jensen Huang, with an astonishing 96% approval rating.
Huang’s numbers point to a theme in the data. Blind notes that there is a correlation between company stock performance and CEO approval rating. Nvidia’s critical role in the artificial intelligence hype train has sent shares up nearly 3x year-on-year. Their financials for the last three quarters show that profit is already up more than four-fold from last year.
Crucially, Huang also avoided layoffs that were otherwise rampant in the tech industry, helping his popularity amongst the staff.
Here are the top 10 most popular CEOs according to Blind’s poll.
| Rank | Company | CEO | Approve (%) |
|---|---|---|---|
| 1 | Nvidia | Jensen Huang | 96% |
| 2 | Walmart | Doug McMillon | 88% |
| 3 | Palo Alto Networks | Nikesh Arora | 84% |
| 4 | Apple | Tim Cook | 83% |
| 5 | Databricks | Ali Ghodsi | 83% |
| 6 | Autodesk | Andrew Anagnost | 82% |
| 7 | ServiceNow | Bill McDermott | 81% |
| 8 | Anduril Industries | Brian Schimpf | 79% |
| 9 | AMD | Lisa Su | 79% |
| 10 | Visa | Ryan Mclnerney | 79% |
In fact, the Blind survey uncovered that all of the 10 most popular CEOs, with the exception of Andrew Anag from AutoDesk, did not cut jobs in the last year.
The opposite is true for some of the lowest-rated CEOs.
The Least Popular CEOs By Employee Approval Ratings
Eric Nordstrom (Nordstrom) and David Goeckeler (Western Digital) shared the lowest approval rating possible in the poll: 0%. From Blind’s methodology section, this means not a single surveyed employee answered “strongly approve” or “somewhat approve” to the question.
Both companies cut nearly 200 jobs in 2023, with Nordstrom also responsible for the job losses amongst the company’s wage workers, who staffed the many retail stores the company shuttered.
Here’s the top 10 least popular CEOs according to Blind’s poll.
| Rank | Company | CEO | Approve (%) |
|---|---|---|---|
| 1 | Nordstrom | Erik Nordstrom | 0% |
| 2 | Western Digital | David Goeckeler | 0% |
| 3 | Unity Technologies | John Riccitiello | 2% |
| 4 | Illumina | Francis deSouza | 3% |
| 5 | Snap | Evan Spiegel | 3% |
| 6 | Alteryx | Mark Anderson | 3% |
| 7 | X (formerly Twitter) | Linda Yaccarino | 4% |
| 8 | Nextdoor | Sarah Friar | 4% |
| 9 | Compass | Robert Reffkin | 5% |
| 10 | AT&T | John Stankey | 6% |
Also featuring on this list of least-liked CEOs: Evan Spiegel (3%), who reduced Snap’s workforce by a fifth and Linda Yaccarino (4%), who heads X (formerly Twitter) that has been in turmoil since Elon Musk acquired the company in October, 2022.

-

 Green2 weeks ago
Ranked: Top Countries by Total Forest Loss Since 2001
-

 Travel1 week ago
Ranked: The World’s Top Flight Routes, by Revenue
-

 Technology2 weeks ago
Ranked: Semiconductor Companies by Industry Revenue Share
-

 Money2 weeks ago
Which States Have the Highest Minimum Wage in America?
-

 Real Estate2 weeks ago
Ranked: The Most Valuable Housing Markets in America
-

 Markets2 weeks ago
Charted: Big Four Market Share by S&P 500 Audits
-

 AI2 weeks ago
The Stock Performance of U.S. Chipmakers So Far in 2024
-

 Automotive2 weeks ago
Almost Every EV Stock is Down After Q1 2024