Chart of the Week
Ranked: The Social Mobility of 82 Countries
Ranked: The Social Mobility of 82 Countries
It’s an unfortunate truth that a person’s opportunities can be partially tethered to their socioeconomic status at birth.
Although winning or losing the “birth lottery” will continue to shape the lives of generations to come, climbing the socioeconomic ladder is possible. However, it boils down to what opportunities people are afforded in the country they live in.
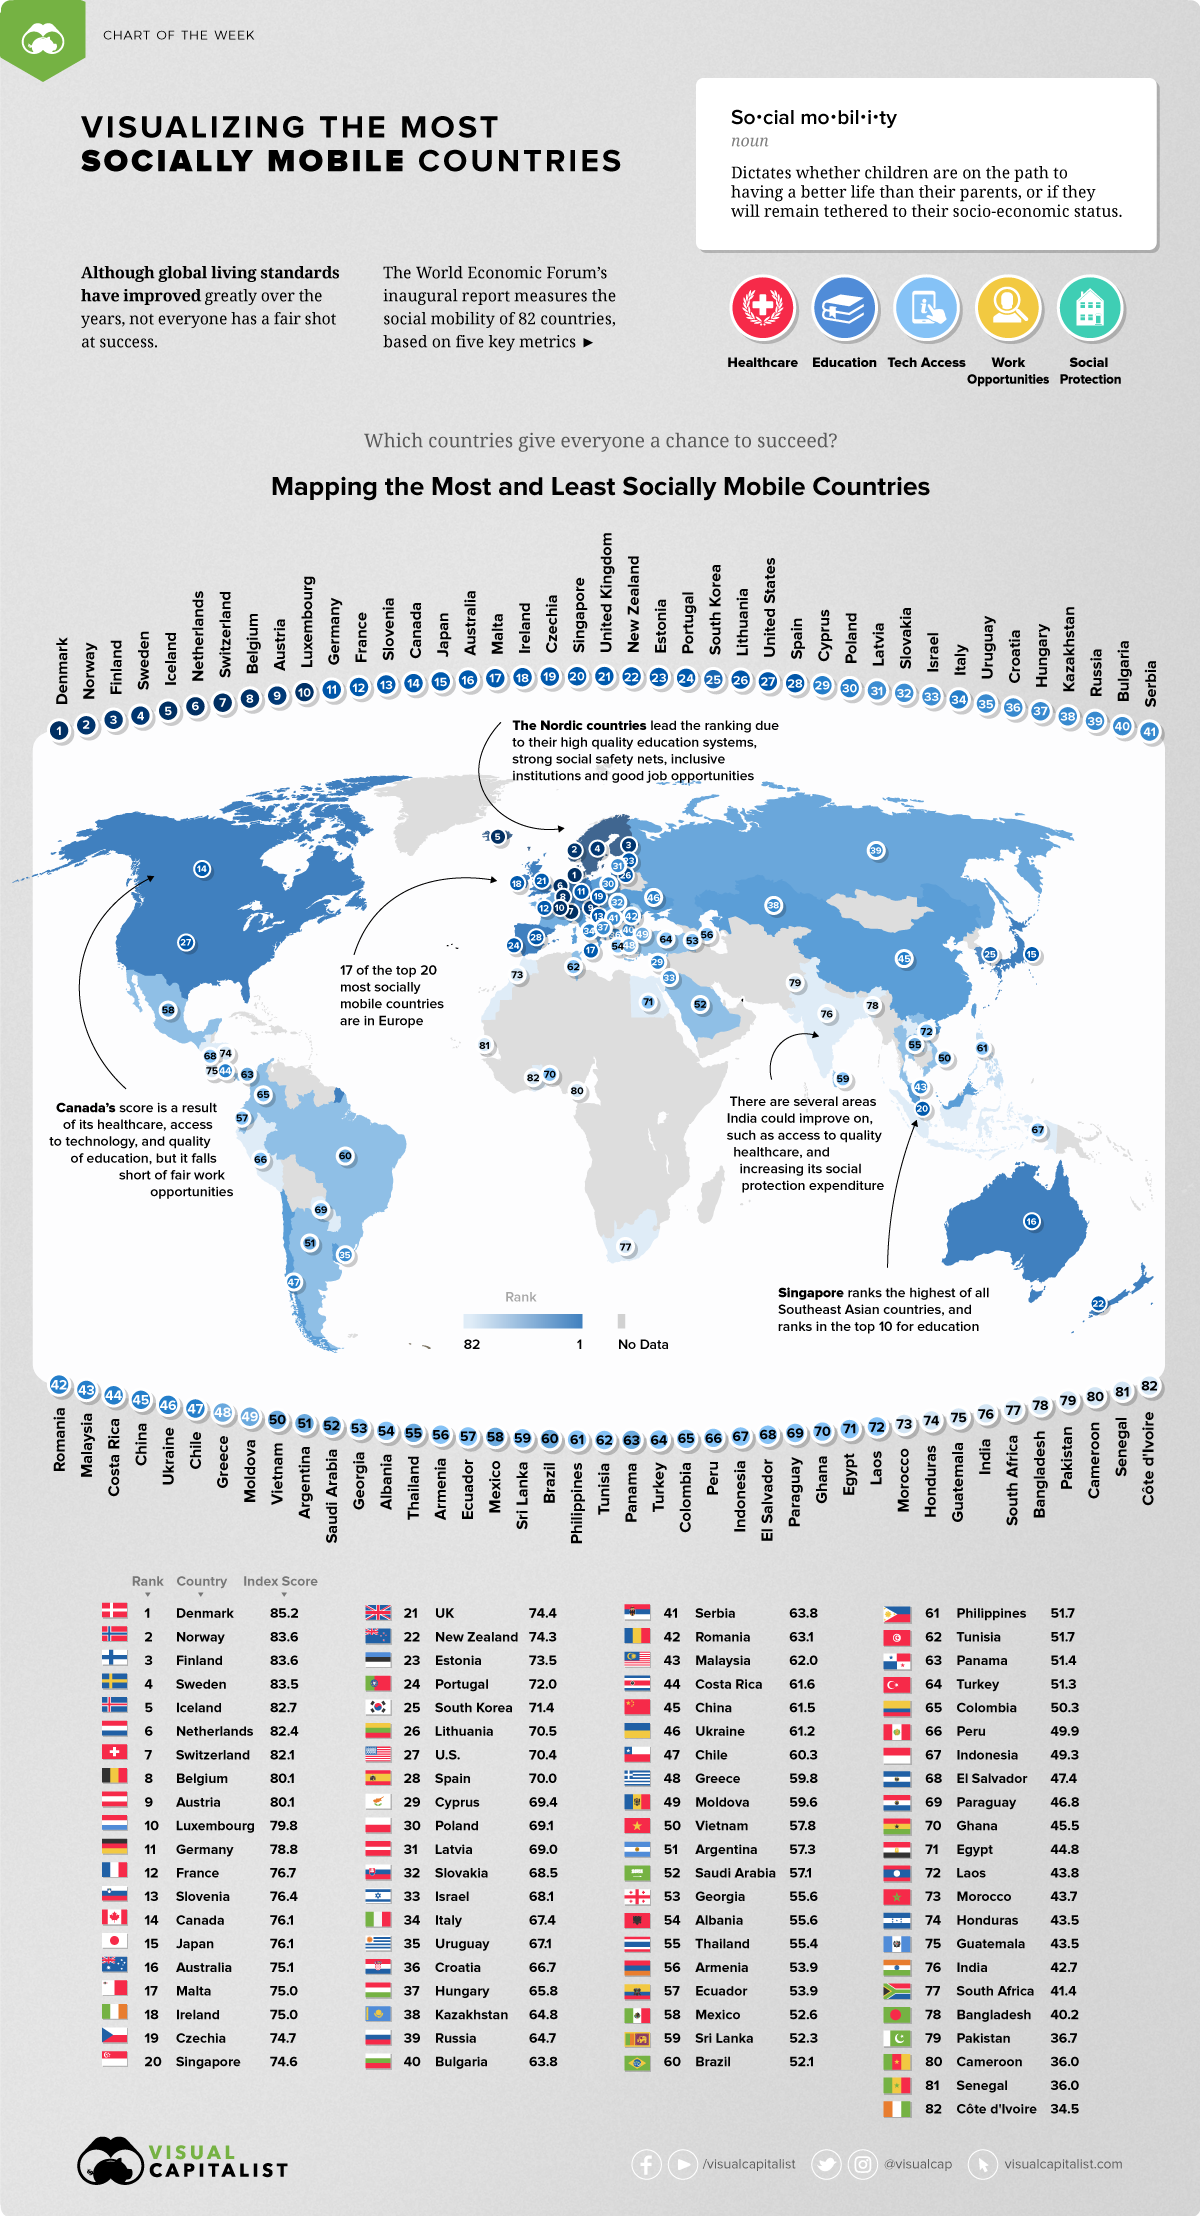
Today’s chart pulls data from the inaugural Global Social Mobility report produced by the World Economic Forum. The report ranks 82 countries according to their performance across five key pillars: healthcare, education, technology access, working conditions, and social protection.
While most countries aim to create a level playing field, which places best live up to this lofty and challenging mission?
The Spectrum of Social Mobility
Social mobility refers to the movement of individuals either up or down the socioeconomic ladder relative to their current standing, such as a low-income family moving up to become a part of the middle class.
Countries with high levels of social mobility exhibit lower levels of income inequality and provide more equally shared opportunities for its citizens across each of the five pillars.
Here is how all 82 countries rank, according to the report:
| Ranking | Countries | Index Score |
|---|---|---|
| #1 | Denmark | 85.2 |
| #2 | Norway | 83.6 |
| #3 | Finland | 83.6 |
| #4 | Sweden | 83.5 |
| #5 | Iceland | 82.7 |
| #6 | Netherlands | 82.4 |
| #7 | Switzerland | 82.1 |
| #8 | Belgium | 80.1 |
| #9 | Austria | 80.1 |
| #10 | Luxembourg | 79.8 |
| #11 | Germany | 78.8 |
| #12 | France | 76.7 |
| #13 | Slovenia | 76.4 |
| #14 | Canada | 76.1 |
| #15 | Japan | 76.1 |
| #16 | Australia | 75.1 |
| #17 | Malta | 75.0 |
| #18 | Ireland | 75.0 |
| #19 | Czech Republic | 74.7 |
| #20 | Singapore | 74.6 |
| #21 | United Kingdom | 74.4 |
| #22 | New Zealand | 74.3 |
| #23 | Estonia | 73.5 |
| #24 | Portugal | 72.0 |
| #25 | Korean Republic | 71.4 |
| #26 | Lithuania | 70.5 |
| #27 | United States | 70.4 |
| #28 | Spain | 70.0 |
| #29 | Cyprus | 69.4 |
| #30 | Poland | 69.1 |
| #31 | Latvia | 69.0 |
| #32 | Slovak Republic | 68.5 |
| #33 | Israel | 68.1 |
| #34 | Italy | 67.4 |
| #35 | Uruguay | 67.1 |
| #36 | Croatia | 66.7 |
| #37 | Hungary | 65.8 |
| #38 | Kazakhstan | 64.8 |
| #39 | Russian Federation | 64.7 |
| #40 | Bulgaria | 63.8 |
| #41 | Serbia | 63.8 |
| #42 | Romania | 63.1 |
| #43 | Malaysia | 62.0 |
| #44 | Costa Rica | 61.6 |
| #45 | China | 61.5 |
| #46 | Ukraine | 61.2 |
| #47 | Chile | 60.3 |
| #48 | Greece | 59.8 |
| #49 | Moldova | 59.6 |
| #50 | Vietnam | 57.8 |
| #51 | Argentina | 57.3 |
| #52 | Saudi Arabia | 57.1 |
| #53 | Georgia | 55.6 |
| #54 | Albania | 55.6 |
| #55 | Thailand | 55.4 |
| #56 | Armenia | 53.9 |
| #57 | Ecuador | 53.9 |
| #58 | Mexico | 52.6 |
| #59 | Sri Lanka | 52.3 |
| #60 | Brazil | 52.1 |
| #61 | Philippines | 51.7 |
| #62 | Tunisia | 51.7 |
| #63 | Panama | 51.4 |
| #64 | Turkey | 51.3 |
| #65 | Colombia | 50.3 |
| #66 | Peru | 49.9 |
| #67 | Indonesia | 49.3 |
| #68 | El Salvador | 47.4 |
| #69 | Paraguay | 46.8 |
| #70 | Ghana | 45.5 |
| #71 | Egypt | 44.8 |
| #72 | Laos | 43.8 |
| #73 | Morocco | 43.7 |
| #74 | Honduras | 43.5 |
| #75 | Guatemala | 43.5 |
| #76 | India | 42.7 |
| #77 | South Africa | 41.4 |
| #78 | Bangladesh | 40.2 |
| #79 | Pakistan | 36.7 |
| #80 | Cameroon | 36 |
| #81 | Senegal | 36.0 |
| #82 | Côte d’Ivoire | 34.5 |
There are a number of countries that set an example for social mobility that others can follow.
The Mobility Medal Winners
All of the countries in the top 10 are European, but it is the Nordic countries that sit comfortably at the top of the ranks.
Denmark holds the title for the most socially mobile country in the world, boasting an index score of 85.2. If a person is born into a low-income family in Denmark, the WEF estimates it would take two generations to reach a median income. In contrast, someone in Brazil or South Africa would take nine generations at the current pace of growth.
As one of the few non-European countries in the top 20, Canada also performs well across the majority of pillars, but similarly to Denmark, it could improve in the area of lifelong learning which includes providing support for the unemployed and teaching digital skills.
The Least Socially Mobile Countries
Developing country Côte d’Ivoire sits at the bottom of the ranks, with an index score of just 34.5. As a nation once ravaged by internal conflict and turbulent economic shifts, the resulting poverty rate remains high at 46.3%.
While the government has made improvements to its basic social services, the country falls behind on categories like access to education and fair wages, and retains the highest gender inequality rate in the world.
Despite a significant decrease in the percentage of people living in absolute poverty, India ranks low on the index in 76th place. Structural reform is required across all pillars if India is to increase its score, especially in relation to fair wages and education.
Why Invest in Social Mobility?
According to the report, most economies are far from providing fair conditions for their citizens to thrive, with the greatest challenges ranging from lack of social protection and low wages to poor lifelong learning systems.
Countries that fail to invest in the key pillars of social mobility could experience damaging consequences for governments and citizens alike:
- Precarity (the unpredictability of living without secure and well-paid employment)
- Perceived loss of identity and dignity
- Weakening social fabric
- Eroding trust in institutions
- Disenchantment with political processes
Aside from the social returns, the economic impact of investing in the right blend of social mobility pillars could be substantial.
Calculating the True Cost
The report dives into the opportunity cost of low social mobility and finds that if each country increased its score by just 10 index points, it could result in an extra 4.41% of cumulative GDP growth for the global economy by 2030—equal to $5.1 trillion.
China alone could add $1 trillion of GDP growth by 2030 if a 10 point increase is achieved:
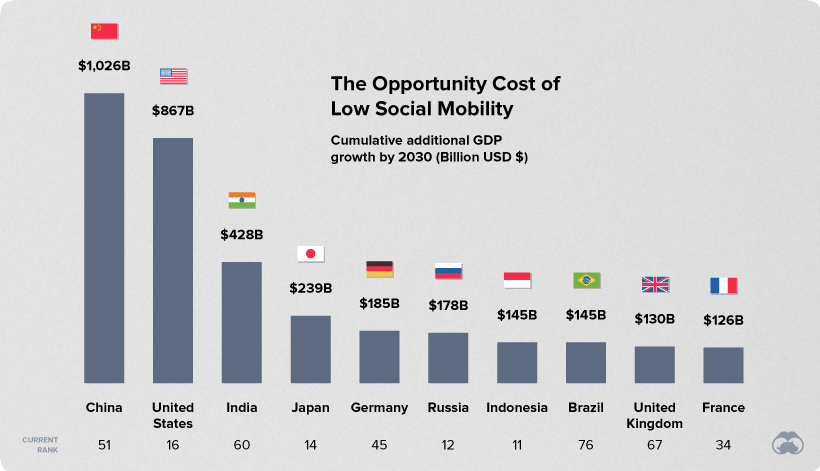
Although social mobility can act as an economic lever, many countries are struggling to provide the optimal conditions for their citizens to thrive. For those countries, globalization and technology may continue to exacerbate income inequality.
If countries are unable to create new social mobility pathways towards more inclusive economies, they risk being stuck in a cycle where inequality remains entrenched—and history continues to repeats itself.
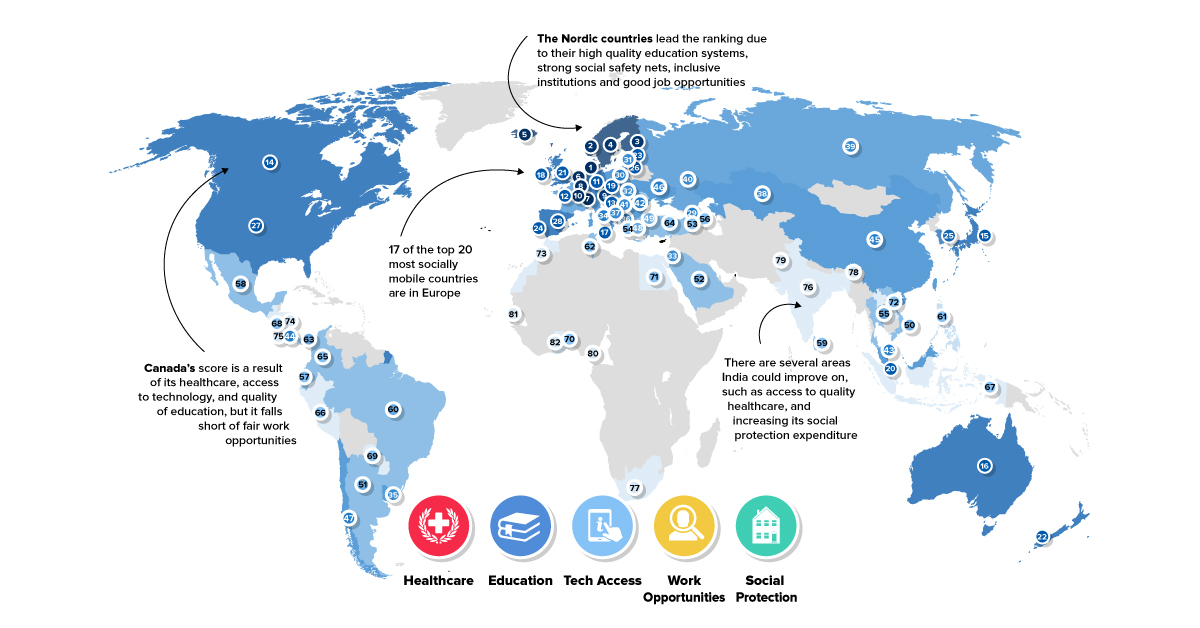


Chart of the Week
The Road to Recovery: Which Economies are Reopening?
We look at mobility rates as well as COVID-19 recovery rates for 41 economies, to see which countries are reopening for business.

The Road to Recovery: Which Economies are Reopening?
COVID-19 has brought the world to a halt—but after months of uncertainty, it seems that the situation is slowly taking a turn for the better.
Today’s chart measures the extent to which 41 major economies are reopening, by plotting two metrics for each country: the mobility rate and the COVID-19 recovery rate:
- Mobility Index
This refers to the change in activity around workplaces, subtracting activity around residences, measured as a percentage deviation from the baseline. - COVID-19 Recovery Rate
The number of recovered cases in a country is measured as the percentage of total cases.
Data for the first measure comes from Google’s COVID-19 Community Mobility Reports, which relies on aggregated, anonymous location history data from individuals. Note that China does not show up in the graphic as the government bans Google services.
COVID-19 recovery rates rely on values from CoronaTracker, using aggregated information from multiple global and governmental databases such as WHO and CDC.
Reopening Economies, One Step at a Time
In general, the higher the mobility rate, the more economic activity this signifies. In most cases, mobility rate also correlates with a higher rate of recovered people in the population.
Here’s how these countries fare based on the above metrics.
| Country | Mobility Rate | Recovery Rate | Total Cases | Total Recovered |
|---|---|---|---|---|
| Argentina | -56% | 31.40% | 14,702 | 4,617 |
| Australia | -41% | 92.03% | 7,150 | 6,580 |
| Austria | -100% | 91.93% | 16,628 | 15,286 |
| Belgium | -105% | 26.92% | 57,849 | 15,572 |
| Brazil | -48% | 44.02% | 438,812 | 193,181 |
| Canada | -67% | 52.91% | 88,512 | 46,831 |
| Chile | -110% | 41.58% | 86,943 | 36,150 |
| Colombia | -73% | 26.28% | 25,366 | 6,665 |
| Czechia | -29% | 70.68% | 9,140 | 6,460 |
| Denmark | -93% | 88.43% | 11,512 | 10,180 |
| Finland | -93% | 81.57% | 6,743 | 5,500 |
| France | -100% | 36.08% | 186,238 | 67,191 |
| Germany | -99% | 89.45% | 182,452 | 163,200 |
| Greece | -32% | 47.28% | 2,906 | 1,374 |
| Hong Kong | -10% | 97.00% | 1,067 | 1,035 |
| Hungary | -49% | 52.31% | 3,816 | 1,996 |
| India | -65% | 42.88% | 165,386 | 70,920 |
| Indonesia | -77% | 25.43% | 24,538 | 6,240 |
| Ireland | -79% | 88.92% | 24,841 | 22,089 |
| Israel | -31% | 87.00% | 16,872 | 14,679 |
| Italy | -52% | 64.99% | 231,732 | 150,604 |
| Japan | -33% | 84.80% | 16,683 | 14,147 |
| Malaysia | -53% | 80.86% | 7,629 | 6,169 |
| Mexico | -69% | 69.70% | 78,023 | 54,383 |
| Netherlands | -97% | 0.01% | 45,950 | 3 |
| New Zealand | -21% | 98.01% | 1,504 | 1,474 |
| Norway | -100% | 91.87% | 8,411 | 7,727 |
| Philippines | -87% | 23.08% | 15,588 | 3,598 |
| Poland | -36% | 46.27% | 22,825 | 10,560 |
| Portugal | -65% | 58.99% | 31,596 | 18,637 |
| Singapore | -105% | 55.02% | 33,249 | 18,294 |
| South Africa | -74% | 52.44% | 27,403 | 14,370 |
| South Korea | -4% | 91.15% | 11,344 | 10,340 |
| Spain | -67% | 69.11% | 284,986 | 196,958 |
| Sweden | -93% | 13.91% | 35,727 | 4,971 |
| Switzerland | -101% | 91.90% | 30,796 | 28,300 |
| Taiwan | 4% | 95.24% | 441 | 420 |
| Thailand | -36% | 96.08% | 3,065 | 2,945 |
| U.S. | -56% | 28.20% | 1,768,346 | 498,720 |
| United Kingdom | -82% | 0.05% | 269,127 | 135 |
| Vietnam | 15% | 85.02% | 327 | 278 |
Mobility data as of May 21, 2020 (Latest available). COVID-19 case data as of May 29, 2020.
In the main scatterplot visualization, we’ve taken things a step further, assigning these countries into four distinct quadrants:
1. High Mobility, High Recovery
High recovery rates are resulting in lifted restrictions for countries in this quadrant, and people are steadily returning to work.
New Zealand has earned praise for its early and effective pandemic response, allowing it to curtail the total number of cases. This has resulted in a 98% recovery rate, the highest of all countries. After almost 50 days of lockdown, the government is recommending a flexible four-day work week to boost the economy back up.
2. High Mobility, Low Recovery
Despite low COVID-19 related recoveries, mobility rates of countries in this quadrant remain higher than average. Some countries have loosened lockdown measures, while others did not have strict measures in place to begin with.
Brazil is an interesting case study to consider here. After deferring lockdown decisions to state and local levels, the country is now averaging the highest number of daily cases out of any country. On May 28th, for example, the country had 24,151 new cases and 1,067 new deaths.
3. Low Mobility, High Recovery
Countries in this quadrant are playing it safe, and holding off on reopening their economies until the population has fully recovered.
Italy, the once-epicenter for the crisis in Europe is understandably wary of cases rising back up to critical levels. As a result, it has opted to keep its activity to a minimum to try and boost the 65% recovery rate, even as it slowly emerges from over 10 weeks of lockdown.
4. Low Mobility, Low Recovery
Last but not least, people in these countries are cautiously remaining indoors as their governments continue to work on crisis response.
With a low 0.05% recovery rate, the United Kingdom has no immediate plans to reopen. A two-week lag time in reporting discharged patients from NHS services may also be contributing to this low number. Although new cases are leveling off, the country has the highest coronavirus-caused death toll across Europe.
The U.S. also sits in this quadrant with over 1.7 million cases and counting. Recently, some states have opted to ease restrictions on social and business activity, which could potentially result in case numbers climbing back up.
Over in Sweden, a controversial herd immunity strategy meant that the country continued business as usual amid the rest of Europe’s heightened regulations. Sweden’s COVID-19 recovery rate sits at only 13.9%, and the country’s -93% mobility rate implies that people have been taking their own precautions.
COVID-19’s Impact on the Future
It’s important to note that a “second wave” of new cases could upend plans to reopen economies. As countries reckon with these competing risks of health and economic activity, there is no clear answer around the right path to take.
COVID-19 is a catalyst for an entirely different future, but interestingly, it’s one that has been in the works for a while.
Without being melodramatic, COVID-19 is like the last nail in the coffin of globalization…The 2008-2009 crisis gave globalization a big hit, as did Brexit, as did the U.S.-China trade war, but COVID is taking it to a new level.
—Carmen Reinhart, incoming Chief Economist for the World Bank
Will there be any chance of returning to “normal” as we know it?

-

 Markets1 week ago
U.S. Debt Interest Payments Reach $1 Trillion
-

 Business2 weeks ago
Charted: Big Four Market Share by S&P 500 Audits
-

 Real Estate2 weeks ago
Ranked: The Most Valuable Housing Markets in America
-

 Money2 weeks ago
Which States Have the Highest Minimum Wage in America?
-

 AI2 weeks ago
Ranked: Semiconductor Companies by Industry Revenue Share
-

 Markets2 weeks ago
Ranked: The World’s Top Flight Routes, by Revenue
-

 Demographics2 weeks ago
Population Projections: The World’s 6 Largest Countries in 2075
-

 Markets2 weeks ago
The Top 10 States by Real GDP Growth in 2023