Ecommerce
A Very COVID Christmas: The Pandemic’s Impact on Festive Spending
View the full-resolution version of this infographic
The Pandemic’s Impact on Festive Spending
View the high-resolution of the infographic by clicking here.
From mass job losses to not seeing family and friends for months on end, the COVID-19 pandemic has pushed people to their limits in 2020.
As an incredibly difficult year draws to a close, people are starting to accept that this festive season will be anything but typical. But while a portion of consumers have reined in their spending due to financial uncertainty, others are spreading Christmas cheer by indulging in gifts for their loved ones.
The graphic above from Raconteur explores how consumers’ festive spending in the U.S. and UK has changed as a result of the ongoing pandemic.
Will the shift trigger permanent changes in the retail industry?
Festive Budget Breakdown
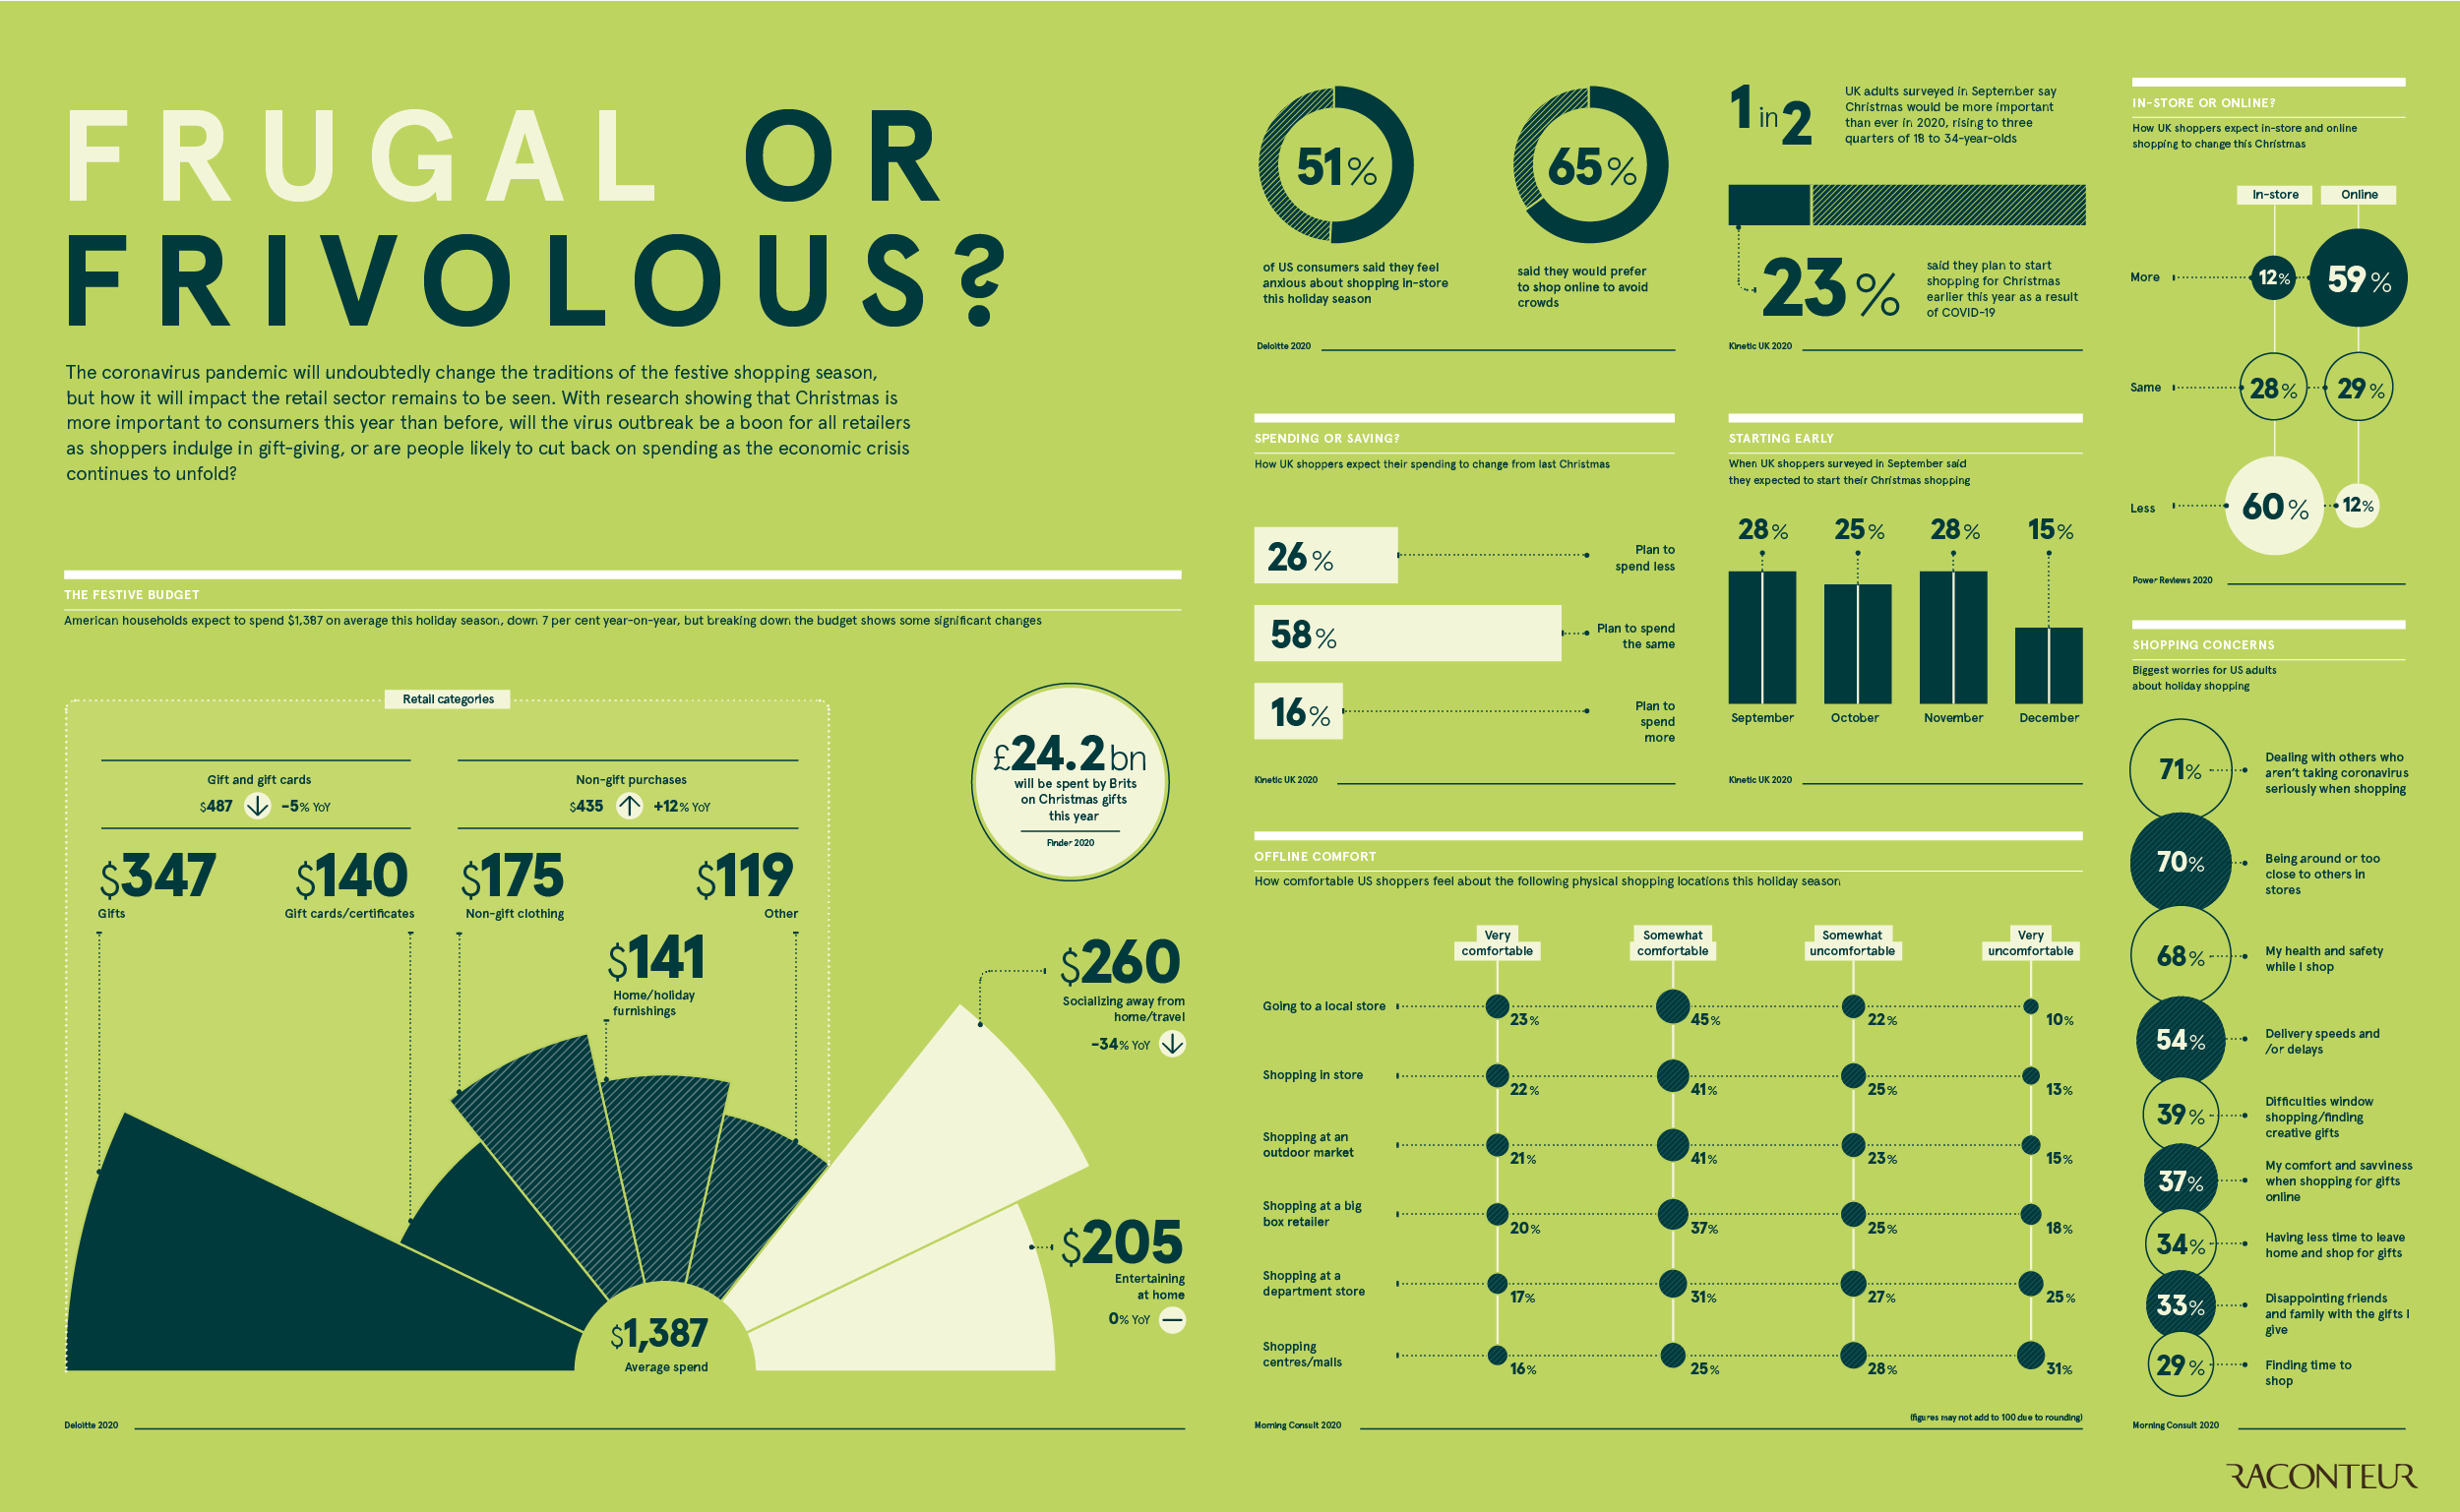
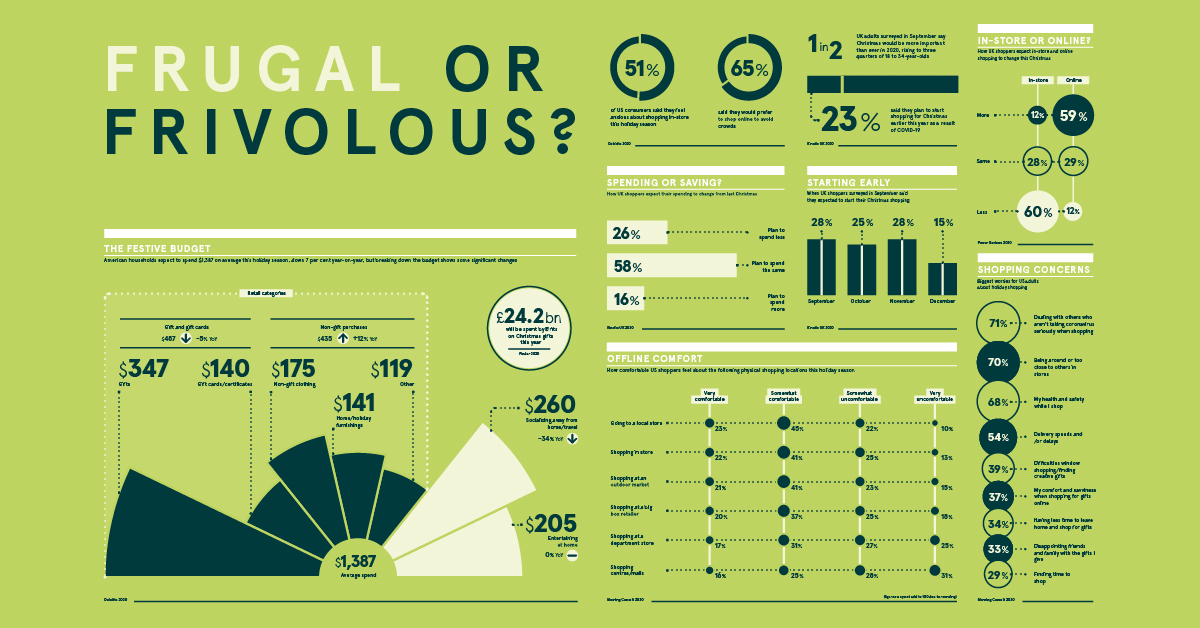
According creative agency Kinetic, half of all UK adults surveyed believe this Christmas is more important than ever before, with that figure rising to three quarters for 18-34 year olds.
However, given consumers’ concerns over the future of the economy, they are expected to reduce spending during the festive season. In the U.S. for example, spending will decline by 7% to $1,387 per household.
When it comes to how consumers plan to spend their hard-earned cash, some interesting insights emerge. As many have saved significantly on socializing and travel—which is down 34% year-on-year—they plan to put this money towards items for themselves instead of gifts and gift cards for others. These items include clothes, at-home entertainment, and home furnishings.
It therefore comes as little surprise that the global online home decor market is estimated to grow at a compound annual growth rate (CAGR) of almost 13% between 2020-2024 with revenue of over $80 billion.
Dampening the Christmas Spirit?
Unsurprisingly, over half of all U.S. consumers are anxious about shopping in-store this holiday season. The vast majority have health and safety concerns, with 71% being the most worried about dealing with others who aren’t taking the virus seriously. This is closely followed by being around, or too close to others in stores.
Therefore, when it comes to physical shopping, people feel more comfortable in local stores or at outdoor markets and much less so in shopping malls.
Safety in Online Shopping
Considering this change in mindset, almost 60% of UK consumers said that they will be shopping online more this Christmas.
Here’s a closer look at how they plan to shop differently during the 2020 holiday season:
| Shopping In-store | Shopping Online | |
|---|---|---|
| More | 12% | 59% |
| Same | 28% | 29% |
| Less | 60% | 12% |
But while ecommerce sales are expected to spike over Christmas, delivery speeds and shipping delays are also major concerns for consumers. As a result, many of them started their shopping much earlier this year to avoid disappointment. In fact, over half of all UK shoppers had started their Christmas shopping before November had even arrived.
Bidding Adieu to 2020
The end to a painful year for many can’t come soon enough. But boarded-up storefronts, and “for sale” signs serve as a harsh reminder of the fragility of the retail sector and its reliance on consumer sentiment.
Even as we march forward guided by the hope of an effective vaccine, the future of retail remains uncertain. For consumers, their confidence will build once more, but how they choose to spend their money following the festive season will be more important for businesses and the economy than ever before.


Technology
Ranked: The Top 100 Product Searches on Amazon
This graphic highlights the top product searches on Amazon in the U.S., providing a glimpse of what items American consumers are after.
What Products are People Searching for on Amazon?
When it comes to searching for products online, a majority of U.S. shoppers go directly to Amazon. Thanks to this widespread use, product searches on Amazon provide interesting insights into current consumer behavior, including what shoppers have been focusing on in 2020.
Today’s chart uses data from Ahrefs to showcase Amazon’s top 100 U.S. product searches. We’ll also dive into the most popular categories, as well as top keyword searches on a global basis.
Top 100 Amazon Product Searches in the U.S.
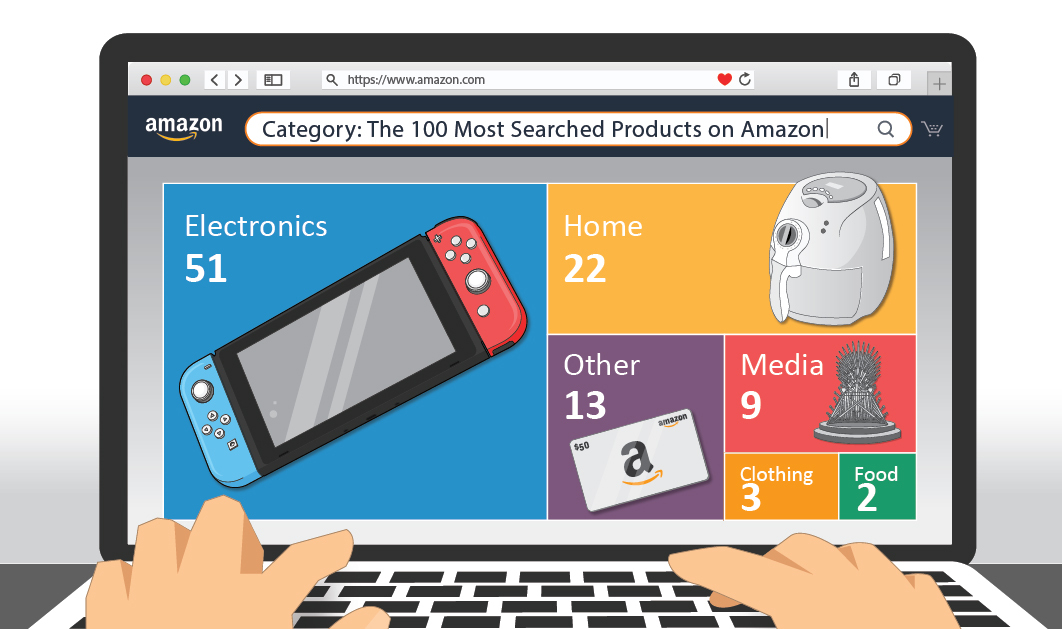
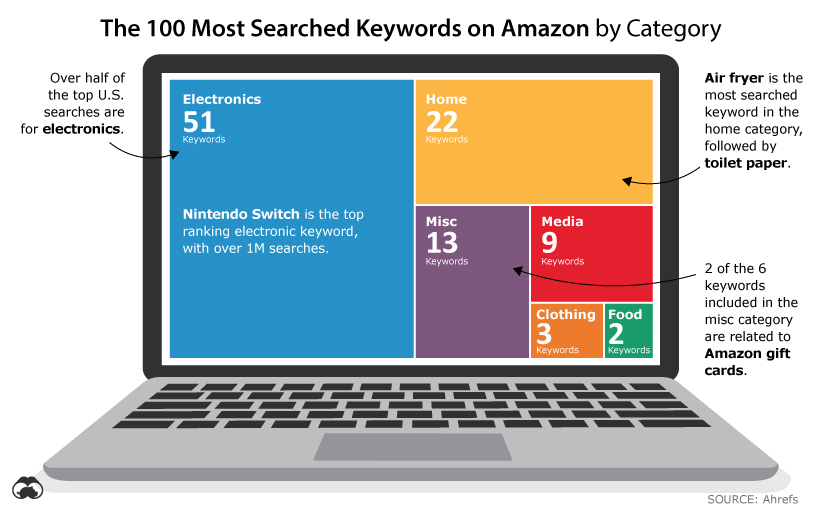
Out of the top 100 product searches on Amazon, over half are for electronics.
Nintendo Switch is the most searched product keyword, with approximately one million monthly searches. This makes sense, considering the console’s recent surge in popularity—in March 2020, U.S. sales of the Nintendo Switch more than doubled compared to a year prior.
Here’s a look at the full ranking of all product keywords, by monthly search volume:
| Rank | Keyword | Search Volume | Category |
|---|---|---|---|
| 1 | nintendo switch | 1,020,000 | Electronics |
| 2 | laptop | 892,000 | Electronics |
| 3 | airpods | 693,000 | Electronics |
| 4 | headphones | 641,000 | Electronics |
| 5 | wireless earbuds | 571,000 | Electronics |
| 6 | ipad | 565,000 | Electronics |
| 7 | game of thrones | 518,000 | Media |
| 8 | fire stick | 506,000 | Electronics |
| 9 | ssd | 496,000 | Electronics |
| 10 | fitbit | 481,000 | Electronics |
| 11 | kindle | 475,000 | Electronics |
| 12 | tv | 471,000 | Electronics |
| 13 | air fryer | 456,000 | Home |
| 14 | bluetooth headphones | 447,000 | Electronics |
| 15 | roku | 445,000 | Electronics |
| 16 | toilet paper | 422,000 | Home |
| 17 | external hard drive | 412,000 | Electronics |
| 18 | instant pot | 404,000 | Home |
| 19 | tablet | 403,000 | Electronics |
| 20 | micro sd card | 402,000 | Electronics |
| 21 | gaming chair | 392,000 | Home |
| 22 | apple watch | 388,000 | Electronics |
| 23 | monitor | 385,000 | Electronics |
| 24 | earbuds | 376,000 | Electronics |
| 25 | ps4 | 370,000 | Electronics |
| 26 | alexa | 362,000 | Electronics |
| 27 | paper towels | 357,000 | Home |
| 28 | desk | 349,000 | Home |
| 29 | office chair | 332,000 | Home |
| 30 | ring doorbell | 322,000 | Home |
| 31 | chromebook | 319,000 | Electronics |
| 32 | weighted blanket | 319,000 | Home |
| 33 | gift cards for amazon | 314,000 | Misc |
| 34 | water bottle | 314,000 | Home |
| 35 | backpack | 312,000 | Clothing |
| 36 | hdmi cable | 306,000 | Electronics |
| 37 | lego | 301,000 | Misc |
| 38 | wireless mouse | 301,000 | Electronics |
| 39 | mouse pad | 299,000 | Home |
| 40 | iphone charger | 287,000 | Electronics |
| 41 | bluetooth earbuds | 284,000 | Electronics |
| 42 | hydro flask | 282,000 | Home |
| 43 | echo dot | 277,000 | Electronics |
| 44 | gaming mouse | 276,000 | Electronics |
| 45 | gift card | 276,000 | Misc |
| 46 | switch | 275,000 | Electronics |
| 47 | printer | 272,000 | Electronics |
| 48 | nintendo switch games | 270,000 | Electronics |
| 49 | bluetooth speakers | 269,000 | Electronics |
| 50 | keyboard | 269,000 | Electronics |
| 51 | iphone | 262,000 | Electronics |
| 52 | coffee | 261,000 | Food |
| 53 | aa batteries | 257,000 | Misc |
| 54 | ps4 controller | 257,000 | Electronics |
| 55 | wireless headphones | 257,000 | Electronics |
| 56 | mouse | 256,000 | Electronics |
| 57 | shoes | 255,000 | Clothing |
| 58 | shower curtain | 255,000 | Home |
| 59 | amazon gift cards | 254,000 | Misc |
| 60 | the boys | 253,000 | Media |
| 61 | smart watch | 249,000 | Electronics |
| 62 | cbd oil | 248,000 | Misc |
| 63 | kindle fire | 247,000 | Electronics |
| 64 | led strip lights | 247,000 | Electronics |
| 65 | harry potter | 246,000 | Media |
| 66 | pop socket | 243,000 | Misc |
| 67 | sd card | 240,000 | Electronics |
| 68 | ring | 238,000 | Misc |
| 69 | xbox one controller | 238,000 | Electronics |
| 70 | doctor who | 237,000 | Media |
| 71 | microwave | 237,000 | Home |
| 72 | usb c cable | 236,000 | Electronics |
| 73 | good omens | 235,000 | Media |
| 74 | gaming laptop | 232,000 | Electronics |
| 75 | mattress | 232,000 | Home |
| 76 | prime video | 231,000 | Media |
| 77 | vacuum cleaner | 229,000 | Home |
| 78 | hbo | 224,000 | Media |
| 79 | iphone xr cases | 222,000 | Misc |
| 80 | computer desk | 216,000 | Home |
| 81 | protein powder | 216,000 | Food |
| 82 | socks | 213,000 | Clothing |
| 83 | avengers endgame | 211,000 | Media |
| 84 | echo | 209,000 | Electronics |
| 85 | books | 207,000 | Misc |
| 86 | shoe rack | 205,000 | Home |
| 87 | tv stand | 203,000 | Home |
| 88 | yoga mat | 203,000 | Home |
| 89 | aaa batteries | 202,000 | Misc |
| 90 | computer monitor | 202,000 | Electronics |
| 91 | gaming headset | 202,000 | Misc |
| 92 | blender | 200,000 | Home |
| 93 | dash cam | 197,000 | Electronics |
| 94 | gaming pc | 197,000 | Electronics |
| 95 | luggage | 196,000 | Home |
| 96 | usb hub | 196,000 | Electronics |
| 97 | camera | 195,000 | Electronics |
| 98 | iphone 11 case | 195,000 | Misc |
| 99 | pokemon | 195,000 | Media |
| 100 | projector | 194,000 | Electronics |
Two different Apple products make the top 10—Airpods and iPad. It’s interesting that Airpods and iPads have their own search term distinctive from their broader categories (wireless headphones and tablets), demonstrating Apple’s strong brand recognition in America.
Of course, Apple is also dominant in the personal tech market more broadly. For instance, iPhones make up 46% of the U.S. smartphone market by number of devices sold.
Top 100 Amazon Product Searches Globally
Like the U.S. top searches, Nintendo Switch comes in at number one worldwide, with over 2 million approximate monthly searches.
| Rank | Keyword | Search Volume | Category |
|---|---|---|---|
| 1 | nintendo switch | 2,520,000 | Electronics |
| 2 | laptop | 1,990,000 | Electronics |
| 3 | ssd | 1,780,000 | Electronics |
| 4 | kindle | 1,420,000 | Electronics |
| 5 | ps4 | 1,420,000 | Electronics |
| 6 | airpods | 1,350,000 | Electronics |
| 7 | ipad | 1,290,000 | Electronics |
| 8 | tablet | 1,150,000 | Electronics |
| 9 | iphone | 1,140,000 | Electronics |
| 10 | alexa | 1,120,000 | Electronics |
| 11 | headphones | 1,110,000 | Electronics |
| 12 | game of thrones | 1,040,000 | Media |
| 13 | lego | 1,020,000 | Misc |
| 14 | switch | 955,000 | Electronics |
| 15 | fitbit | 910,000 | Electronics |
| 16 | tv | 905,000 | Electronics |
| 17 | harry potter | 859,000 | Media |
| 18 | xiaomi | 836,000 | Electronics |
| 19 | monitor | 795,000 | Electronics |
| 20 | apple watch | 703,000 | Electronics |
| 21 | iphone 7 | 691,000 | Electronics |
| 22 | wireless earbuds | 687,000 | Electronics |
| 23 | iphone x | 670,000 | Electronics |
| 24 | fire stick | 664,000 | Electronics |
| 25 | bluetooth headphones | 655,000 | Electronics |
| 26 | samsung | 611,000 | Electronics |
| 27 | iphone 8 | 606,000 | Electronics |
| 28 | iphone xr | 606,000 | Electronics |
| 29 | mouse | 577,000 | Electronics |
| 30 | micro sd card | 576,000 | Electronics |
| 31 | gaming chair | 574,000 | Home |
| 32 | air fryer | 567,000 | Home |
| 33 | echo dot | 560,000 | Electronics |
| 34 | smart watch | 547,000 | Electronics |
| 35 | smartphone | 545,000 | Electronics |
| 36 | external hard drive | 526,000 | Electronics |
| 37 | instant pot | 516,000 | Home |
| 38 | roku | 514,000 | Electronics |
| 39 | star wars | 512,000 | Media |
| 40 | ps4 controller | 508,000 | Electronics |
| 41 | water bottle | 507,000 | Home |
| 42 | keyboard | 499,000 | Electronics |
| 43 | chromebook | 491,000 | Electronics |
| 44 | huawei | 490,000 | Electronics |
| 45 | gaming mouse | 484,000 | Electronics |
| 46 | pokemon | 483,000 | Media |
| 47 | shoes | 479,000 | Clothing |
| 48 | backpack | 473,000 | Clothing |
| 49 | playstation 4 | 472,000 | Electronics |
| 50 | earbuds | 471,000 | Electronics |
| 51 | echo | 467,000 | Electronics |
| 52 | toilet paper | 467,000 | Home |
| 53 | smartwatch | 461,000 | Electronics |
| 54 | notebook | 459,000 | Electronics |
| 55 | iphone 11 | 454,000 | Electronics |
| 56 | power bank | 454,000 | Electronics |
| 57 | xbox one | 452,000 | Electronics |
| 58 | wireless mouse | 450,000 | Electronics |
| 59 | gaming pc | 449,000 | Electronics |
| 60 | desk | 443,000 | Home |
| 61 | office chair | 442,000 | Home |
| 62 | mouse pad | 439,000 | Home |
| 63 | redmi note 7 | 433,000 | Electronics |
| 64 | printer | 431,000 | Electronics |
| 65 | chromecast | 430,000 | Electronics |
| 66 | gaming laptop | 429,000 | Electronics |
| 67 | hdmi cable | 422,000 | Electronics |
| 68 | earphones | 421,000 | Electronics |
| 69 | wireless headphones | 420,000 | Electronics |
| 70 | drone | 415,000 | Electronics |
| 71 | books | 408,000 | Misc |
| 72 | funko pop | 406,000 | Misc |
| 73 | nintendo switch games | 402,000 | Electronics |
| 74 | amazon | 400,000 | Misc |
| 75 | camera | 398,000 | Electronics |
| 76 | gift card | 396,000 | Misc |
| 77 | sd card | 396,000 | Electronics |
| 78 | xbox one controller | 392,000 | Electronics |
| 79 | ps4 games | 388,000 | Electronics |
| 80 | rtx 2060 | 387,000 | Electronics |
| 81 | laptops | 385,000 | Electronics |
| 82 | ring doorbell | 383,000 | Home |
| 83 | ipad pro | 381,000 | Electronics |
| 84 | ps4 pro | 378,000 | Electronics |
| 85 | gopro | 375,000 | Electronics |
| 86 | the boys | 375,000 | Media |
| 87 | bluetooth earbuds | 369,000 | Electronics |
| 88 | weighted blanket | 368,000 | Home |
| 89 | windows 10 | 368,000 | Electronics |
| 90 | paper towels | 367,000 | Home |
| 91 | avengers endgame | 366,000 | Media |
| 92 | lego star wars | 362,000 | Misc |
| 93 | xiaomi redmi note 7 | 362,000 | Electronics |
| 94 | microwave | 361,000 | Home |
| 95 | bluetooth speakers | 360,000 | Electronics |
| 96 | good omens | 357,000 | Media |
| 97 | coffee | 356,000 | Food |
| 98 | nike | 356,000 | Clothing |
| 99 | projector | 355,000 | Electronics |
| 100 | vans | 355,000 | Clothing |
Interestingly, three different Apple products appear in the top 10 global searches—Airpods, iPad, and iPhone. Additionally, a couple of older iPhone models make the overall ranking—iPhone 7 comes in at 21st place, and iPhone 8 takes the 28th spot.
On the U.S. list, these older iPhone models don’t even make the top 100.
Keyword Category Rankings
When it comes to top-ranking keywords, the electronics category appears to be the most important to Americans. Over half the U.S. top product searches fall under electronics, with the home category in second place.
Here’s a look at the full U.S. category breakdown:
Interestingly, when comparing the order of categories in the U.S versus worldwide, the sections remain mostly the same:
| Category | # of U.S. Keywords | # of Global Keywords |
|---|---|---|
| Electronics | 51 | 70 |
| Home | 22 | 12 |
| Media | 9 | 7 |
| Misc | 13 | 6 |
| Clothing | 3 | 4 |
| Food | 2 | 1 |
Like the U.S., electronics comes in at number one worldwide. However, it’s an even larger portion for the global ranking—70 keyword searches on the global list are for electronics.
The home category is more popular in the U.S. than across the globe, with 22 in the U.S. versus 12 worldwide. In America, air fryer is the most popular keyword search under this section—possibly because people were looking for a quick way to make their meals while they were busy playing Animal Crossing on their Switches.
The second most popular U.S. keyword under the home category is toilet paper. Considering the toilet paper shortages in the spring of 2020, this makes sense, as stores began limiting the number of rolls a person could purchase.
What Will 2021 Bring?
Based on the top 100 list, both globally and in the U.S., it’s clear that when searching on Amazon, a majority of consumers are looking for electronics.
However, the specific electronics they’re searching for (such as iPhones and Nintendo Switches), helps to provide some context around the products people are interested in, as well as the particular brands that are currently on everyone’s radar.
Will the Switch get switched out of the top spot in 2021? Because electronics tend to update so frequently, it’s very possible.

-

 Debt1 week ago
How Debt-to-GDP Ratios Have Changed Since 2000
-

 Demographics2 weeks ago
Population Projections: The World’s 6 Largest Countries in 2075
-

 Markets2 weeks ago
The Top 10 States by Real GDP Growth in 2023
-

 Demographics2 weeks ago
The Smallest Gender Wage Gaps in OECD Countries
-

 Economy2 weeks ago
Where U.S. Inflation Hit the Hardest in March 2024
-

 Green2 weeks ago
Top Countries By Forest Growth Since 2001
-

 United States2 weeks ago
Ranked: The Largest U.S. Corporations by Number of Employees
-

 Maps2 weeks ago
The Largest Earthquakes in the New York Area (1970-2024)