Money
Mapped: The Risk of Eviction and Foreclosure in U.S. States
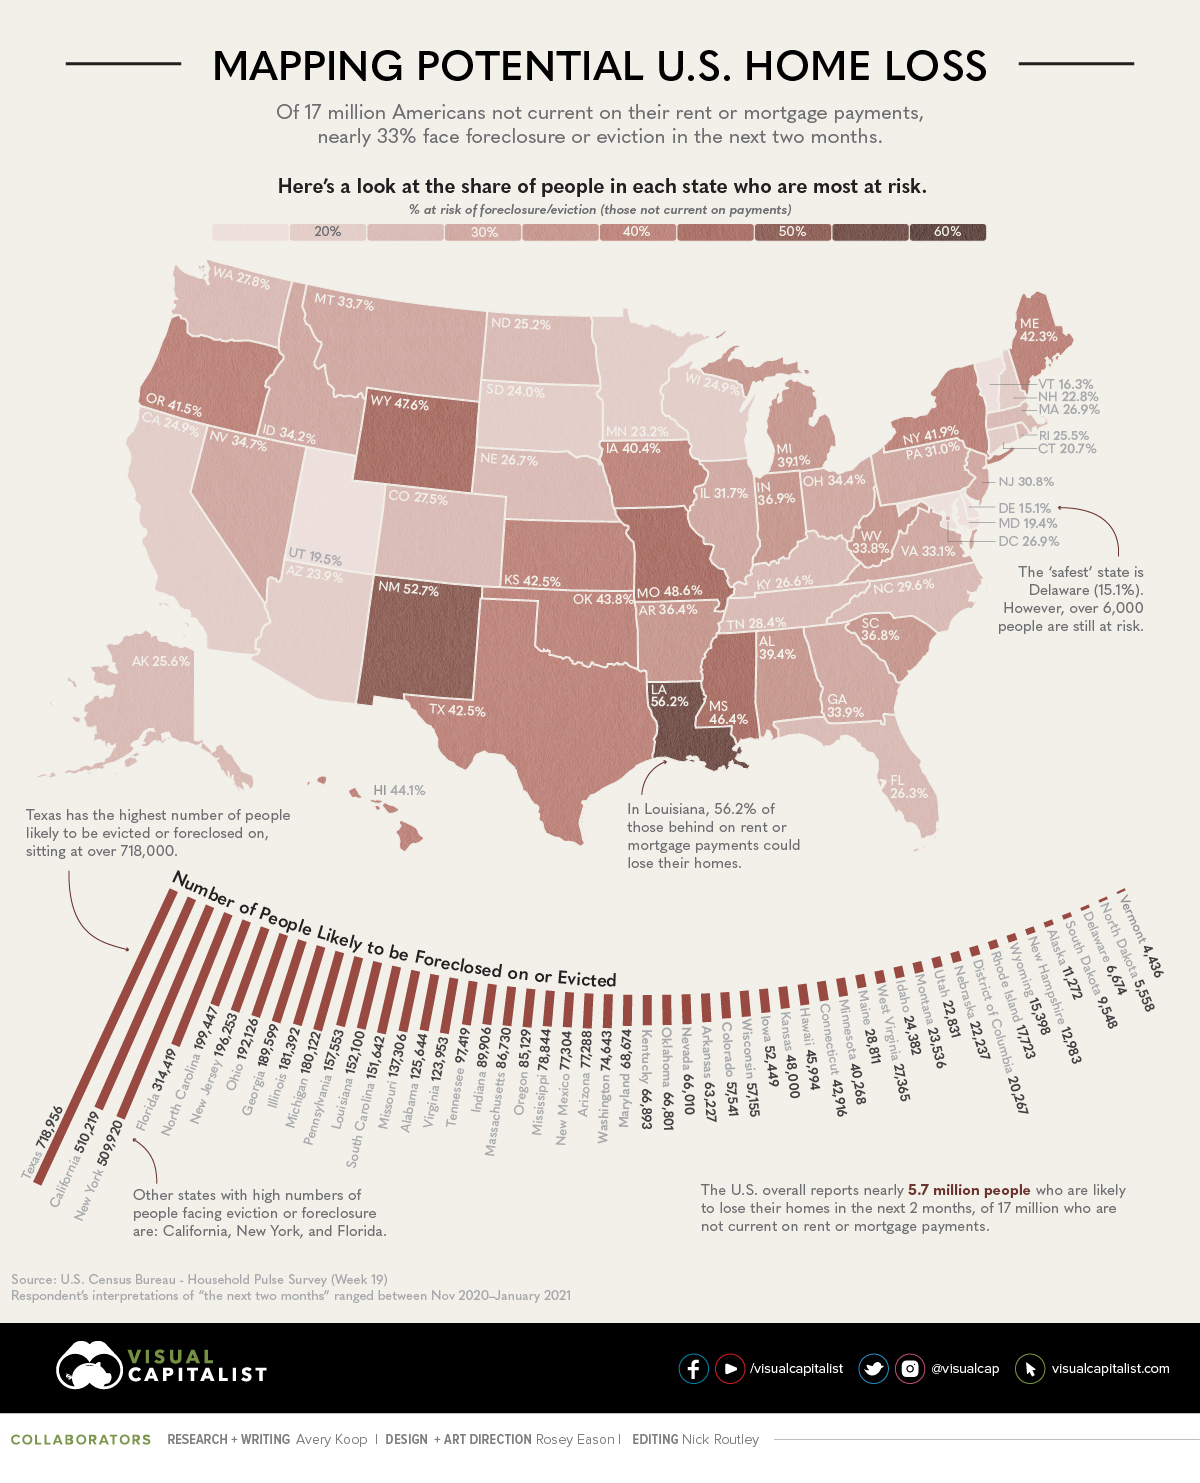
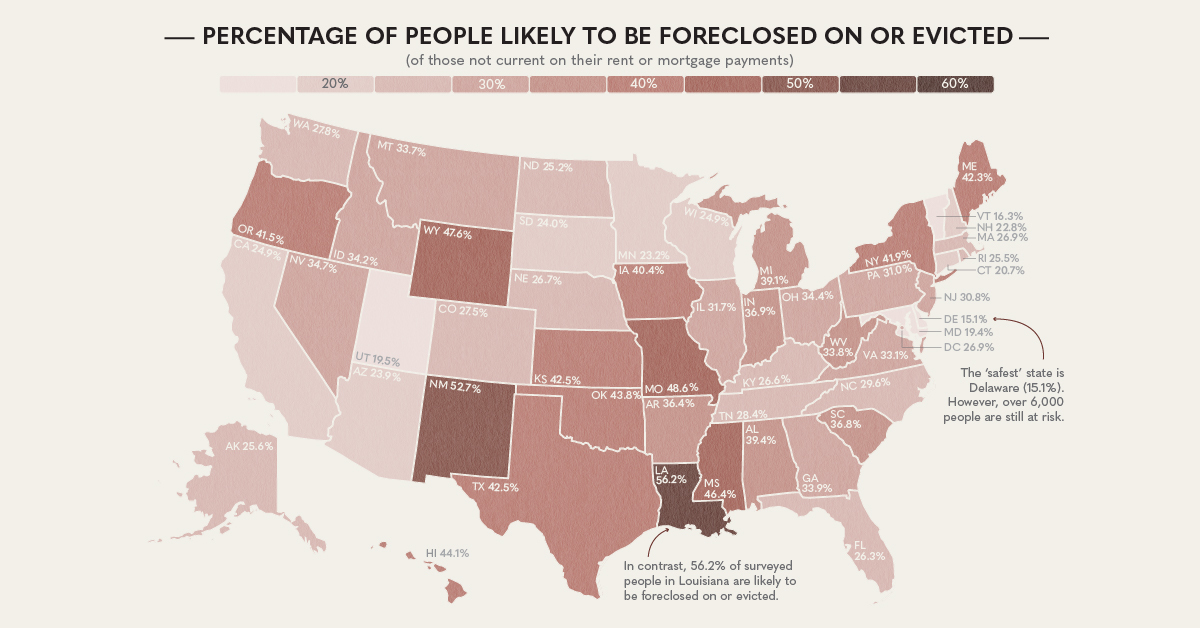
Mapping the Risk of Eviction and Foreclosure in U.S. States
Alongside potential obstacles such as job loss, financial insecurity, and a subsequent inability to cover many upcoming bills, many Americans are now facing potential home loss as well.
According to a recent survey by the U.S. Census Bureau, of the estimated 17 million adults who are not current on their rent or mortgage payments, a whopping 33% of them could be facing eviction or foreclosure in the “next two months”.
Note: While this survey was conducted Nov 11-23, 2020, respondents’ interpretations of “the next two months” ranged between Nov 2020–Jan 2021.
Millions Facing Home Loss
Although people across the country face similar risks, Texas stands out with an estimated 718,000 people facing foreclosures or eviction. In fact, more than 7.1 million people in the state may be expecting a loss of employment income in the coming four weeks.
Other states looking at high percentages of potential home loss include Louisiana, New Mexico, Mississippi, Wyoming, and Missouri.
To get a closer look, here are the top 10 metro areas with the highest percentages of people who will potentially be facing eviction or foreclosure:
Rank | Area | Number | Percent |
---|---|---|---|
1 | Houston-The Woodlands-Sugar Land, TX Metro Area | 265,454 | 47.6% |
2 | Miami-Fort Lauderdale-Pompano Beach, FL Metro Area | 147,830 | 34.1% |
3 | Atlanta-Sandy Springs-Alpharetta, GA Metro Area | 96,514 | 33.8% |
4 | Chicago-Naperville-Elgin, IL-IN-WI Metro Area | 184,381 | 33.3% |
5 | Dallas-Fort Worth-Arlington, TX Metro Area | 157,986 | 32.8% |
6 | Seattle-Tacoma-Bellevue, WA Metro Area | 52,959 | 32.5% |
7 | Detroit-Warren-Dearborn, MI Metro Area | 75,379 | 32.3% |
8 | New York-Newark-Jersey City, NY-NJ-PA Metro Area | 389,352 | 32.0% |
9 | San Francisco-Oakland-Berkeley, CA Metro Area | 61,647 | 31.1% |
10 | Phoenix-Mesa-Chandler, AZ Metro Area | 67,287 | 30.0% |
Note: The margin of error of the survey is higher in metro areas and smaller states.
Home for the Holidays?
On the other end of the spectrum, there are states that appear to have less need for concern, as the percentage of people likely to experience foreclosure or eviction in these places stands between 15% and 20%. However, this level of relative home security is the case for only Delaware, Vermont, Maryland, and Utah.
Everyone else is floating in a proverbial gray area, between a majority who may still be in their same home after Christmas, and those who may need to find a new place in the months following the holidays.
Even in the states with extremely low percentages like Delaware (15%), there are still thousands people who are highly likely to face the possibility of losing their home.
Going Forward
It goes without saying that with nearly 17 million Americans behind on mortgage and rent payments, there could be significant consequences down the road.
In an order issued by the CDC under the Public Health Service Act, it was stated that an eviction moratorium could help with the effectiveness of COVID-19 prevention measures like quarantining, social distancing, and self-isolation. However, while evictions were temporarily halted under this order on September 4th, the extent of this protection runs out on the last day of 2020.
President-elect Joe Biden expressed his desire for measures such as rent forgiveness back in March 2020, but it remains unclear what actions will be taken under the new administration when inauguration occurs on January 20th, 2021.
Money
Animated Chart: Remittance Flows and GDP Impact By Country
Which countries rely on remittance flows the most? This animation shows the amount of remittance income that countries received in 2022.

Visualizing Remittance Flows and GDP Impact By Country
The COVID-19 pandemic slowed down the flow of global immigration by 27%. Alongside it, travel restrictions, job losses, and mounting health concerns meant that many migrant workers couldn’t send money in the form of remittances back to families in their home countries.
This flow of remittances received by countries dropped by 1.5% to $711 billion globally in 2020. But over the next two years, things quickly turned back around.
As visa approvals restarted and international borders opened, so did international migration and global remittance flows. In 2021, total global remittances were estimated at $781 billion and have further risen to $794 billion in 2022.
In these images, Richie Lionell uses the World Bank’s KNOMAD data to visualize this increasing flow of money across international borders in 176 countries.
Why Do Remittances Matter?
Remittances contribute to the economy of nations worldwide, especially low and middle-income countries (LMICs).
They have been shown to help alleviate poverty, improve nutrition, and even increase school enrollment rates in these nations. Research has also found that these inflows of income can help recipient households become resilient, especially in the face of disasters.
At the same time, it’s worth noting that these transfers aren’t a silver bullet for recipient nations. In fact, some research shows that overreliance on remittances can cause a vicious cycle that doesn’t translate to consistent economic growth over time.
Countries Receiving the Highest Remittances
For the past 15 years, India has consistently topped the chart of the largest remittance beneficiaries.
Rank | Remittance Inflows by Country | 2022 (USD) |
---|---|---|
1 | India | $100,000M |
2 | Mexico | $60,300M |
3 | China | $51,000M |
4 | Philippines | $38,000M |
5 | Egypt, Arab Rep. | $32,337M |
6 | Pakistan | $29,000M |
7 | France | $28,520M |
8 | Bangladesh | $21,000M |
9 | Nigeria | $20,945M |
10 | Vietnam | $19,000M |
11 | Ukraine | $18,421M |
12 | Guatemala | $18,112M |
13 | Germany | $18,000M |
14 | Belgium | $13,500M |
15 | Uzbekistan | $13,500M |
16 | Morocco | $11,401M |
17 | Romania | $11,064M |
18 | Dominican Republic | $9,920M |
19 | Indonesia | $9,700M |
20 | Thailand | $9,500M |
21 | Colombia | $9,133M |
22 | Italy | $9,000M |
23 | Nepal | $8,500M |
24 | Spain | $8,500M |
25 | Honduras | $8,284M |
26 | Poland | $8,000M |
27 | Korea, Rep. | $7,877M |
28 | El Salvador | $7,620M |
29 | Lebanon | $6,841M |
30 | Israel | $6,143M |
31 | United States | $6,097M |
32 | Russian Federation | $6,000M |
33 | Serbia | $5,400M |
34 | Brazil | $5,045M |
35 | Japan | $5,000M |
36 | Portugal | $4,694M |
37 | Ghana | $4,664M |
38 | Jordan | $4,646M |
39 | Czech Republic | $4,539M |
40 | Haiti | $4,532M |
41 | Ecuador | $4,468M |
42 | Georgia | $4,100M |
43 | Kenya | $4,091M |
44 | Croatia | $3,701M |
45 | Peru | $3,699M |
46 | Sri Lanka | $3,600M |
47 | West Bank and Gaza | $3,495M |
48 | Jamaica | $3,419M |
49 | Armenia | $3,350M |
50 | Tajikistan | $3,200M |
51 | Nicaragua | $3,126M |
52 | Kyrgyz Republic | $3,050M |
53 | Senegal | $2,711M |
54 | Austria | $2,700M |
55 | Switzerland | $2,631M |
56 | Sweden | $2,565M |
57 | United Kingdom | $2,501M |
58 | Hungary | $2,404M |
59 | Bosnia and Herzegovina | $2,400M |
60 | Slovak Republic | $2,300M |
61 | Moldova | $2,170M |
62 | Azerbaijan | $2,150M |
63 | Tunisia | $2,085M |
64 | Zimbabwe | $2,047M |
65 | Luxembourg | $2,000M |
66 | Netherlands | $2,000M |
67 | Myanmar | $1,900M |
68 | Algeria | $1,829M |
69 | Albania | $1,800M |
70 | Somalia | $1735M |
71 | Congo, Dem. Rep. | $1,664M |
72 | Malaysia | $1,620M |
73 | Kosovo | $1,600M |
74 | Denmark | $1,517M |
75 | Latvia | $1,500M |
76 | Bolivia | $1,403M |
77 | Belarus | $1,350M |
78 | Cambodia | $1,250M |
79 | Bermuda | $1,200M |
80 | South Sudan | $1,187M |
81 | Uganda | $1,131M |
82 | Mali | $1,094M |
83 | South Africa | $1,019M |
84 | Sudan | $1,013M |
85 | Argentina | $966M |
86 | Montenegro | $920M |
87 | Finland | $880M |
88 | Bulgaria | $850M |
89 | Slovenia | $800M |
90 | Australia | $737M |
91 | Madagascar | $718M |
92 | Turkey | $710M |
93 | Canada | $700M |
94 | Lithuania | $700M |
95 | Togo | $668M |
96 | Greece | $665M |
97 | Costa Rica | $654M |
98 | Estonia | $626M |
99 | Qatar | $624M |
100 | Iraq | $624M |
101 | Gambia, The | $615M |
102 | Tanzania | $609M |
103 | Norway | $600M |
104 | Panama | $596M |
105 | Burkina Faso | $589M |
106 | Hong Kong SAR, China | $571M |
107 | Paraguay | $554M |
108 | Mozambique | $545M |
109 | Niger | $534M |
110 | Cyprus | $527M |
111 | Lesotho | $527M |
112 | Mongolia | $500M |
113 | Rwanda | $469M |
114 | Fiji | $450M |
115 | North Macedonia | $450M |
116 | Guyana | $400M |
117 | Cabo Verde | $375M |
118 | Kazakhstan | $370M |
119 | Cameroon | $365M |
120 | Cote d'Ivoire | $360M |
121 | Liberia | $351M |
122 | Afghanistan | $350M |
123 | Ethiopia | $327M |
124 | Samoa | $280M |
125 | Mauritius | $279M |
126 | Saudi Arabia | $273M |
127 | Malta | $271M |
128 | Malawi | $267M |
129 | Zambia | $260M |
130 | Tonga | $250M |
131 | Comoros | $250M |
132 | Ireland | $249M |
133 | Suriname | $221M |
134 | Benin | $209M |
135 | Lao PDR | $200M |
136 | Timor-Leste | $185M |
137 | Sierra Leone | $179M |
138 | Guinea-Bissau | $178M |
139 | Trinidad and Tobago | $172M |
140 | Mauritania | $168M |
141 | Iceland | $164M |
142 | Eswatini | $148M |
143 | Belize | $142M |
144 | Curacao | $131M |
145 | Uruguay | $127M |
146 | Chile | $78M |
147 | Vanuatu | $75M |
148 | St. Vincent and the Grenadines | $70M |
149 | Grenada | $69M |
150 | Botswana | $56M |
151 | St. Lucia | $55M |
152 | Bhutan | $55M |
153 | Djibouti | $55M |
154 | Dominica | $52M |
155 | Burundi | $50M |
156 | Aruba | $44M |
157 | Namibia | $44M |
158 | Guinea | $41M |
159 | Solomon Islands | $40M |
160 | Oman | $39M |
161 | Antigua and Barbuda | $35M |
162 | St. Kitts and Nevis | $33M |
163 | Marshall Islands | $30M |
164 | Kuwait | $27M |
165 | New Zealand | $25M |
166 | Macao SAR, China | $17M |
167 | Angola | $16M |
168 | Kiribati | $15M |
169 | Cayman Islands | $14M |
170 | Sao Tome and Principe | $10M |
171 | Seychelles | $9M |
172 | Maldives | $5M |
173 | Gabon | $4M |
174 | Palau | $2M |
175 | Papua New Guinea | $2M |
176 | Turkmenistan | $1M |
Total | World | $794,059M |
With an estimated $100 billion in remittances received, India is said to have reached an all-time high in 2022.
This increasing flow of remittances can be partially attributed to migrant Indians switching to high-skilled jobs in high-income countries—including the U.S., the UK, and Singapore—from low-skilled and low-paying jobs in Gulf countries.
Mexico and China round out the top three remittance-receiving nations, with estimated inbound transfers of $60 billion and $51 billion respectively in 2022.
Impact on National GDP
While India tops the list of countries benefitting from remittances, its $100 billion received amounts to only 2.9% of its 2022 GDP.
Meanwhile, low and middle-income countries around the world heavily rely on this source of income to boost their economies in a more substantive way. In 2022, for example, remittances accounted for over 15% of the GDP of 25 countries.
Rank | Remittance Inflows by Country | % of GDP (2022) |
---|---|---|
1 | Tonga | 49.9% |
2 | Lebanon | 37.8% |
3 | Samoa | 33.7% |
4 | Tajikistan | 32.0% |
5 | Kyrgyz Republic | 31.2% |
6 | Gambia, The | 28.3% |
7 | Honduras | 27.1% |
8 | South Sudan | 24.8% |
9 | El Salvador | 23.8% |
10 | Haiti | 22.4% |
11 | Nepal | 21.7% |
12 | Jamaica | 21.2% |
13 | Lesotho | 21.0% |
14 | Somalia | 20.6% |
15 | Comoros | 20.1% |
16 | Nicaragua | 19.9% |
17 | Guatemala | 19.8% |
18 | Armenia | 18.9% |
19 | West Bank and Gaza | 18.5% |
20 | Cabo Verde | 18.2% |
21 | Kosovo | 17.3% |
22 | Uzbekistan | 17.0% |
23 | Georgia | 16.2% |
24 | Moldova | 15.4% |
25 | Montenegro | 15.0% |
26 | Ukraine | 13.8% |
27 | Marshall Islands | 11.0% |
28 | Guinea-Bissau | 10.9% |
29 | Bosnia and Herzegovina | 10.1% |
30 | Albania | 9.8% |
31 | Senegal | 9.8% |
32 | Jordan | 9.6% |
33 | Philippines | 9.4% |
34 | Fiji | 9.2% |
35 | Liberia | 9.0% |
36 | Dominican Republic | 8.8% |
37 | Dominica | 8.6% |
38 | Serbia | 8.6% |
39 | Togo | 7.9% |
40 | Morocco | 7.9% |
41 | Pakistan | 7.7% |
42 | Vanuatu | 7.6% |
43 | Timor-Leste | 7.5% |
44 | Suriname | 7.3% |
45 | St. Vincent and the Grenadines | 7.3% |
46 | Kiribati | 7.2% |
47 | Egypt, Arab Rep. | 6.8% |
48 | Ghana | 6.1% |
49 | Mali | 5.9% |
50 | Grenada | 5.8% |
51 | Zimbabwe | 5.3% |
52 | Croatia | 5.3% |
53 | Belize | 5.3% |
54 | Sri Lanka | 4.8% |
55 | Madagascar | 4.7% |
56 | Vietnam | 4.5% |
57 | Bangladesh | 4.5% |
58 | Tunisia | 4.5% |
59 | Cambodia | 4.4% |
60 | Sierra Leone | 4.3% |
61 | Mexico | 4.2% |
62 | Nigeria | 4.1% |
63 | Rwanda | 3.8% |
64 | Ecuador | 3.8% |
65 | Latvia | 3.6% |
66 | Romania | 3.6% |
67 | Niger | 3.6% |
68 | Kenya | 3.5% |
69 | Bolivia | 3.2% |
70 | Burkina Faso | 3.2% |
71 | Myanmar | 3.1% |
72 | North Macedonia | 3.1% |
73 | Mongolia | 3.1% |
74 | Eswatini | 3.1% |
75 | Azerbaijan | 3.0% |
76 | Mozambique | 3.0% |
77 | St. Kitts and Nevis | 2.9% |
78 | India | 2.8% |
79 | St. Lucia | 2.7% |
80 | Guyana | 2.6% |
81 | Colombia | 2.6% |
82 | Congo, Dem. Rep. | 2.6% |
83 | Solomon Islands | 2.4% |
84 | Luxembourg | 2.4% |
85 | Mauritius | 2.4% |
86 | Sudan | 2.3% |
87 | Uganda | 2.3% |
88 | Malawi | 2.3% |
89 | Belgium | 2.2% |
90 | Sao Tome and Principe | 2.0% |
91 | Afghanistan | 2.0% |
92 | Slovak Republic | 2.0% |
93 | Antigua and Barbuda | 2.0% |
94 | Bhutan | 2.0% |
95 | Cyprus | 1.9% |
96 | Portugal | 1.8% |
97 | Thailand | 1.7% |
98 | Belarus | 1.6% |
99 | Mauritania | 1.6% |
100 | Estonia | 1.6% |
101 | Malta | 1.5% |
102 | Peru | 1.5% |
103 | Czech Republic | 1.5% |
104 | Djibouti | 1.4% |
105 | Burundi | 1.3% |
106 | Paraguay | 1.3% |
107 | Hungary | 1.3% |
108 | Slovenia | 1.2% |
109 | Aruba | 1.2% |
110 | Lao PDR | 1.2% |
111 | Benin | 1.1% |
112 | Israel | 1.1% |
113 | Poland | 1.1% |
114 | Lithuania | 1.0% |
115 | France | 1.0% |
116 | Bulgaria | 0.9% |
117 | Algeria | 0.9% |
118 | Zambia | 0.9% |
119 | Costa Rica | 0.9% |
120 | Palau | 0.8% |
121 | Panama | 0.8% |
122 | Cameroon | 0.8% |
123 | Tanzania | 0.7% |
124 | Indonesia | 0.7% |
125 | Spain | 0.6% |
126 | Iceland | 0.5% |
127 | Trinidad and Tobago | 0.5% |
128 | Austria | 0.5% |
129 | Cote d'Ivoire | 0.5% |
130 | Seychelles | 0.4% |
131 | Korea, Rep. | 0.4% |
132 | Italy | 0.4% |
133 | Germany | 0.4% |
134 | Sweden | 0.4% |
135 | Denmark | 0.3% |
136 | Malaysia | 0.3% |
137 | Namibia | 0.3% |
138 | Switzerland | 0.3% |
139 | Finland | 0.3% |
140 | Botswana | 0.3% |
141 | Greece | 0.2% |
142 | Ethiopia | 0.2% |
143 | Qatar | 0.2% |
144 | Russian Federation | 0.2% |
145 | Brazil | 0.2% |
146 | China | 0.2% |
147 | South Africa | 0.2% |
148 | Iraq | 0.2% |
149 | Guinea | 0.2% |
150 | Netherlands | 0.2% |
151 | Uruguay | 0.1% |
152 | Kazakhstan | 0.1% |
153 | Hong Kong SAR, China | 0.1% |
154 | Argentina | 0.1% |
155 | Norway | 0.1% |
156 | Japan | 0.1% |
157 | Maldives | 0.08% |
158 | Turkey | 0.08% |
159 | United Kingdom | 0.07% |
160 | Macao SAR, China | 0.07% |
161 | Ireland | 0.05% |
162 | Australia | 0.04% |
163 | Oman | 0.04% |
164 | Saudi Arabia | 0.03% |
165 | Chile | 0.02% |
166 | United States | 0.02% |
167 | Gabon | 0.02% |
168 | Kuwait | 0.01% |
169 | Angola | 0.01% |
170 | New Zealand | 0.01% |
171 | Papua New Guinea | 0.01% |
172 | Turkmenistan | 0.001% |
Known primarily as a tourist destination, the Polynesian country of Tonga banks on remittance inflows to support its economy. In 2022, the country’s incoming remittance flows were equal to almost 50% of its GDP.
Next on this list is Lebanon. The country received $6.8 billion in remittances in 2022, estimated to equal almost 38% of its GDP and making it a key support to the nation’s shrinking economy.
-
Markets2 weeks ago
The Biggest Global Risks of 2023
-
Markets4 weeks ago
Top Heavy: Countries by Share of the Global Economy
-
Politics1 week ago
Visualizing the World’s Top 25 Fleets of Combat Tanks
-
Money4 weeks ago
U.S. Inflation: How Much Have Prices Increased?
-
Energy1 week ago
The Periodic Table of Commodity Returns (2013-2022)
-
Misc3 weeks ago
Infographic: The Longest Lasting Cars, in Miles
-
Politics1 week ago
Which Countries are the Most Polarized?
-
Markets3 weeks ago
The U.S. Stock Market: Best and Worst Performing Sectors in 2022