Markets
How Total Spend by U.S. Advertisers Has Changed, Over 20 Years
Total Spend by U.S. Advertisers, Over 20 Years
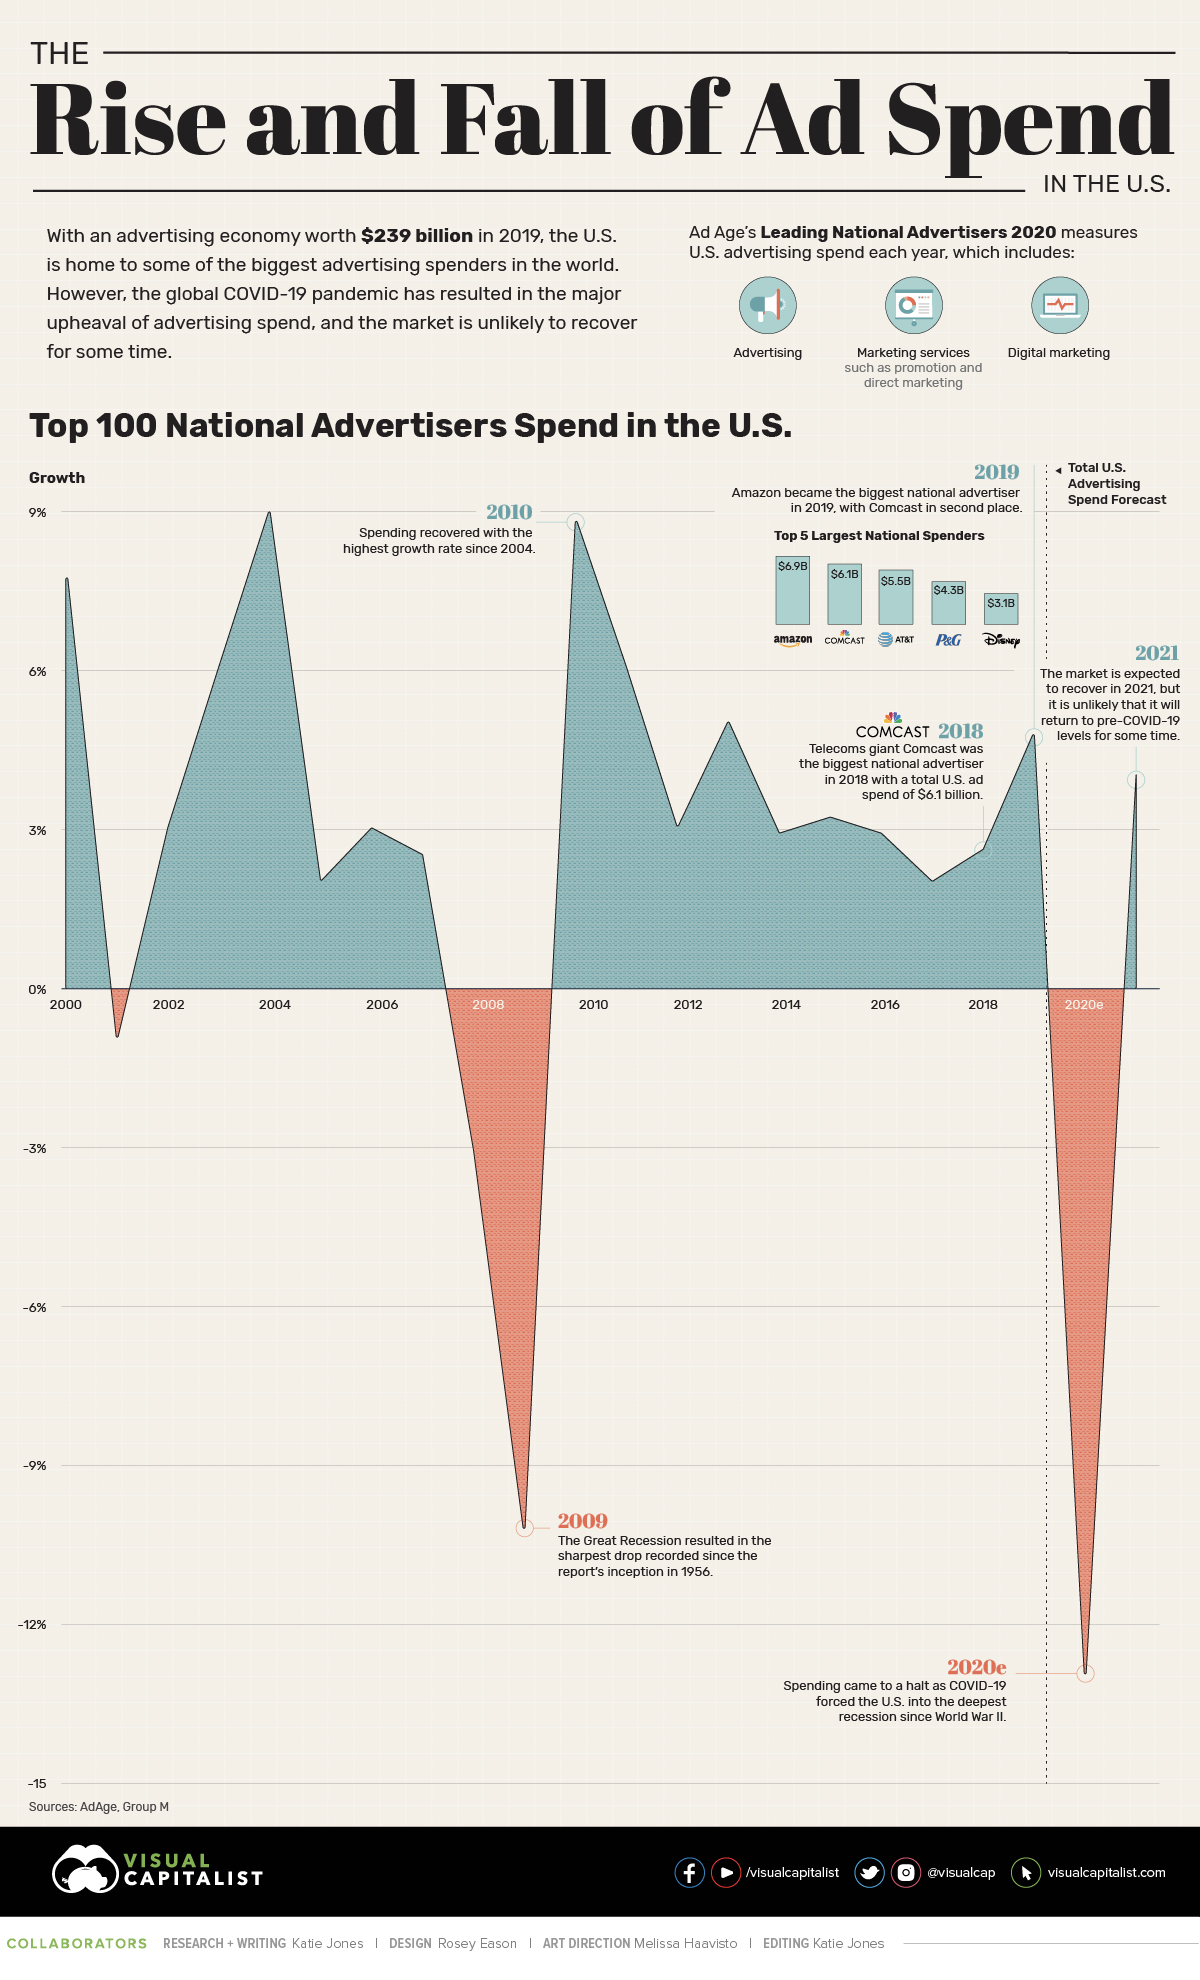
With an advertising economy worth $239 billion in 2019, it’s safe to say that the U.S. is home to some of the biggest advertising spenders on the planet.
However, the COVID-19 pandemic has resulted in the major upheaval of advertising spend, and it is unlikely to recover for some time.
The graphic above uses data from Ad Age’s Leading National Advertisers 2020 which measures U.S. advertising spend each year, and ranks 100 national advertisers by their total spend in 2019.
Let’s take a look at the brands with the biggest budgets.
2019’s Biggest Advertising Spenders
Much of the top 10 biggest advertising spenders are in the telecommunications industry, but it is retail giant Amazon that tops the list with an advertising spend of almost $7 billion.
In fact, Amazon spent an eye-watering $21,000 per minute on advertising and promotion in 2019, making them undeniably the largest advertising spender in America.
Explore the 100 biggest advertisers in 2019 below:
| Rank | Company | Total U.S. Ad Spend 2019 | Industry |
|---|---|---|---|
| #1 | Amazon | $6.9B | Retail |
| #2 | Comcast Corp. | $6.1B | Entertainment |
| #3 | AT&T | $5.5B | Telecommunications |
| #4 | Procter & Gamble | $4.3B | Consumer Goods |
| #5 | Walt Disney | $3.1B | Entertainment |
| #6 | Alphabet | $3.1B | Technology |
| #7 | Verizon Communications | $3.1B | Telecommunications |
| #8 | Charter Communications | $3.0B | Telecommunications |
| #9 | American Express | $3.0B | Financial Services |
| #10 | General Motors | $3.0B | Automotive |
| #11 | JPMorgan Chase | $2.8B | Financial Services |
| #12 | Walmart | $2.7B | Retail |
| #13 | L’Oréal | $2.3B | Beauty |
| #14 | T-Mobile U.S. | $2.3B | Telecommunications |
| #15 | Berkshire Hathaway | $2.3B | Various |
| #16 | Nestlé | $2.3B | Food & Beverages |
| #17 | Ford | $2.3B | Automotive |
| #18 | Expedia Group | $2.2B | Travel & Hospitality |
| #19 | Capital One Financial | $2.2B | Financial Services |
| #20 | Fiat Chrysler Automobiles | $2.0B | Automotive |
| #21 | Samsung | $2.0B | Electronics |
| #22 | Pfizer | $1.9B | Pharmaceuticals |
| #23 | Progressive | $1.8B | Insurance |
| #24 | PepsiCo | $1.7B | Food & Beverages |
| #25 | Bank of America | $1.7B | Financial Services |
| #26 | LVMH | $1.6B | Retail |
| #27 | Target | $1.6B | Retail |
| #28 | McDonald’s | $1.6B | Food & Beverages |
| #29 | Booking Holdings | $1.6B | Travel & Hospitality |
| #30 | GlaxoSmithKline | $1.5B | Pharmaceuticals |
| #31 | Johnson & Johnson | $1.5B | Pharmaceuticals |
| #32 | Anheuser-Busch InBev | $1.5B | Food & Beverages |
| #33 | Toyota | $1.5B | Automotive |
| #34 | Merck & Co. | $1.5B | Logistics |
| #35 | Nike | $1.5B | Retail |
| #36 | AbbVie | $1.4B | Pharmaceuticals |
| #37 | Honda | $1.4B | Automotive |
| #38 | Unilever | $1.4B | Consumer Goods |
| #39 | ViacomCBS | $1.4B | Entertainment |
| #40 | Macy’s | $1.3B | Retail |
| #41 | State Farm | $1.2B | Insurance |
| #42 | Kohl’s | $1.2B | Retail |
| #43 | Home Depot | $1.1B | Retail |
| #44 | Wells Fargo | $1.1B | Financial Services |
| #45 | Yum Brands | $1.1B | Food & Beverages |
| #46 | Netflix | $1.1B | Entertainment |
| #47 | U.S. Government | $1.0B | Government |
| #48 | Estée Lauder | $994M | Beauty |
| #49 | Nissan | $990M | Automotive |
| #50 | Wayfair | $932M | Retail |
| #51 | Diageo | $918M | Food & Beverages |
| #52 | Sanofi | $889M | Pharmaceuticals |
| #53 | Discover Financial Services | $883M | Financial Services |
| #54 | Mars | $880M | Food & Beverages |
| #55 | Eli Lilly | $864M | Pharmaceuticals |
| #56 | Kroger | $854M | Retail |
| #57 | Allstate | $854M | Insurance |
| #58 | Molson Coors | $822M | Food & Beverages |
| #59 | Apple | $818M | Technology |
| #60 | Microsoft | $816M | Technology |
| #61 | Coca-Cola | $816M | Food & Beverages |
| #62 | DISH Network | $815M | Entertainment |
| #63 | Lowe’s | $811M | Retail |
| #64 | Kraft Heinz | $782M | Food & Beverages |
| #65 | Volkswagen | $780M | Automotive |
| #66 | IAC | $775M | Entertainment |
| #67 | Best Buy | $772M | Retail |
| #68 | Intuit | $760M | Technology |
| #69 | Uber | $756M | Technology |
| #70 | Constellation Brands | $749M | Food & Beverages |
| #71 | Sony | $746M | Technology |
| #72 | Cox Enterprises | $715M | Entertainment |
| #73 | Citigroup | $691M | Financial Services |
| #74 | Adidas | $688M | Consumer Goods |
| #75 | LendingTree | $688M | Financial Services |
| #76 | Amgen | $685M | Technology |
| #77 | Gilead Services | $683M | Pharmaceuticals |
| #78 | $671M | Technology | |
| #79 | Lions Gate | $668M | Entertainment |
| #80 | Marriott International | $667M | Travel & Hospitality |
| #81 | EssilorLuxottica | $665M | Consumer Goods |
| #82 | J.C. Penney | $644M | Retail |
| #83 | Liberty Mutual | $640M | Insurance |
| #84 | Daimler | $640M | Automotive |
| #85 | Hyundai | $627M | Automotive |
| #86 | Walgreens | $621M | Retail |
| #87 | Dell | $618M | Technology |
| #88 | IBM | $606M | Technology |
| #89 | Reckitt Benckiser | $593M | Consumer Goods |
| #90 | Keurig Dr Pepper | $593M | Food & Beverages |
| #91 | Restaurant Brands International | $589M | Food & Beverages |
| #92 | Inspire Brands | $589M | Food & Beverages |
| #93 | Clorox | $581M | Consumer Goods |
| #94 | Novartis | $579M | Pharmaceuticals |
| #95 | eBay | $562M | Retail |
| #96 | Gap | $562M | Retail |
| #97 | Takeda | $541M | Pharmaceuticals |
| #98 | Kia Motors | $534M | Automotive |
| #99 | Coty | $531M | Beauty |
| #100 | Subarau | $532M | Automotive |
The report offers several ways of looking at this data—for example, when looking at highest spend by medium, Procter & Gamble comes out on top for traditional media spend like broadcast and cable TV.
On the digital front, Expedia Group is the biggest spender on desktop search, while Amazon tops the list for internet display ads.
The Rise and Fall of Advertising Spend
Interestingly, changes in advertising spend tend to fall closely in step with broader economic growth. In fact, for every 1% increase in U.S. GDP, there is a 4.4% rise of advertising that occurs in tandem.
The same phenomenon can be seen among the biggest advertising spenders in the country. Since 2000, spend has seen both promising growth, and drastic declines. Unsurprisingly, the Great Recession resulted in the largest drop in spend ever recorded, and now it looks as though history may be repeating itself.
Total advertising spend in the U.S. is estimated this year to see a brutal decline of almost 13% and is unlikely to return to previous levels for a number of years.
The COVID-19 Gut Punch
To say that the global COVID-19 pandemic has impacted consumer behavior would be an understatement, and perhaps the most notable change is how they now consume content.
With more people staying safe indoors, there is less need for traditional media formats such as out-of-home advertising. As a result, online media is taking its place, as an increase in spend for this format shows.
But despite marketers trying to optimize their media strategy or stripping back their budget entirely, many governments across the world are ramping up their spend on advertising to promote public health messages—or in the case of the U.S., to canvass.
The Saving Grace?
Even though advertising spend is expected to nosedive by almost 13% in 2020, this figure excludes political advertising. When taking that into account, the decline becomes a slightly more manageable 7.6%
Moreover, according to industry research firm Kantar, advertising spend for the 2020 U.S. election is estimated to reach $7 billion—the same as Amazon’s 2019 spend—making it the most expensive election of all time.
Can political advertising be the key to the advertising industry bouncing back again?


Markets
The European Stock Market: Attractive Valuations Offer Opportunities
On average, the European stock market has valuations that are nearly 50% lower than U.S. valuations. But how can you access the market?


European Stock Market: Attractive Valuations Offer Opportunities
Europe is known for some established brands, from L’Oréal to Louis Vuitton. However, the European stock market offers additional opportunities that may be lesser known.
The above infographic, sponsored by STOXX, outlines why investors may want to consider European stocks.
Attractive Valuations
Compared to most North American and Asian markets, European stocks offer lower or comparable valuations.
| Index | Price-to-Earnings Ratio | Price-to-Book Ratio |
|---|---|---|
| EURO STOXX 50 | 14.9 | 2.2 |
| STOXX Europe 600 | 14.4 | 2 |
| U.S. | 25.9 | 4.7 |
| Canada | 16.1 | 1.8 |
| Japan | 15.4 | 1.6 |
| Asia Pacific ex. China | 17.1 | 1.8 |
Data as of February 29, 2024. See graphic for full index names. Ratios based on trailing 12 month financials. The price to earnings ratio excludes companies with negative earnings.
On average, European valuations are nearly 50% lower than U.S. valuations, potentially offering an affordable entry point for investors.
Research also shows that lower price ratios have historically led to higher long-term returns.
Market Movements Not Closely Connected
Over the last decade, the European stock market had low-to-moderate correlation with North American and Asian equities.
The below chart shows correlations from February 2014 to February 2024. A value closer to zero indicates low correlation, while a value of one would indicate that two regions are moving in perfect unison.
| EURO STOXX 50 | STOXX EUROPE 600 | U.S. | Canada | Japan | Asia Pacific ex. China |
|
|---|---|---|---|---|---|---|
| EURO STOXX 50 | 1.00 | 0.97 | 0.55 | 0.67 | 0.24 | 0.43 |
| STOXX EUROPE 600 | 1.00 | 0.56 | 0.71 | 0.28 | 0.48 | |
| U.S. | 1.00 | 0.73 | 0.12 | 0.25 | ||
| Canada | 1.00 | 0.22 | 0.40 | |||
| Japan | 1.00 | 0.88 | ||||
| Asia Pacific ex. China | 1.00 |
Data is based on daily USD returns.
European equities had relatively independent market movements from North American and Asian markets. One contributing factor could be the differing sector weights in each market. For instance, technology makes up a quarter of the U.S. market, but health care and industrials dominate the broader European market.
Ultimately, European equities can enhance portfolio diversification and have the potential to mitigate risk for investors.
Tracking the Market
For investors interested in European equities, STOXX offers a variety of flagship indices:
| Index | Description | Market Cap |
|---|---|---|
| STOXX Europe 600 | Pan-regional, broad market | €10.5T |
| STOXX Developed Europe | Pan-regional, broad-market | €9.9T |
| STOXX Europe 600 ESG-X | Pan-regional, broad market, sustainability focus | €9.7T |
| STOXX Europe 50 | Pan-regional, blue-chip | €5.1T |
| EURO STOXX 50 | Eurozone, blue-chip | €3.5T |
Data is as of February 29, 2024. Market cap is free float, which represents the shares that are readily available for public trading on stock exchanges.
The EURO STOXX 50 tracks the Eurozone’s biggest and most traded companies. It also underlies one of the world’s largest ranges of ETFs and mutual funds. As of November 2023, there were €27.3 billion in ETFs and €23.5B in mutual fund assets under management tracking the index.
“For the past 25 years, the EURO STOXX 50 has served as an accurate, reliable and tradable representation of the Eurozone equity market.”
— Axel Lomholt, General Manager at STOXX
Partnering with STOXX to Track the European Stock Market
Are you interested in European equities? STOXX can be a valuable partner:
- Comprehensive, liquid and investable ecosystem
- European heritage, global reach
- Highly sophisticated customization capabilities
- Open architecture approach to using data
- Close partnerships with clients
- Part of ISS STOXX and Deutsche Börse Group
With a full suite of indices, STOXX can help you benchmark against the European stock market.
Learn how STOXX’s European indices offer liquid and effective market access.

-

 Economy2 days ago
Economic Growth Forecasts for G7 and BRICS Countries in 2024
The IMF has released its economic growth forecasts for 2024. How do the G7 and BRICS countries compare?
-

 Markets1 week ago
U.S. Debt Interest Payments Reach $1 Trillion
U.S. debt interest payments have surged past the $1 trillion dollar mark, amid high interest rates and an ever-expanding debt burden.
-

 United States2 weeks ago
Ranked: The Largest U.S. Corporations by Number of Employees
We visualized the top U.S. companies by employees, revealing the massive scale of retailers like Walmart, Target, and Home Depot.
-

 Markets2 weeks ago
The Top 10 States by Real GDP Growth in 2023
This graphic shows the states with the highest real GDP growth rate in 2023, largely propelled by the oil and gas boom.
-

 Markets2 weeks ago
Ranked: The World’s Top Flight Routes, by Revenue
In this graphic, we show the highest earning flight routes globally as air travel continued to rebound in 2023.
-

 Markets2 weeks ago
Ranked: The Most Valuable Housing Markets in America
The U.S. residential real estate market is worth a staggering $47.5 trillion. Here are the most valuable housing markets in the country.


-

 Energy1 week ago
The World’s Biggest Nuclear Energy Producers
-

 Money2 weeks ago
Which States Have the Highest Minimum Wage in America?
-

 Technology2 weeks ago
Ranked: Semiconductor Companies by Industry Revenue Share
-
Markets2 weeks ago
Ranked: The World’s Top Flight Routes, by Revenue
-

 Demographics2 weeks ago
Population Projections: The World’s 6 Largest Countries in 2075
-
Markets2 weeks ago
The Top 10 States by Real GDP Growth in 2023
-

 Demographics2 weeks ago
The Smallest Gender Wage Gaps in OECD Countries
-

 United States2 weeks ago
Where U.S. Inflation Hit the Hardest in March 2024