Mining
Volatile Returns: Commodity Investing Through Miners and Explorers

Volatile Returns: Commodity Investing Through Miners
Investors consider gold and silver as safe haven investments. But the companies that produce gold and silver often offer volatile returns, creating opportunities for astute investors.
Volatility is a double-edged sword, particularly when it comes to commodity investing. During the good times, it can create skyrocketing returns. But during bad times, it can turn ugly.
Today’s infographic comes to us from Prospector Portal, and shows how investing in precious metals equities can outperform or underperform the broader metals market.
Capitalizing on Volatility: Timing Matters
Just like most investments, timing matters with commodities.
Due to the complex production processes of commodities, unexpected demand shocks are met with slower supply responses. This, along with other factors, creates commodity supercycles—extended periods of upswings and downswings in prices.
Investors must time their investments to take advantage of this volatility, and there are multiple ways to do so.
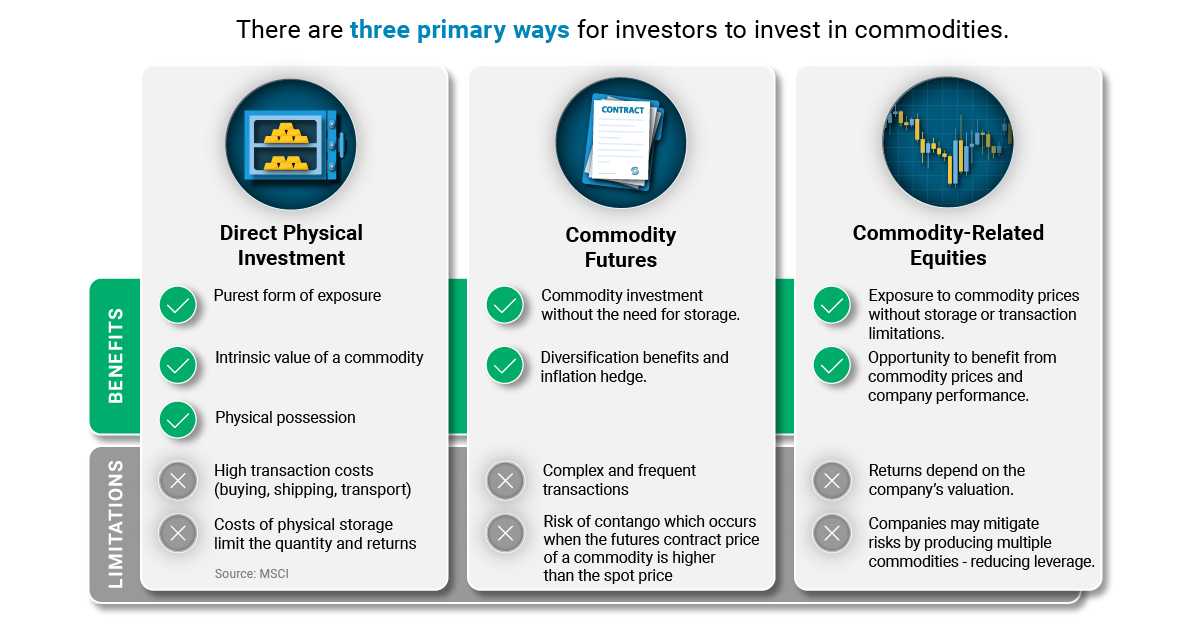
Three Ways to Invest in Commodities
There are three primary routes investors can take when it comes to investing in commodities.
| Investment Method | Benefits | Limitations |
|---|---|---|
| Direct physical investment |
|
|
| Commodity futures |
|
|
| Commodity-related equities |
|
|
Among these, commodity-related equities offer by far the most leverage to changes in prices. Let’s dive into how investors can use this leverage to their advantage with volatile metal prices.
The Fundamentals of Investing in Mining Equities
When it comes to commodity investing, targeting miners and mineral exploration companies presents fundamental benefits and drawbacks.
As metal prices rise, the performance of mining companies improves in several ways—while in deteriorating conditions, they do the opposite:
| Category | Rising Commodity Prices | Falling Commodity Prices |
|---|---|---|
| Outlook | - Improved outlook | - Deteriorated outlook |
| Stock Price Movement | - Equity growth | - Equity decline |
| Dividend Payouts | - Increased dividends | - Decreased dividends |
| Financial Performance | - Increased earnings | - Decreased earnings |
With the right timing, these ups and downs can create explosive opportunities.
Mining companies, especially explorers, use these price swings to their advantage and often produce market-beating returns during an upswing.
But how?
The Proof: How Mining Equities React to Metal Prices
Not only do price increases translate into higher profits for mining companies, but they can also change the outlook and value of exploration companies. As a result, investing in exploration companies can be a great way to gain exposure to changing prices.
That said, these types of companies can generate greater equity returns over a shorter period of time when prices are high, but they can also turn dramatically negative when prices are low.
Below, we compare how producers and exploration companies with a NI-43-101 compliant resource perform during bull and bear markets for precious metals.
All figures are in U.S. dollars unless otherwise stated.
| Mining Company | Company Stage | Primary Metal Produced | Market Cap. Oct 31, 2019 | Market Cap. July 29, 2020 | Bull Market Performance (Nov. 1, 2019-July 29, 2020) | Bear Market Performance (Jan 02 – Dec 31, 2018) |
|---|---|---|---|---|---|---|
| Banyan Gold | Exploration/ Development | Gold | $6M | $40M | 500% | -44% |
| Renforth Resources | Exploration | Gold | $8M | $10M | 11% | -10% |
| Auryn Resources | Exploration | Gold, Copper | $181M | $330M | 60% | -39% |
| Wesdome Gold Mines Ltd. | Production | Gold | $1,104M | $1,885M | 68% | 110% |
| Monarch Gold | Exploration/ Development | Gold | $57M | $148M | 139% | -23% |
| Red Pine Exploration | Exploration | Gold | $13M | $22M | 29% | -55% |
| Revival Gold Inc. | Exploration/ Development | Gold | $27M | $74M | 113% | 5% |
| Erdene Resource Development | Exploration/ Development | Gold | $36M | $111M | 222% | -56% |
| Endeavor Mining Corp. | Production | Gold | $2,622M | $5,874M | 54% | -13% |
| Yamana Gold Inc | Production | Gold | $4,572M | $8,279M | 87% | -22% |
During the bear market period, the price of gold declined by 2.66%, and despite engaging in exploration activity, most companies saw a slump in their share prices.
In particular, exploration companies, or juniors, took a heavier hit, with returns averaging -31.66%. But even during a bear market, a discovery can make all the difference—as was the case for producer Wesdome Gold Mines, generating a 109.95% return over 2018.
- Average returns for gold producers including Wesdome: 24.83%
- Average returns for gold producers excluding Wesdome: -17.65%
During the bull market period for gold, gold mining companies outperformed the price of gold, with juniors offering the highest equity returns averaging 153.43%. Gold producers outperformed the commodity market, the value of their equities increased 69.61%—less than half of that of exploration companies.
Silver: Bears vs Bulls
Similar to gold mining companies, performances of silver producers and explorers reflected the volatility in silver prices:
| Company | Company Stage | Primary Metal Produced | Market Cap. Oct 31, 2019 | Market Cap. July 29, 2020 | Bull Market Performance (Nov. 1, 2019-July 29, 2020) | Bear Market Performance (Jan 02 – Dec 31, 2018) |
|---|---|---|---|---|---|---|
| Silvercrest Metals | Exploration | Silver | $694M | $1,449M | 78% | 117% |
| Pan American Silver | Production | Silver | $2,973M | $10,550M | 125% | 1% |
| Golden Minerals | Exploration | Silver | $30M | $80M | 80% | -42% |
| Americas Gold and Silver | Production | Silver | $335M | $482M | 10% | -56% |
| Dolly Varden Silver Corp. | Exploration | Silver | $28M | $74M | 152% | -32% |
| Endeavour Silver | Production | Silver, Gold | $458M | $837M | 72% | -10% |
During the bear market period for silver, its price decreased by 9.8%. Explorers and producers both saw a dip in their share prices, with the equity of silver producers decreasing by 21.63%.
However, the discovery of a high-quality silver deposit again made the difference for SilverCrest Metals, which generated a 116.85% return over the year.
- Average returns for silver exploration companies including SilverCrest: 8.32%
- Average returns for silver exploration companies excluding SilverCrest: -27.86%
On the other hand, during the bull market period, the price of silver increased by 34.33%. Silver exploration companies surpassed the performance of the price of silver.
- Average returns for silver producers: 69.04%
- Average returns for silver exploration companies: 95.36%
The potential to generate massive returns and losses is evident in both cases for gold and silver.
The Investment Potential of Exploration
Mining equities tend to outperform underlying commodity prices during bull markets, while underperforming during bear markets.
For mining exploration companies, these effects are even more pronounced—exploration companies are high-risk but can offer high-reward when it comes to commodity investing.
To reap the rewards of volatile returns, you have to know the risks and catch the market at the right time.


Lithium
Ranked: The Top 10 EV Battery Manufacturers in 2023
Asia dominates this ranking of the world’s largest EV battery manufacturers in 2023.


The Top 10 EV Battery Manufacturers in 2023
This was originally posted on our Voronoi app. Download the app for free on iOS or Android and discover incredible data-driven charts from a variety of trusted sources.
Despite efforts from the U.S. and EU to secure local domestic supply, all major EV battery manufacturers remain based in Asia.
In this graphic we rank the top 10 EV battery manufacturers by total battery deployment (measured in megawatt-hours) in 2023. The data is from EV Volumes.
Chinese Dominance
Contemporary Amperex Technology Co. Limited (CATL) has swiftly risen in less than a decade to claim the title of the largest global battery group.
The Chinese company now has a 34% share of the market and supplies batteries to a range of made-in-China vehicles, including the Tesla Model Y, SAIC’s MG4/Mulan, and various Li Auto models.
| Company | Country | 2023 Production (megawatt-hour) | Share of Total Production |
|---|---|---|---|
| CATL | 🇨🇳 China | 242,700 | 34% |
| BYD | 🇨🇳 China | 115,917 | 16% |
| LG Energy Solution | 🇰🇷 Korea | 108,487 | 15% |
| Panasonic | 🇯🇵 Japan | 56,560 | 8% |
| SK On | 🇰🇷 Korea | 40,711 | 6% |
| Samsung SDI | 🇰🇷 Korea | 35,703 | 5% |
| CALB | 🇨🇳 China | 23,493 | 3% |
| Farasis Energy | 🇨🇳 China | 16,527 | 2% |
| Envision AESC | 🇨🇳 China | 8,342 | 1% |
| Sunwoda | 🇨🇳 China | 6,979 | 1% |
| Other | - | 56,040 | 8% |
In 2023, BYD surpassed LG Energy Solution to claim second place. This was driven by demand from its own models and growth in third-party deals, including providing batteries for the made-in-Germany Tesla Model Y, Toyota bZ3, Changan UNI-V, Venucia V-Online, as well as several Haval and FAW models.
The top three battery makers (CATL, BYD, LG) collectively account for two-thirds (66%) of total battery deployment.
Once a leader in the EV battery business, Panasonic now holds the fourth position with an 8% market share, down from 9% last year. With its main client, Tesla, now sourcing batteries from multiple suppliers, the Japanese battery maker seems to be losing its competitive edge in the industry.
Overall, the global EV battery market size is projected to grow from $49 billion in 2022 to $98 billion by 2029, according to Fortune Business Insights.

-

 Education1 week ago
How Hard Is It to Get Into an Ivy League School?
-

 Technology2 weeks ago
Ranked: Semiconductor Companies by Industry Revenue Share
-

 Markets2 weeks ago
Ranked: The World’s Top Flight Routes, by Revenue
-

 Demographics2 weeks ago
Population Projections: The World’s 6 Largest Countries in 2075
-

 Markets2 weeks ago
The Top 10 States by Real GDP Growth in 2023
-

 Demographics2 weeks ago
The Smallest Gender Wage Gaps in OECD Countries
-

 Economy2 weeks ago
Where U.S. Inflation Hit the Hardest in March 2024
-

 Green2 weeks ago
Top Countries By Forest Growth Since 2001