Agriculture
MegaMilk: Charting Consolidation in the U.S. Dairy Industry


MegaMilk: Charting the Consolidation of the Dairy Industry
Today’s dairy industry looks very different to how it did just 30 years ago.
Milk production in the U.S. has increased by a whopping 50% over that time frame—yet, the total number of dairy farms has dropped by three-quarters.
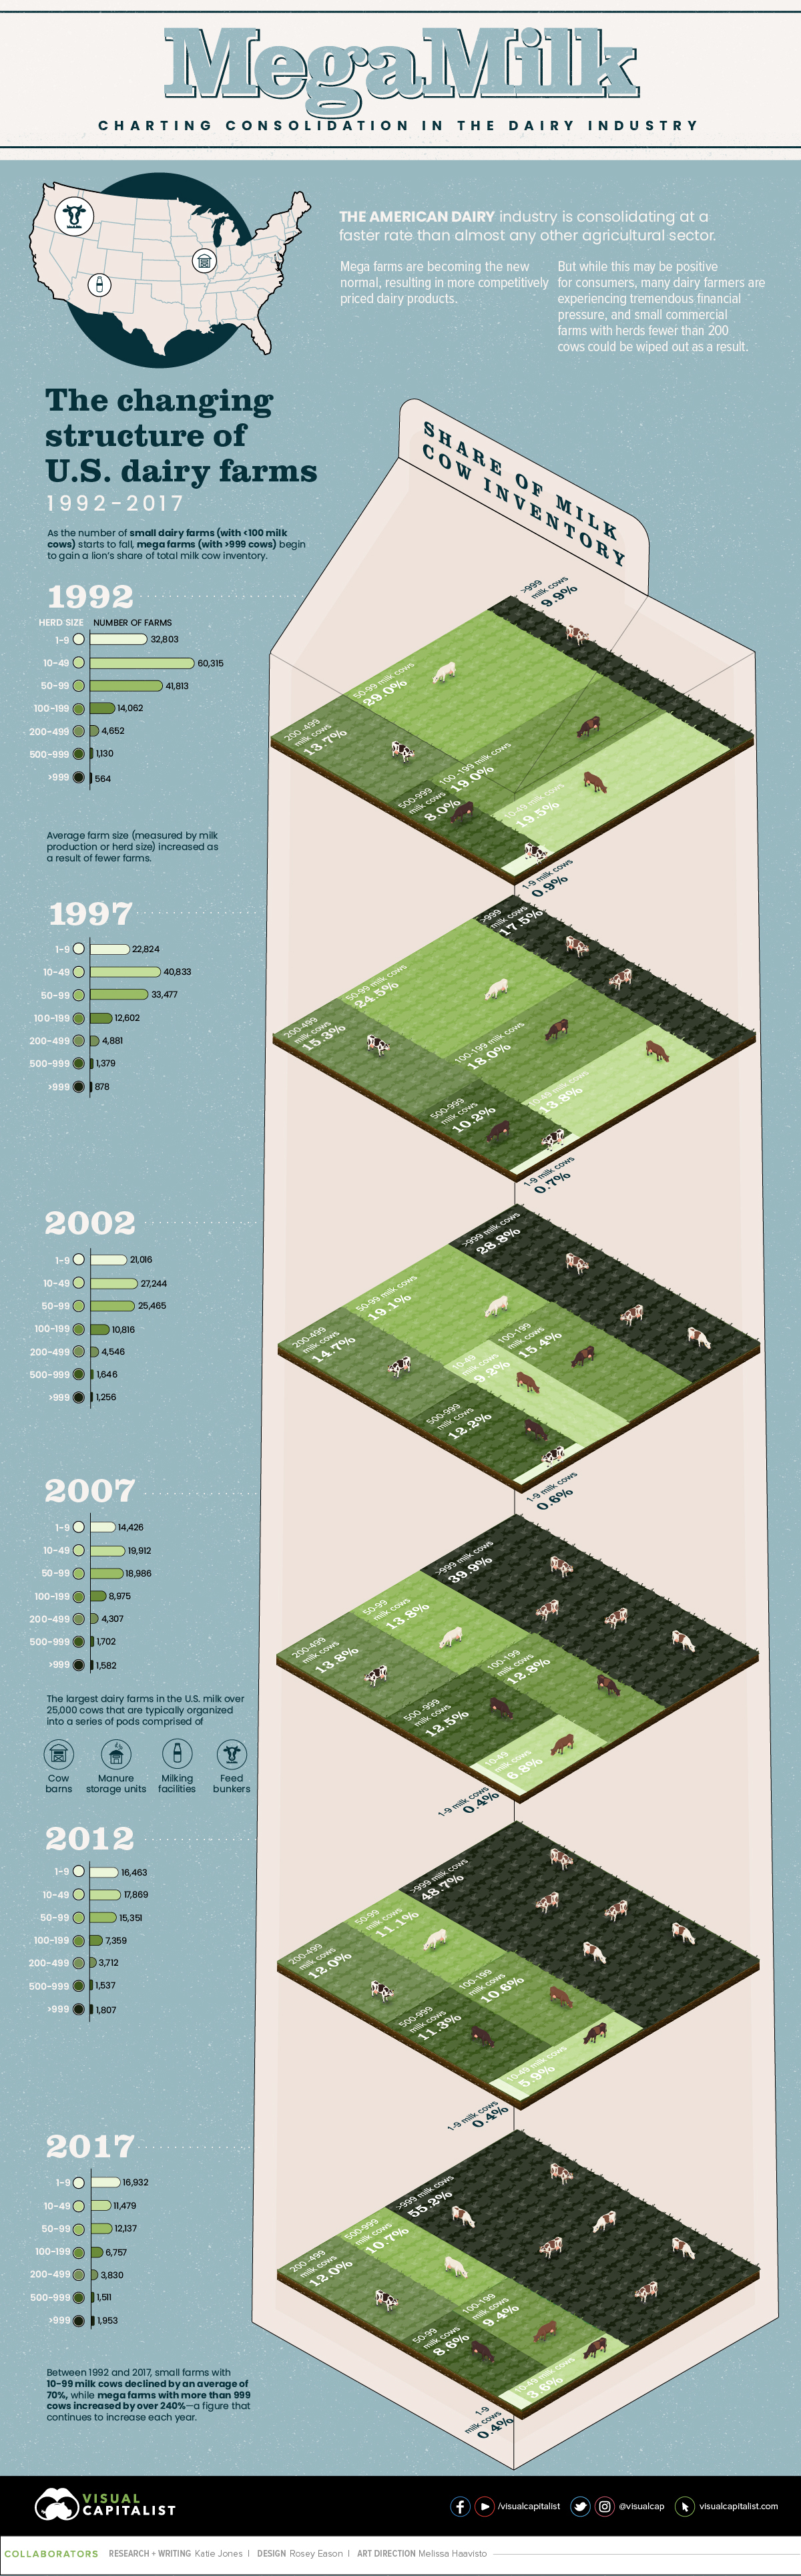
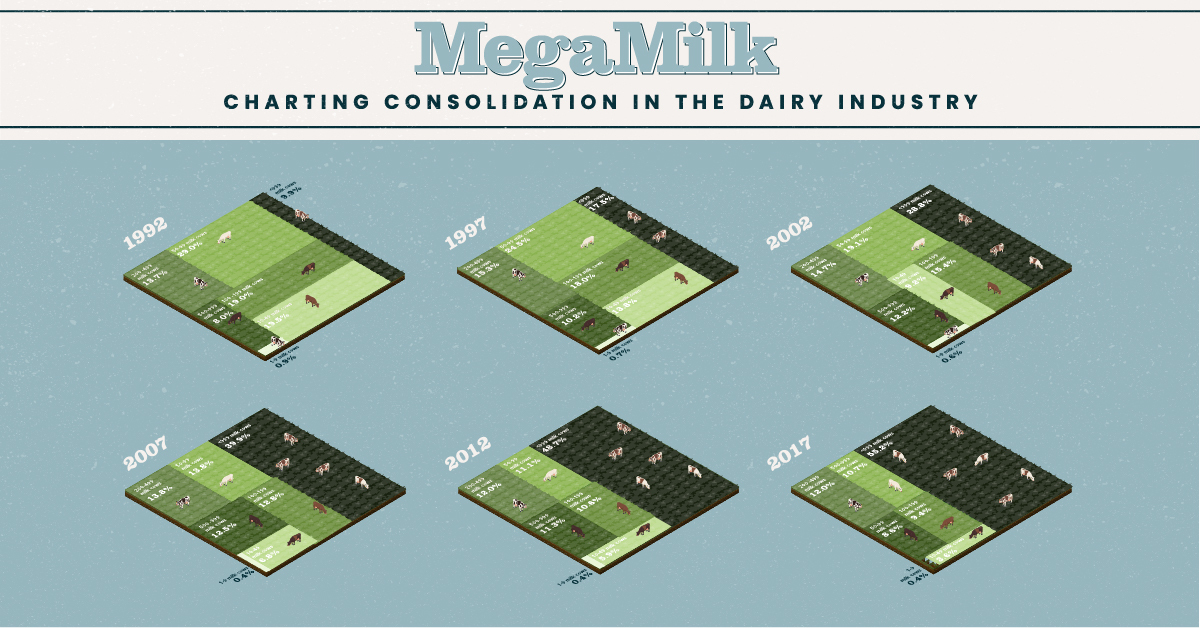
Fewer and larger farms now have the lion’s share of all U.S milk cow inventory. While they have the ability to produce more competitively priced dairy products and provide more value to consumers, it is causing financial devastation for small farmers.
The graphic above uses data from the USDA to chart the rapid consolidation of the American dairy industry between 1992 and 2017.
The End of the Small Dairy Farmer?
In the U.S., the dairy industry is one of the fastest consolidating industries in comparison to almost all other agricultural sectors.
Between 1992 and 2017, small commercial farms with 10-99 cows saw an average decline of 70%. These farms accounted for 48.5% share of all U.S. milk cows in 1992. In 2017, that number stood at just 12.2%.
Over time, small farm production has been replaced by that of bigger and more consolidated “megafarms”—a move that can be attributed to the many benefits that scale brings, such as lower costs of production and the potential to compete in the international market.
| Share of U.S. milk cow inventory (by year) | ||||||
|---|---|---|---|---|---|---|
| Herd size | 1992 | 1997 | 2002 | 2007 | 2012 | 2017 |
| 1-9 milk cows | 0.9% | 0.7% | 0.6% | 0.4% | 0.4% | 0.4% |
| 10-49 milk cows | 19.5% | 13.8% | 9.2% | 6.8% | 5.9% | 3.6% |
| 50-99 milk cows | 29% | 24.5% | 19.1% | 13.8% | 11.1% | 8.6% |
| 100-199 milk cows | 19% | 18% | 15.4% | 12.8% | 10.6% | 9.4% |
| 200-499 milk cows | 13.7% | 15.3% | 14.7% | 13.8% | 12% | 12% |
| 500-999 milk cows | 8% | 10.2% | 12.2% | 12.5% | 11.3% | 10.7% |
| >999 milk cows | 9.9% | 17.5% | 28.8% | 39.9% | 48.7% | 55.2% |
| Total | 100% | 100% | 100% | 100% | 100% | 100% |
The Need For a Survival Strategy
While small dairy farmers simply cannot keep up with larger farms encroaching on their turf, they also have fluctuations in dairy prices to contend with. Milk prices fell in 2018, narrowing the gap between milk prices and feed costs so much that another wave of farm closures ensued.
To make matters worse, many small dairy farmers are close to retirement age, and according to the USDA, exits are more likely if the farm operator is 60 or older.
Despite the hardship facing small dairy farmers, analysts suggest that consumer backlash against large-scale production could present opportunities for small dairy farmers to create premium artisanal products. However, such initiatives would be entirely dependent on the state of the economy and where consumer’s values lie.
The Wider Implications
With milk production shifting to larger farms, a range of both direct and indirect impacts are being felt across the country.
For example, milk production is now predominantly focused in fewer states such as California and Wisconsin, which together accounted for almost 33% of all U.S. milk production in 2018.
In larger farms, the herds are typically confined to tight spaces— rather than grazing in pastures—making animal welfare an issue for many of these farms. Concern over waste contamination and air pollution also brings the environmental sustainability of larger farms into question as they come under more pressure to reduce their impact on the planet.
Changing Tastes
Looking beyond the production of milk, changing consumer preferences could result in the most transformative effects on both large and small scale dairy farmers.
While rising populations are increasing the demand for dairy, per capita milk consumption declined by 24% between 2000 and 2017 in the United States. Consequently, the largest dairy producer in the country, Dean Foods, filed for bankruptcy in 2019, followed by another major milk producer, Borden Dairy, just two months later.
Experts claim that changing consumer preferences, along with competition from other beverage categories, are responsible for 90% of the total dairy decline.
No Country for Old Farms
The confluence of changing economics and an aging population of farmers has brought the U.S. dairy farming industry to a tipping point, and the near future is likely to bring a fresh wave of dairy farm closures.
I don’t see anything that would give them hope at this point. The best advice I can give to these folks, dairy farmers, is to sell out as fast as you can.
– Joe Schroeder, Farm Aid
As smaller farms continue to disappear from America’s rural landscape, the impacts of consolidation will not only affect dairy farmers, but entire rural communities too.


Agriculture
The World’s Top Cocoa Producing Countries
Here are the largest cocoa producing countries globally—from Côte d’Ivoire to Brazil—as cocoa prices hit record highs.
The World’s Top Cocoa Producing Countries
This was originally posted on our Voronoi app. Download the app for free on iOS or Android and discover incredible data-driven charts from a variety of trusted sources.
West Africa is home to the largest cocoa producing countries worldwide, with 3.9 million tonnes of production in 2022.
In fact, there are about one million farmers in Côte d’Ivoire supplying cocoa to key customers such as Nestlé, Mars, and Hershey. But the massive influence of this industry has led to significant forest loss to plant cocoa trees.
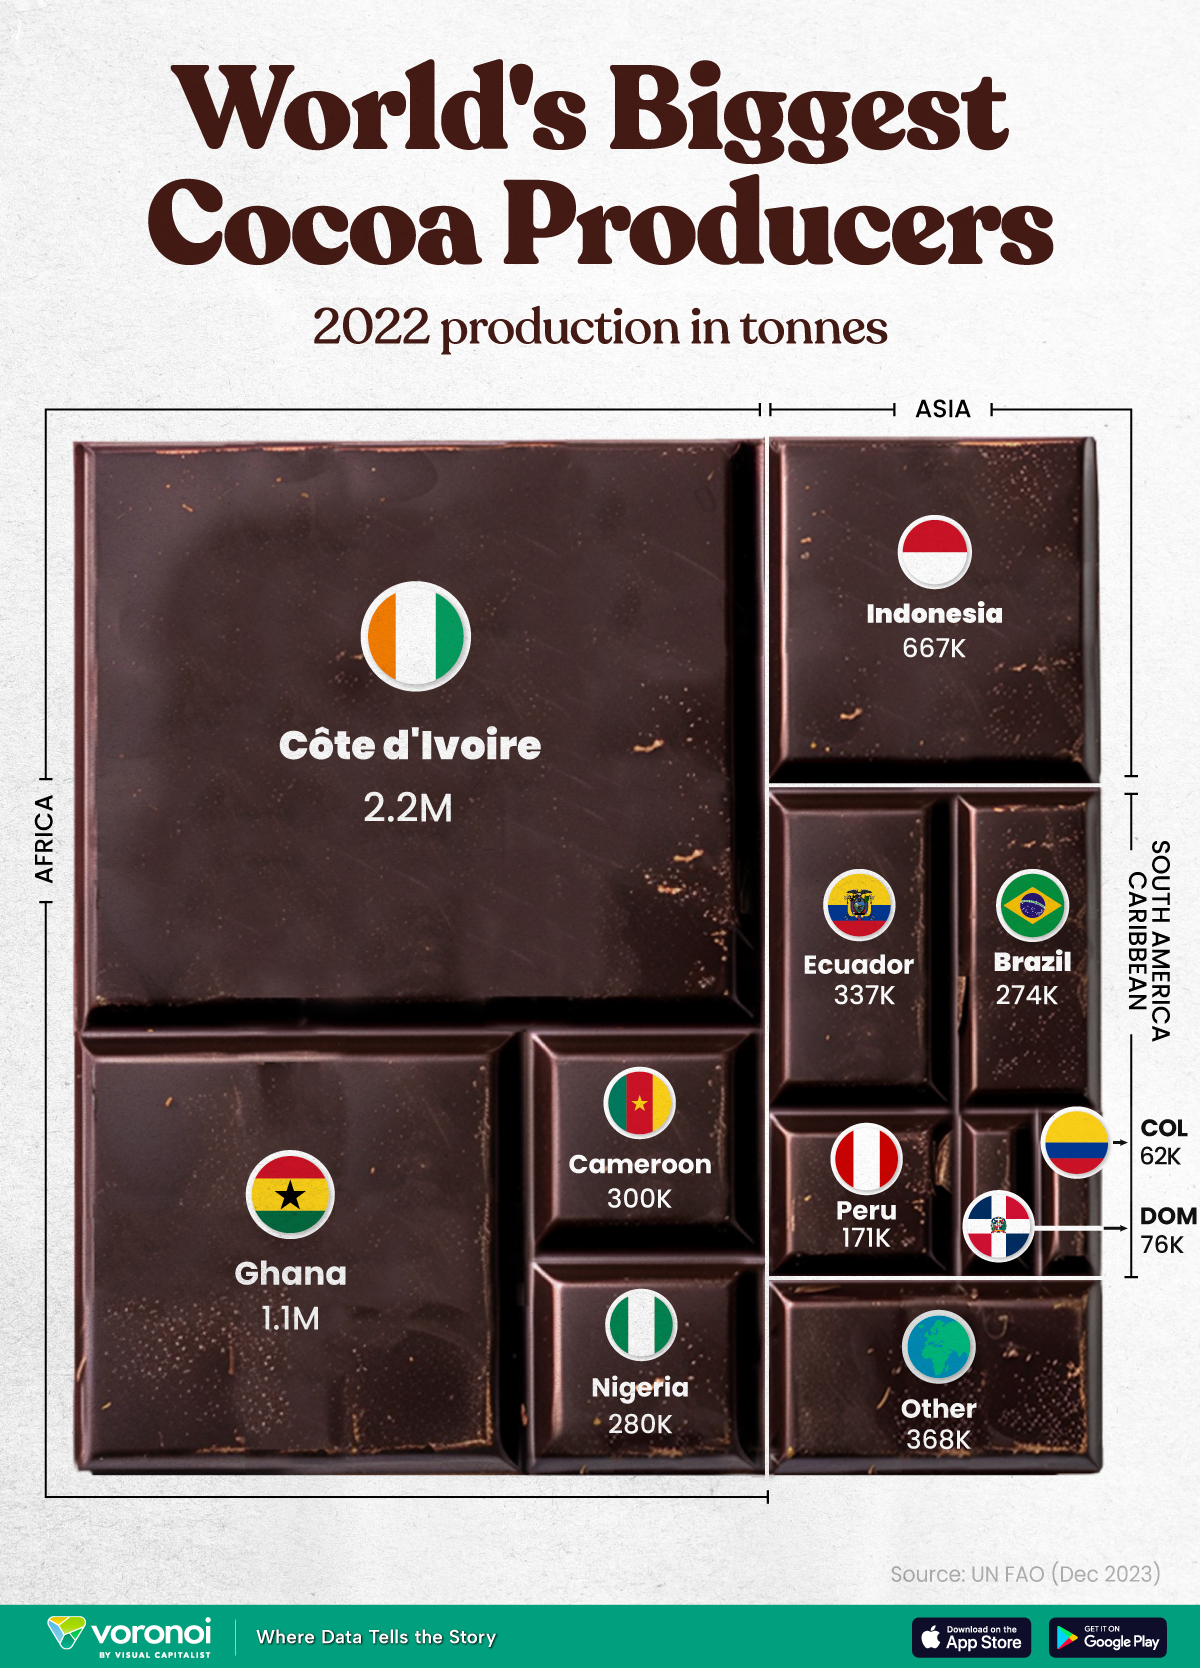
This graphic shows the leading producers of cocoa, based on data from the UN FAO.
Global Hotspots for Cocoa Production
Below, we break down the top cocoa producing countries as of 2022:
| Country | 2022 Production, Tonnes |
|---|---|
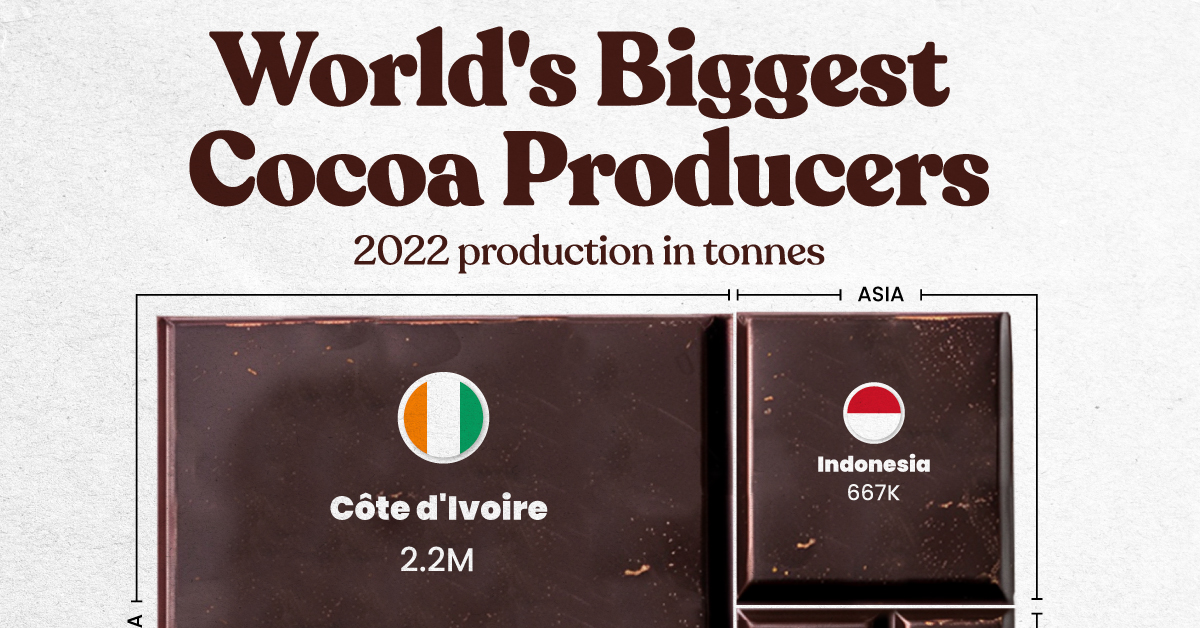
| 🇨🇮 Côte d'Ivoire | 2.2M |
| 🇬🇭 Ghana | 1.1M |
| 🇮🇩 Indonesia | 667K |
| 🇪🇨 Ecuador | 337K |
| 🇨🇲 Cameroon | 300K |
| 🇳🇬 Nigeria | 280K |
| 🇧🇷 Brazil | 274K |
| 🇵🇪 Peru | 171K |
| 🇩🇴 Dominican Republic | 76K |
| 🌍 Other | 386K |
With 2.2 million tonnes of cocoa in 2022, Côte d’Ivoire is the world’s largest producer, accounting for a third of the global total.
For many reasons, the cocoa trade in Côte d’Ivoire and Western Africa has been controversial. Often, farmers make about 5% of the retail price of a chocolate bar, and earn $1.20 each day. Adding to this, roughly a third of cocoa farms operate on forests that are meant to be protected.
As the third largest producer, Indonesia produced 667,000 tonnes of cocoa with the U.S., Malaysia, and Singapore as major importers. Overall, small-scale farmers produce 95% of cocoa in the country, but face several challenges such as low pay and unwanted impacts from climate change. Alongside aging trees in the country, these setbacks have led productivity to decline.
In South America, major producers include Ecuador and Brazil. In the early 1900s, Ecuador was the world’s largest cocoa producing country, however shifts in the global marketplace and crop disease led its position to fall. Today, the country is most known for its high-grade single-origin chocolate, with farms seen across the Amazon rainforest.
Altogether, global cocoa production reached 6.5 million tonnes, supported by strong demand. On average, the market has grown 3% annually over the last several decades.

-

 Misc1 week ago
How Hard Is It to Get Into an Ivy League School?
-

 Technology2 weeks ago
Ranked: Semiconductor Companies by Industry Revenue Share
-

 Markets2 weeks ago
Ranked: The World’s Top Flight Routes, by Revenue
-

 Demographics2 weeks ago
Population Projections: The World’s 6 Largest Countries in 2075
-

 Markets2 weeks ago
The Top 10 States by Real GDP Growth in 2023
-

 Demographics2 weeks ago
The Smallest Gender Wage Gaps in OECD Countries
-

 United States2 weeks ago
Where U.S. Inflation Hit the Hardest in March 2024
-

 Green2 weeks ago
Top Countries By Forest Growth Since 2001