Advertising
The Most Loved Brands, by Generation


The Most Beloved Brands, by Generation
When it comes to buying into brands, consumers are spoiled for choice.
The vast amount of options available makes it increasingly difficult for brands to build meaningful emotional connections with them—but for the brands that do, the payoff can be huge.
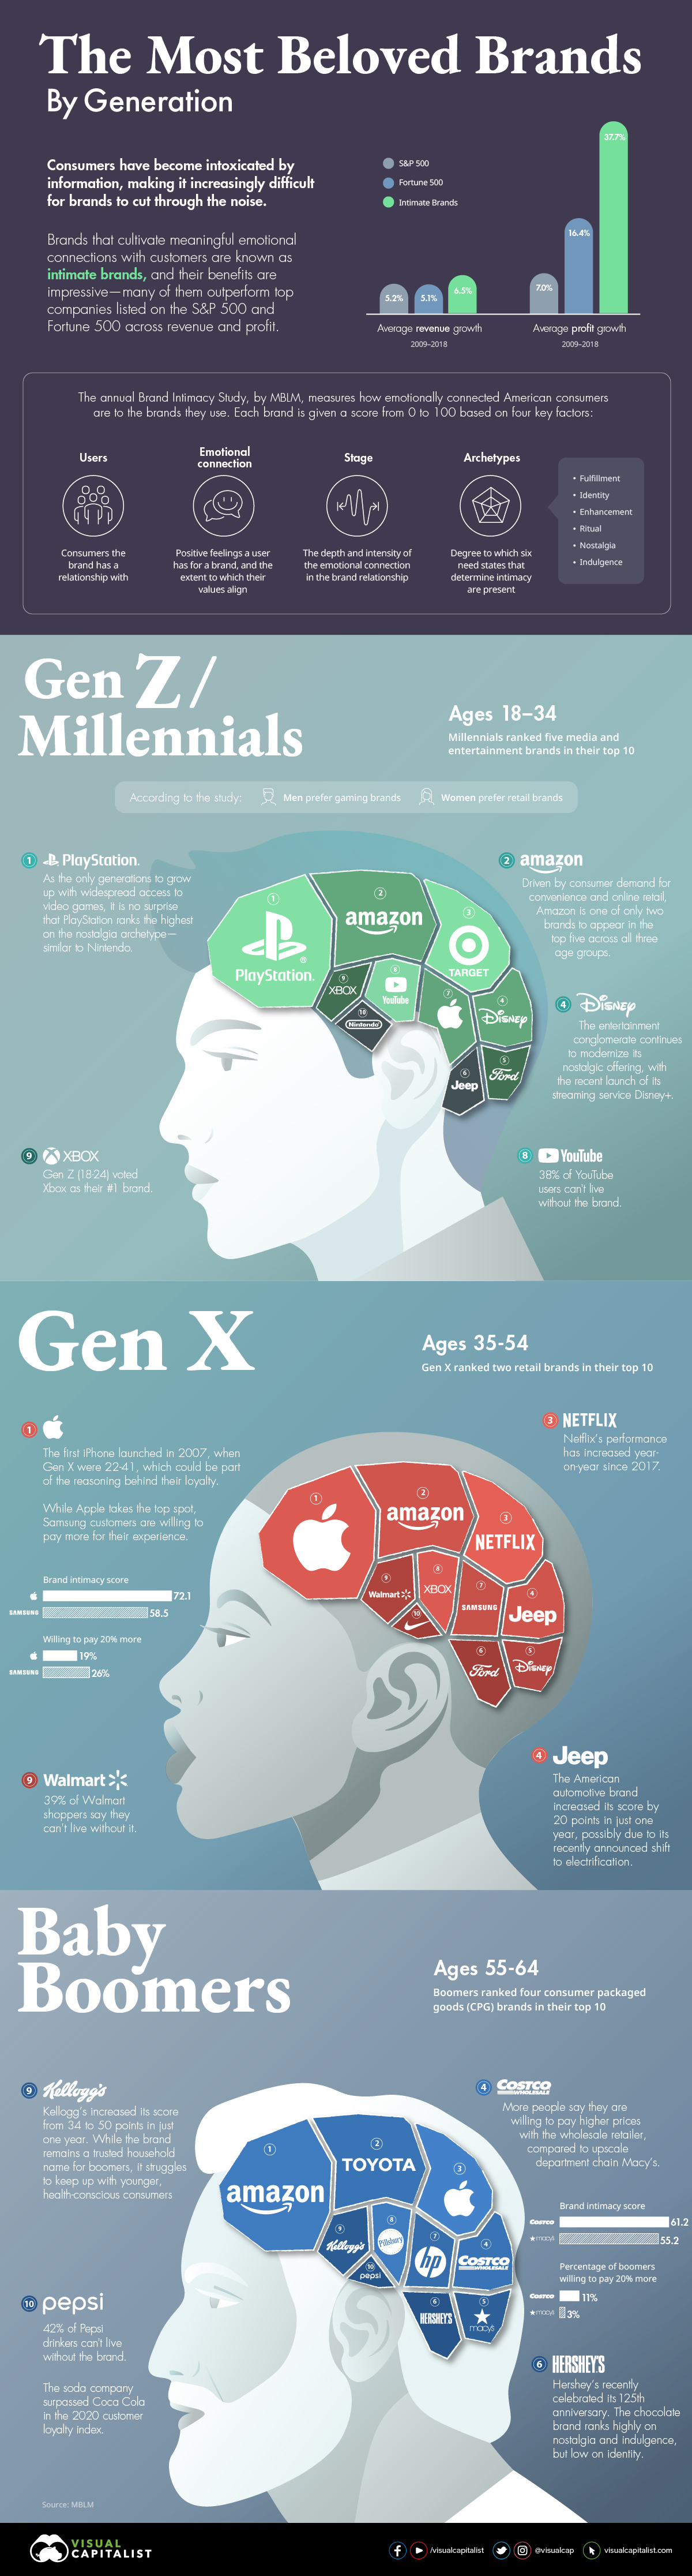
Today’s graphic pulls data from MBLM’s 2020 Brand Intimacy Report and visualizes the top 10 brands that different generations connect with the most.
Can Emotion Be Measured?
Brands that tap into consumers’ emotions can establish higher levels of trust. This in turn creates a culture of loyalty that could ensure a unique standing in the market and long-term growth.
In fact, intimate brands that have a strong emotional bond with their consumers tend to outperform top companies listed on the S&P 500 and Fortune 500 in both revenue and profit. To measure how brands emotionally connect with consumers, MBLM looked at four key factors:
- Users: The existing relationship between a brand and a consumer
- Emotional Connection: The degree of positive feelings the user has for a brand, and the extent to which their personal values align with the brand’s values
- Archetype: The six markers that are present among intimate brands, which include fulfillment, identity, enhancement, ritual, nostalgia, and indulgence
- Stage: The degree of intensity in the relationship across three phases: sharing, bonding, and fusing
- Intimacy Score: Based on these four components, a score is assigned, ranging from 0-100
The total score also reveals which brands rank the highest across different age groups. While there are some commonalities across each generation, can brands be all things to all people?
The Chosen One
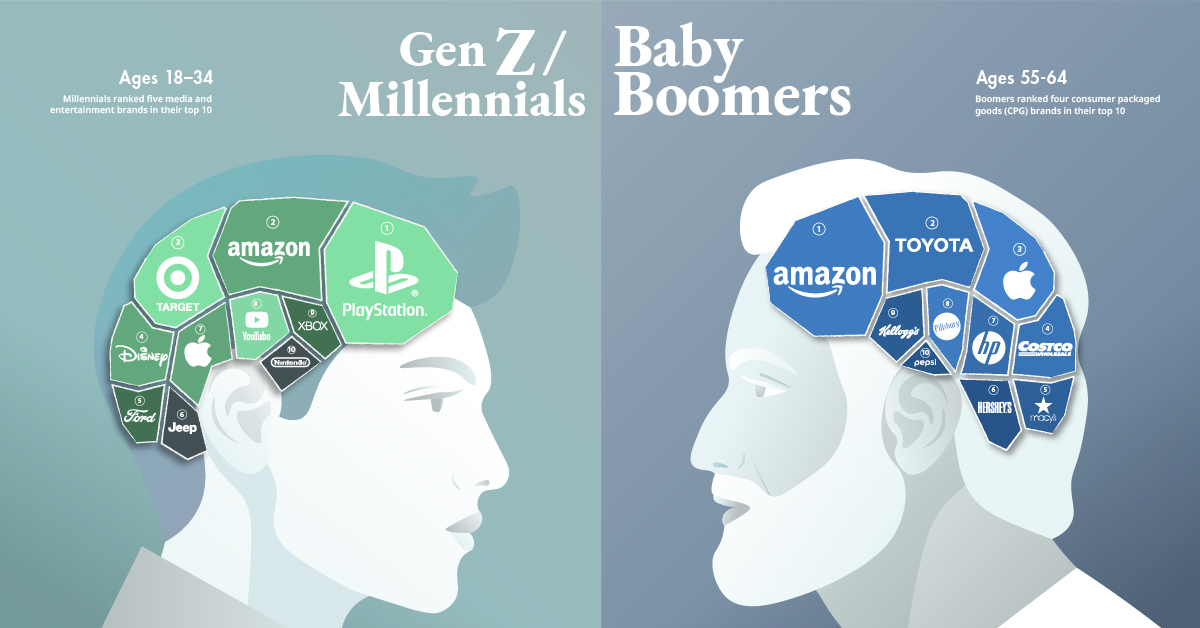
There are very few brands that have the luxury of retaining loyal customers from different age brackets. Amazon, however, manages to transcend age. The retail giant appears in the top five for Millennials, Gen X, and Baby Boomers—with the latter awarding the brand their #1 spot.
Every generation named “enhancement” as Amazon’s defining trait, meaning their lives have improved as a result of the relationship. The “ritual” trait also scored high, with users claiming the brand has become ingrained into their daily behavior.
Ranked: Top Brands by Generation
Gen Z and Millennials (18-34)
Sony-owned PlayStation holds the title for the most intimate brand among Millennials, climbing up from the 8th spot in 2019. Impressively, more than 50% of Millennials have an emotional connection to the brand, with men having a particularly strong affinity for it.
Having recently celebrated its 25th anniversary, the gaming brand’s success has been fueled by the increasing popularity of multiplayer and professional gaming, as well as new product innovation—with five of the ten best selling consoles owned by PlayStation.
| Rank | Brand | Score | Industry | |||
|---|---|---|---|---|---|---|
| #1 | PlayStation | 78.3 | Media and Entertainment | |||
| #2 | Amazon | 76.6 | Retail | |||
| #3 | Target | 68.7 | Retail | |||
| #4 | Disney | 67.8 | Media and Entertainment | |||
| #5 | Ford | 67.4 | Automotive | |||
| #6 | Jeep | 66.8 | Automotive | |||
| #7 | Apple | 65.9 | Technology | |||
| #8 | YouTube | 63.0 | Media and Entertainment | |||
| #9 | Xbox | 59.8 | Media and Entertainment | |||
| #10 | Nintendo | 56.8 | Media and Entertainment |
Interestingly, when Gen Z (18-24) are singled out, Microsoft-owned Xbox ranks as #1, increasing its score to 73.5 in 2020 from 49.7 in 2018.
Gen X (35-54)
As the generational middle child, Gen X did not grow up with the same access to technology. However, their tech adoption is almost on par with Millennials, with similar adoption rates across tablet and smartphone ownership.
It is no surprise therefore, that Apple has captured the hearts of this generation, sitting proudly in first place. When the iPhone launched in 2007, this group was between 22-41 years old, so they have likely been loyal followers of the tech brand since its earlier days.
| Rank | Brand | Score | Industry | |||
|---|---|---|---|---|---|---|
| #1 | Apple | 72.1 | Technology | |||
| #2 | Amazon | 66.8 | Retail | |||
| #3 | Netlix | 66.1 | Media and Entertainment | |||
| #4 | Jeep | 65.1 | Automotive | |||
| #5 | Disney | 65.0 | Media and Entertainment | |||
| #6 | Ford | 63.6 | Automotive | |||
| #7 | Samsung | 58.5 | Technology | |||
| #8 | Xbox | 57.0 | Media and Entertainment | |||
| #9 | Walmart | 55.2 | Retail | |||
| #10 | Nike | 54.6 | Apparel |
While this generation has no qualms about shopping online, 72% of them shop in brick and mortar stores and are satisfied with doing so—which may be part of the reason why retail giant Walmart joins Amazon in the top 10.
Baby Boomers (55-64)
Controlling almost 70% of disposable income in the U.S., Baby Boomers are arguably the most influential of all consumer groups.
While they feel the most emotionally connected to Amazon, it’s also true that Apple was another tech brand to win the affection of this age group.
| Rank | Brand | Score | Industry | |||
|---|---|---|---|---|---|---|
| #1 | Amazon | 70.0 | Retail | |||
| #2 | Toyota | 63.6 | Automotive | |||
| #3 | Apple | 61.4 | Technology | |||
| #4 | Costco | 61.2 | Retail | |||
| #5 | Macy’s | 55.2 | Retail | |||
| #6 | Hershey’s | 54.8 | Consumer Packaged Goods | |||
| #7 | Hewlett-Packard | 54.4 | Technology | |||
| #8 | Pillsbury | 51.8 | Consumer Packaged Goods | |||
| #9 | Kellogg’s | 50.0 | Consumer Packaged Goods | |||
| #10 | Pepsi | 50.0 | Consumer Packaged Goods |
This generation dominates almost 50% of consumer packaged goods (CPG) sales in the U.S.—which likely explains why the rest of their top brands are more traditional household names, such as Macy’s, Hershey’s, and Kellogg’s.
It is also clear from the ranking that this group values brands with nostalgic qualities, as well as the ability to provide them with moments of indulgence.
The Changing Brand Landscape
The brand and consumer relationship has shifted with the ages, but each generation’s unique value system has remained the most important piece of the puzzle.
It is worth noting that none of the Baby Boomer’s favorite brands appear in the ranking for those aged 18-24 (Gen Z). Are the preferences of younger generations signalling a cultural shift, in which we place more value on distraction rather than satisfaction?
Note: The 2020 Brand Intimacy Report covers an age range of 18-64. The way that the ranking is structured makes it difficult to reflect conventional demographic groups (e.g. Gen Z, the Silent Generation etc.)


Revenue
Charting Revenue: How The New York Times Makes Money
This graphic tracks the New York Times’ revenue streams over the past two decades, identifying its transition from advertising to subscription-reliant.
 Creator Program
When it comes to quality and accessible content, whether it be entertainment or news, consumers are often willing to pay for it.
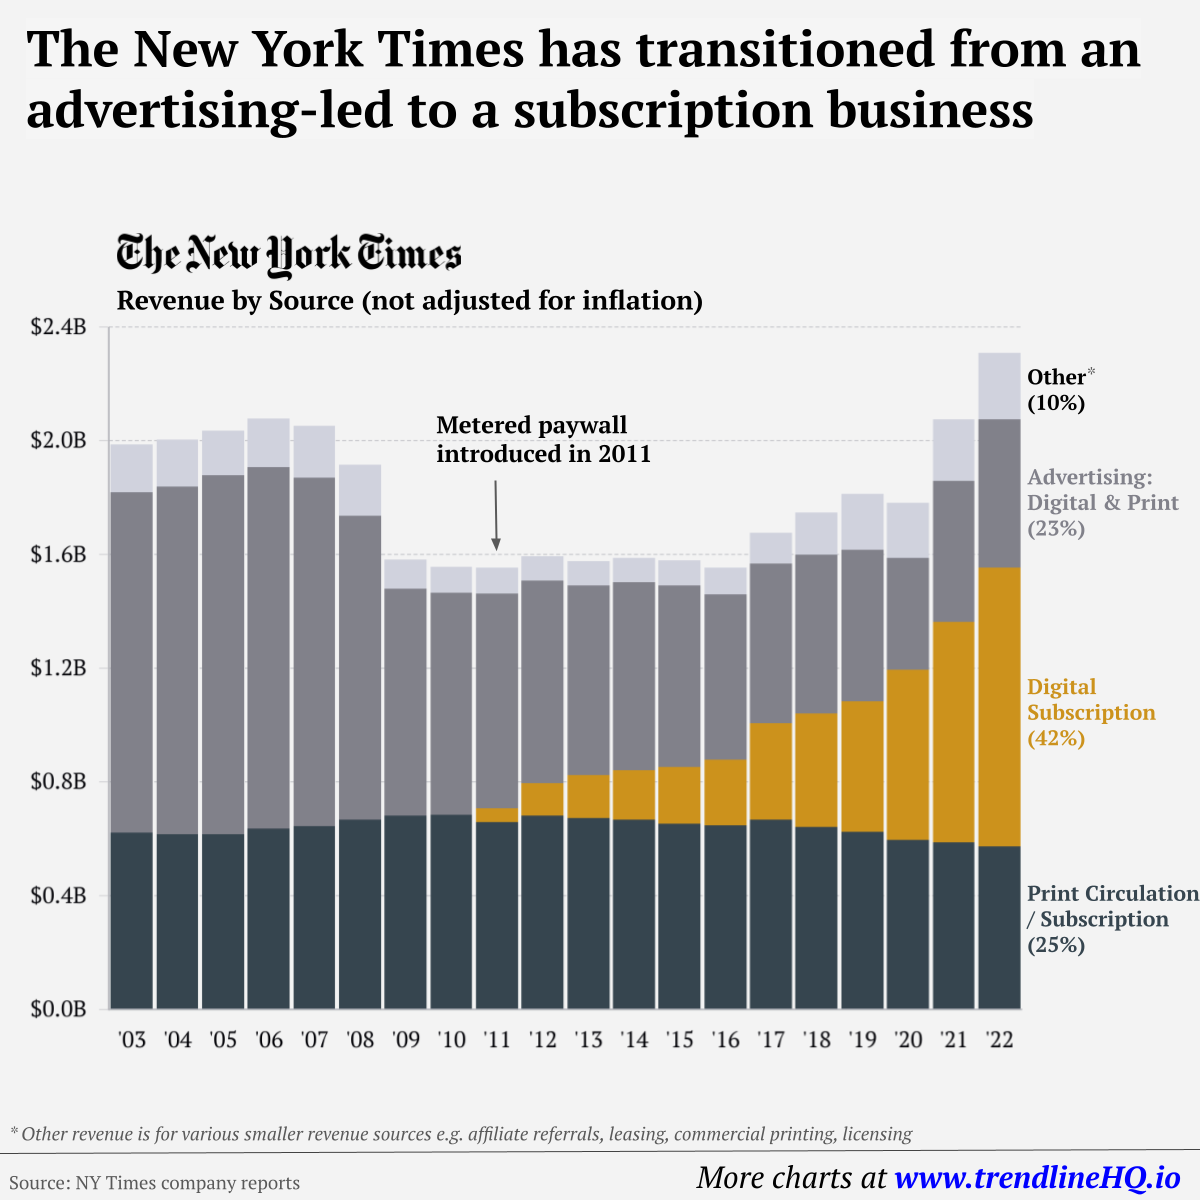
Similar to the the precedent set by the music industry, many news outlets have also been figuring out how to transition into a paid digital monetization model. Over the past decade or so, The New York Times (NY Times)—one of the world’s most iconic and widely read news organizations—has been transforming its revenue model to fit this trend.
This chart from creator Trendline uses annual reports from the The New York Times Company to visualize how this seemingly simple transition helped the organization adapt to the digital era.
The New York Times’ Revenue Transition
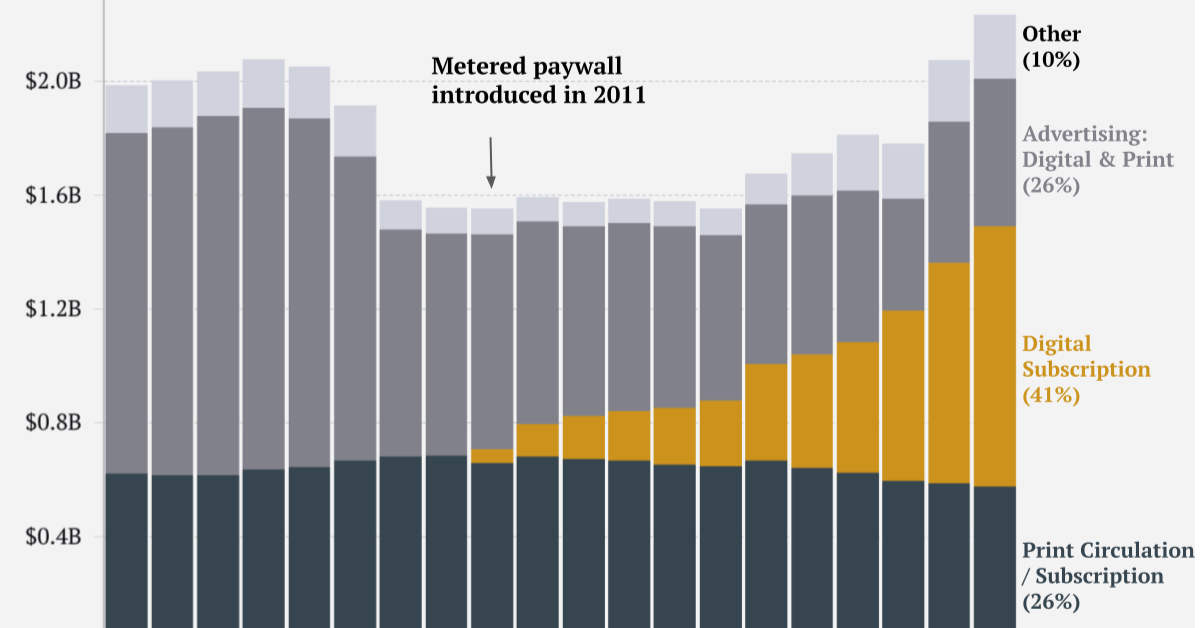
The NY Times has always been one of the world’s most-widely circulated papers. Before the launch of its digital subscription model, it earned half its revenue from print and online advertisements.
The rest of its income came in through circulation and other avenues including licensing, referrals, commercial printing, events, and so on. But after annual revenues dropped by more than $500 million from 2006 to 2010, something had to change.
| NY Revenue By Year | Print Circulation | Digital Subscription | Advertising | Other | Total |
|---|---|---|---|---|---|
| 2003 | $623M | $1,196M | $168M | $1,987M | |
| 2004 | $616M | $1,222M | $165M | $2,003M | |
| 2005 | $616M | $1,262M | $157M | $2,035M | |
| 2006 | $637M | $1,269M | $172M | $2,078M | |
| 2007 | $646M | $1,223M | $183M | $2,052M | |
| 2008 | $668M | $1,068M | $181M | $1,917M | |
| 2009 | $683M | $797M | $101M | $1,581M | |
| 2010 | $684M | $780M | $93M | $1,557M | |
| 2011 | $659M | $47M | $756M | $93M | $1,555M |
| 2012 | $681M | $114M | $712M | $88M | $1,595M |
| 2013 | $673M | $151M | $667M | $86M | $1,577M |
| 2014 | $668M | $172M | $662M | $86M | $1,588M |
| 2015 | $653M | $199M | $639M | $89M | $1,580M |
| 2016 | $647M | $232M | $581M | $94M | $1,554M |
| 2017 | $668M | $340M | $559M | $109M | $1,676M |
| 2018 | $642M | $400M | $558M | $148M | $1,748M |
| 2019 | $624M | $460M | $531M | $198M | $1,813M |
| 2020 | $597M | $598M | $392M | $196M | $1,783M |
| 2021 | $588M | $774M | $498M | $215M | $2,075M |
| 2022 | $574M | $979M | $523M | $233M | $2,308M |
In 2011, the NY Times launched its new digital subscription model and put some of its online articles behind a paywall. It bet that consumers would be willing to pay for quality content.
And while it faced a rocky start, with revenue through print circulation and advertising slowly dwindling and some consumers frustrated that once-available content was now paywalled, its income through digital subscriptions began to climb.
After digital subscription revenues first launched in 2011, they totaled to $47 million of revenue in their first year. By 2022 they had climbed to $979 million and accounted for 42% of total revenue.
Why Are Readers Paying for News?
More than half of U.S. adults subscribe to the news in some format. That (perhaps surprisingly) includes around four out of 10 adults under the age of 35.
One of the main reasons cited for this was the consistency of publications in covering a variety of news topics.
And given the NY Times’ popularity, it’s no surprise that it recently ranked as the most popular news subscription.

-

 Debt1 week ago
How Debt-to-GDP Ratios Have Changed Since 2000
-

 Markets2 weeks ago
Ranked: The World’s Top Flight Routes, by Revenue
-

 Countries2 weeks ago
Population Projections: The World’s 6 Largest Countries in 2075
-

 Markets2 weeks ago
The Top 10 States by Real GDP Growth in 2023
-

 Demographics2 weeks ago
The Smallest Gender Wage Gaps in OECD Countries
-

 United States2 weeks ago
Where U.S. Inflation Hit the Hardest in March 2024
-

 Green2 weeks ago
Top Countries By Forest Growth Since 2001
-

 United States2 weeks ago
Ranked: The Largest U.S. Corporations by Number of Employees