Inequality
Visualizing the Footprint of Highways in American Cities
Driving on the open road is a defining feature of the American experience, made possible by coast-to-coast highways. It defined a generation of life and ingrained the automobile into the urban fabric of American cities, for better and worse.
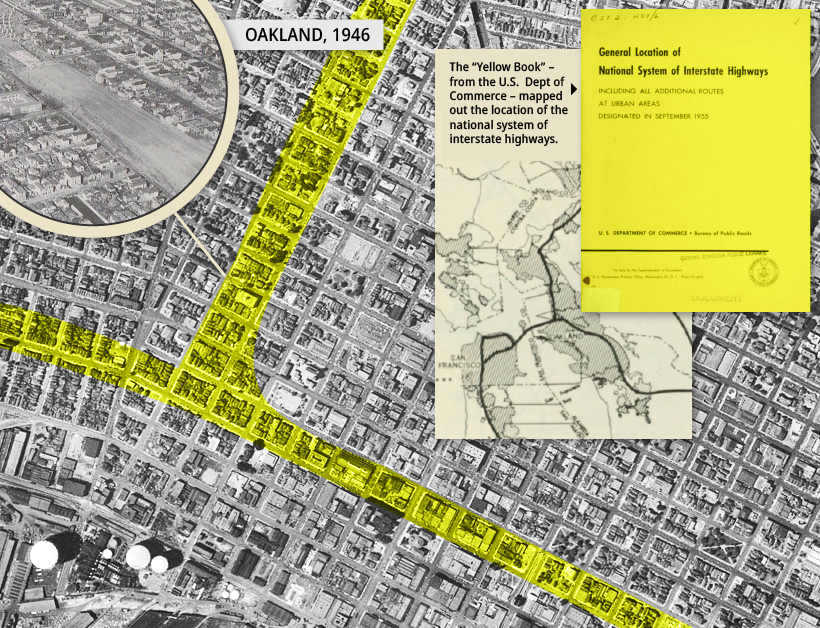
Today’s animations show how highways reshaped the downtown cores of six American cities and created new patterns of urban life. But first, some background information on the creation of the interstate system.
The Interstate Highway System
The U.S. Interstate System was created on June 29, 1956, when Dwight Eisenhower signed the Federal-Aid Highway Act. It would eventually run 46,876 miles, cost $521 billion and take 36 years to complete.
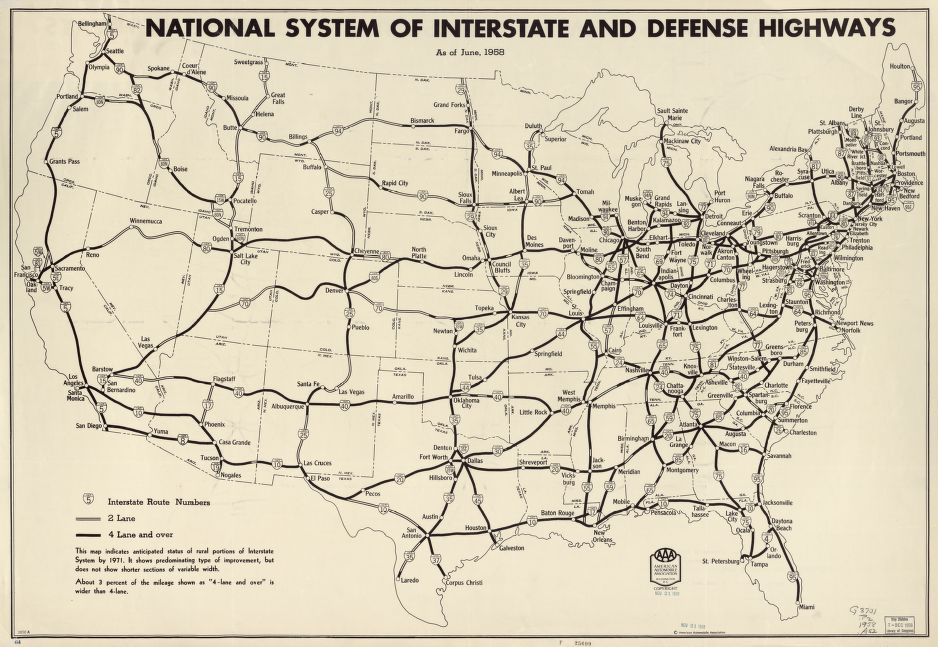
From San Diego to Bangor, the interstate highway system connected Americans and opened up the country to commerce and geographic mobility like never before, but for all its benefits, this new transportation network ripped through established patterns of urban and town life, creating a new era of urban development.
The Legacy of Highways: The Suburbs and Inner Cities
The vast geography of continental America helped to entrench personal mobility and freedom into American society. Highways and automobiles accelerated this lifestyle and even changed the shape of entire cities.
According to Prof. Nathaniel Baum-Snow of the University of Toronto, between 1950 and 1990, the population of central cities in the U.S. declined by 17% despite a population growth of 72% in larger metropolitan areas during the same period. Baum-Snow posits that, had the interstate highway system not been built, central cities’ populations would have increased 8%.
Firms followed the workers to the suburbs, but the highways system also created additional benefits for these firms. Cross-country road access freed manufacturing from ports and downtown rail hubs, while allowing economies to operate across larger distances, altering the dynamics of typical urban economies.
Faced with this new reality, inner cities struggled in years to come.
Inner Cities
The introduction of highways created an increase in the supply of land for development through faster commutes to outlying areas. In 1950, half of all jobs were located in central cities. By 1990, less than one-third of urban jobs were located in the core of American cities.
“Not TV or illegal drugs but the automobile has been the chief destroyer of American communities.” Jane Jacobs, Author The Death and Life of Great American Cities
Benefits of new development accrued to the outer areas while the construction of the highways in inner cities displaced largely low-income communities, segregated neighborhoods, increased the amount of air and noise pollution, devalued surrounding properties, and removed access to jobs for those without a car, further concentrating poverty.
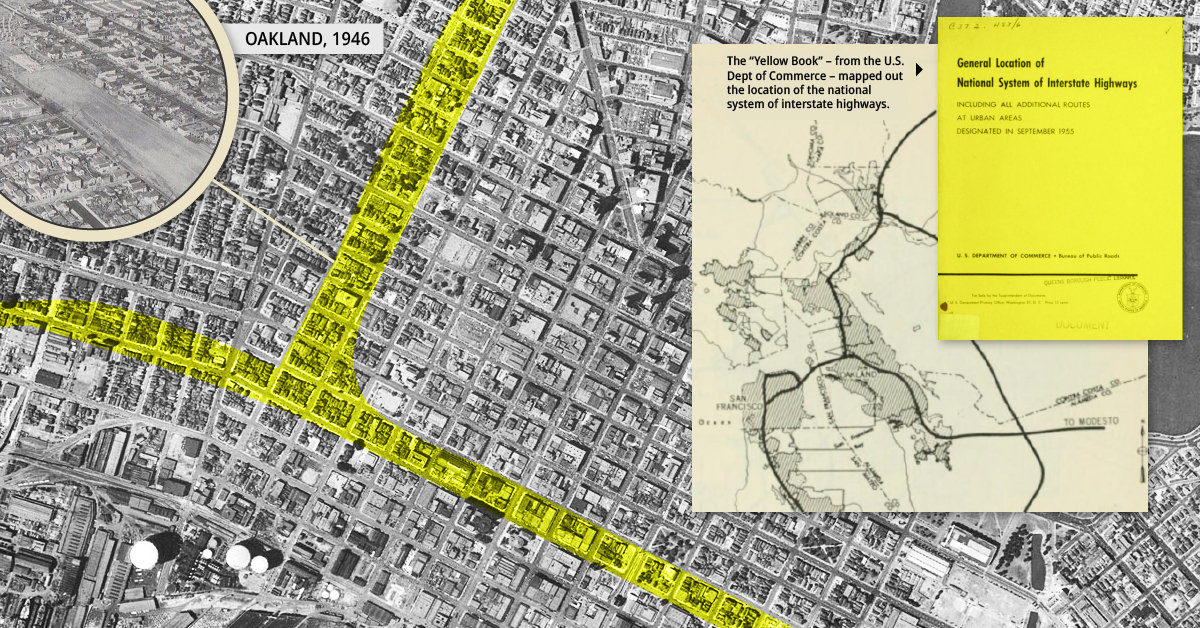
Before and After: Six American Cities
A bird’s eye view of six American cities reveals what was and what is now. By overlaying existing highways over the neighborhoods they replaced, it becomes clear how much interstate construction drastically altered America’s urban landscape.
Public opposition to the construction of I-980 was so strong that developers abandoned the project in 1971, only to complete it over a decade later.
The I-95 carved through Miami’s largely black Overtown neighborhood. The construction of a single highway cloverleaf resulted in 20 square blocks being demolished, displacing over 10,000 people in that community.
The I-95 comprised unconnected segments between 1957 and 1965 through the densest urban areas in a deliberate effort to prevent premature suburbanization and to revitalize the downtown core.
The I-71 cuts downtown Cincinnati off from its waterfront and a massive freeway interchange forced the destruction of dozens of blocks west of downtown.
Freeway construction transformed Detroit between 1951 and 2010. Previously, its downtown had been surrounded by a high-density street grid. Today, it’s totally encircled by freeways.
Rochester is one of many cities opting to undertake freeway removal projects.
As the dotted line above shows, the “moat” surrounding downtown is slowly being removed. The city used reclaimed land from the Inner Loop freeway to construct three mixed-use developments that include below-market-rate units.
The Future of Urban Living: Do Highways Matter?
A new era of living is reconsidering the impacts of these highways on urban centers. As property values rise and existing housing stock is pressured, there are growing concerns over the environmental impacts of suburban life. As a result, urban planners and residents are looking to revitalize city cores and re-purpose land occupied by burdensome slabs of highway concrete.
Since 1987, there have been more than 20 urban highway segments removed from downtown cores, neighborhoods and waterfronts, mostly in North America. The pace of removals has picked up significantly and an additional 10 highways are now planned for removal in the United States.
During the COVID-19 pandemic, American cities have seen their traffic plummet. Rush-hour trips into cities are taking nearly half the time while some are not even commuting at all.
While this situation is likely temporary, it is offering a moment for reflection of how cities operate and whether the car should be at the center of urban planning.
*Hat tip to Shane Hampton, whose 60 Years of Urban Change compilation served as inspiration for this article. Visit that page for many more examples of highway impact on cities.
Personal Finance
Where People Borrow Money From, by Country Income Level
These graphics shed light on which people borrow money from financial institutions, and which rely on friends and family for monetary help.

When making the decision to borrow money, do you turn to friends and family for financial help, or do you go to a financial institution like a bank or credit card company?
On a country-to-country basis, this choice often depends on a mix of various factors, including the availability of financial services, financial literacy, and the cultural approach to the very concept of lending itself.
In these graphics, Richie Lionell sheds some light on where people borrow money from, using the 2021 Global Findex Database published by the World Bank.
Borrowing From Financial Institutions
To compare borrowing practices across both location and income level, the dataset features survey results from respondents aged 15+ and groups countries by region except for high-income countries, which are grouped together.
In 2021, most individuals in high income economies borrowed money from formal financial institutions.
Country | Region | Borrowed from a financial institution |
---|---|---|
Canada | High income | 81.01% |
Israel | High income | 79.52% |
Iceland | High income | 73.36% |
Hong Kong SAR, China | High income | 70.01% |
Korea, Rep. | High income | 68.64% |
Norway | High income | 66.82% |
United States | High income | 66.21% |
Taiwan, China | High income | 61.95% |
Switzerland | High income | 61.40% |
Japan | High income | 61.19% |
New Zealand | High income | 60.38% |
Australia | High income | 57.29% |
Austria | High income | 56.52% |
Italy | High income | 55.01% |
United Kingdom | High income | 54.98% |
Germany | High income | 54.68% |
Ireland | High income | 54.11% |
Denmark | High income | 53.16% |
Finland | High income | 52.98% |
Spain | High income | 51.92% |
Sweden | High income | 48.69% |
Belgium | High income | 47.98% |
France | High income | 44.37% |
Singapore | High income | 42.82% |
Slovenia | High income | 42.36% |
Uruguay | High income | 42.01% |
Brazil | Latin America & Caribbean (excluding high income) | 40.75% |
China | East Asia & Pacific (excluding high income) | 39.19% |
Malta | High income | 38.95% |
Türkiye | Europe & Central Asia (excluding high income) | 37.84% |
Netherlands | High income | 34.45% |
Slovak Republic | High income | 34.41% |
Mongolia | East Asia & Pacific (excluding high income) | 34.39% |
Ukraine | Europe & Central Asia (excluding high income) | 34.13% |
Estonia | High income | 33.64% |
Croatia | High income | 33.03% |
Saudi Arabia | High income | 32.38% |
Poland | High income | 31.92% |
Czech Republic | High income | 31.33% |
Cyprus | High income | 31.25% |
Cambodia | East Asia & Pacific (excluding high income) | 30.89% |
Argentina | Latin America & Caribbean (excluding high income) | 30.81% |
Portugal | High income | 30.44% |
Kazakhstan | Europe & Central Asia (excluding high income) | 29.76% |
Russian Federation | Europe & Central Asia (excluding high income) | 29.75% |
Thailand | East Asia & Pacific (excluding high income) | 28.26% |
Bulgaria | Europe & Central Asia (excluding high income) | 26.36% |
Armenia | Europe & Central Asia (excluding high income) | 26.17% |
Iran, Islamic Rep. | Middle East & North Africa (excluding high income) | 25.11% |
Chile | High income | 24.20% |
Georgia | Europe & Central Asia (excluding high income) | 23.89% |
Ecuador | Latin America & Caribbean (excluding high income) | 23.23% |
Latvia | High income | 22.74% |
United Arab Emirates | High income | 22.46% |
Kenya | Sub-Saharan Africa (excluding high income) | 22.18% |
North Macedonia | Europe & Central Asia (excluding high income) | 22.10% |
Peru | Latin America & Caribbean (excluding high income) | 21.95% |
Dominican Republic | Latin America & Caribbean (excluding high income) | 21.65% |
Bosnia and Herzegovina | Europe & Central Asia (excluding high income) | 21.30% |
Sri Lanka | South Asia | 21.29% |
Namibia | Sub-Saharan Africa (excluding high income) | 20.97% |
Serbia | Europe & Central Asia (excluding high income) | 20.65% |
Greece | High income | 20.11% |
Mauritius | Sub-Saharan Africa (excluding high income) | 20.09% |
Bolivia | Latin America & Caribbean (excluding high income) | 19.30% |
Romania | Europe & Central Asia (excluding high income) | 19.14% |
Hungary | High income | 18.93% |
Uganda | Sub-Saharan Africa (excluding high income) | 18.62% |
South Africa | Sub-Saharan Africa (excluding high income) | 18.22% |
Colombia | Latin America & Caribbean (excluding high income) | 18.10% |
Kyrgyz Republic | Europe & Central Asia (excluding high income) | 17.73% |
Kosovo | Europe & Central Asia (excluding high income) | 17.61% |
Costa Rica | Latin America & Caribbean (excluding high income) | 17.46% |
Philippines | East Asia & Pacific (excluding high income) | 17.45% |
Liberia | Sub-Saharan Africa (excluding high income) | 15.42% |
Bangladesh | South Asia | 14.22% |
Nepal | South Asia | 14.11% |
Malaysia | East Asia & Pacific (excluding high income) | 13.48% |
Albania | Europe & Central Asia (excluding high income) | 13.39% |
Moldova | Europe & Central Asia (excluding high income) | 13.18% |
Indonesia | East Asia & Pacific (excluding high income) | 12.86% |
Tajikistan | Europe & Central Asia (excluding high income) | 12.43% |
Paraguay | Latin America & Caribbean (excluding high income) | 12.39% |
Nicaragua | Latin America & Caribbean (excluding high income) | 12.19% |
Jamaica | Latin America & Caribbean (excluding high income) | 12.04% |
Lithuania | High income | 11.95% |
India | South Asia | 11.79% |
Mali | Sub-Saharan Africa (excluding high income) | 10.99% |
El Salvador | Latin America & Caribbean (excluding high income) | 10.56% |
Panama | Latin America & Caribbean (excluding high income) | 10.39% |
Honduras | Latin America & Caribbean (excluding high income) | 10.32% |
Mozambique | Sub-Saharan Africa (excluding high income) | 10.27% |
Senegal | Sub-Saharan Africa (excluding high income) | 9.98% |
Tunisia | Middle East & North Africa (excluding high income) | 9.89% |
Jordan | Middle East & North Africa (excluding high income) | 9.86% |
Lao PDR | East Asia & Pacific (excluding high income) | 9.15% |
Venezuela, RB | Latin America & Caribbean (excluding high income) | 8.83% |
Benin | Sub-Saharan Africa (excluding high income) | 8.21% |
Malawi | Sub-Saharan Africa (excluding high income) | 7.99% |
Uzbekistan | Europe & Central Asia (excluding high income) | 7.50% |
Togo | Sub-Saharan Africa (excluding high income) | 7.42% |
Ghana | Sub-Saharan Africa (excluding high income) | 7.40% |
Egypt, Arab Rep. | Middle East & North Africa (excluding high income) | 7.30% |
Myanmar | East Asia & Pacific (excluding high income) | 7.06% |
Cameroon | Sub-Saharan Africa (excluding high income) | 6.99% |
Zambia | Sub-Saharan Africa (excluding high income) | 6.76% |
Burkina Faso | Sub-Saharan Africa (excluding high income) | 6.66% |
Nigeria | Sub-Saharan Africa (excluding high income) | 6.40% |
Congo, Rep. | Sub-Saharan Africa (excluding high income) | 6.19% |
Guinea | Sub-Saharan Africa (excluding high income) | 6.11% |
Gabon | Sub-Saharan Africa (excluding high income) | 5.48% |
Morocco | Middle East & North Africa (excluding high income) | 4.99% |
West Bank and Gaza | Middle East & North Africa (excluding high income) | 4.94% |
Tanzania | Sub-Saharan Africa (excluding high income) | 4.45% |
Sierra Leone | Sub-Saharan Africa (excluding high income) | 4.29% |
Cote d'Ivoire | Sub-Saharan Africa (excluding high income) | 4.10% |
Algeria | Middle East & North Africa (excluding high income) | 3.80% |
Iraq | Middle East & North Africa (excluding high income) | 3.64% |
Pakistan | South Asia | 3.51% |
Lebanon | Middle East & North Africa (excluding high income) | 3.31% |
Zimbabwe | Sub-Saharan Africa (excluding high income) | 2.89% |
South Sudan | Sub-Saharan Africa (excluding high income) | 2.48% |
Afghanistan | South Asia | 2.05% |
With 81% of respondents borrowing from financial institutions, Canada tops this list. Meanwhile, Israel (80%), Iceland (73%), Hong Kong (70%), and South Korea (69%) are not far behind.
This is not surprising for richer nations, as financial services in these countries are more available and accessible. This, coupled with higher financial literacy, including a general understanding of interest rates and credit-building opportunities, contribute to the popularity of financial institutions.
Also, it’s worth noting that some countries have cultural practices that factor in. For example, 61% of respondents in Japan used formal financial institutions, which are a more socially acceptable option than asking to borrow money from friends and family (just 6% of people in Japan).
Borrowing from Friends and Family
In contrast, more individuals in lower income economies approached family and friends in order to borrow money.
Afghanistan tops this list with 60% of respondents relying on friends and family, compared to only 2% borrowing money from formal financial institutions.
Country | Region | Borrowed from family or friends |
---|---|---|
Afghanistan | South Asia | 60.18% |
Uganda | Sub-Saharan Africa (excluding high income) | 57.45% |
Kenya | Sub-Saharan Africa (excluding high income) | 54.40% |
Namibia | Sub-Saharan Africa (excluding high income) | 50.25% |
Morocco | Middle East & North Africa (excluding high income) | 48.73% |
Nigeria | Sub-Saharan Africa (excluding high income) | 44.71% |
South Africa | Sub-Saharan Africa (excluding high income) | 44.54% |
Iraq | Middle East & North Africa (excluding high income) | 44.10% |
Cameroon | Sub-Saharan Africa (excluding high income) | 43.49% |
Zambia | Sub-Saharan Africa (excluding high income) | 43.08% |
Zimbabwe | Sub-Saharan Africa (excluding high income) | 42.34% |
Guinea | Sub-Saharan Africa (excluding high income) | 42.04% |
Nepal | South Asia | 41.79% |
Jordan | Middle East & North Africa (excluding high income) | 41.76% |
Gabon | Sub-Saharan Africa (excluding high income) | 41.41% |
Liberia | Sub-Saharan Africa (excluding high income) | 41.37% |
Tunisia | Middle East & North Africa (excluding high income) | 41.05% |
Philippines | East Asia & Pacific (excluding high income) | 40.82% |
Türkiye | Europe & Central Asia (excluding high income) | 40.80% |
Iran, Islamic Rep. | Middle East & North Africa (excluding high income) | 39.80% |
Sierra Leone | Sub-Saharan Africa (excluding high income) | 39.02% |
Ghana | Sub-Saharan Africa (excluding high income) | 38.58% |
Egypt, Arab Rep. | Middle East & North Africa (excluding high income) | 37.75% |
Saudi Arabia | High income | 35.76% |
Bangladesh | South Asia | 35.49% |
Mali | Sub-Saharan Africa (excluding high income) | 35.15% |
Burkina Faso | Sub-Saharan Africa (excluding high income) | 35.14% |
Cambodia | East Asia & Pacific (excluding high income) | 34.85% |
Venezuela, RB | Latin America & Caribbean (excluding high income) | 34.81% |
Togo | Sub-Saharan Africa (excluding high income) | 33.99% |
West Bank and Gaza | Middle East & North Africa (excluding high income) | 33.93% |
Thailand | East Asia & Pacific (excluding high income) | 32.83% |
Lao PDR | East Asia & Pacific (excluding high income) | 32.36% |
Moldova | Europe & Central Asia (excluding high income) | 32.18% |
Ukraine | Europe & Central Asia (excluding high income) | 32.17% |
Senegal | Sub-Saharan Africa (excluding high income) | 31.30% |
Armenia | Europe & Central Asia (excluding high income) | 31.29% |
India | South Asia | 31.02% |
Bolivia | Latin America & Caribbean (excluding high income) | 30.69% |
Algeria | Middle East & North Africa (excluding high income) | 30.52% |
Cote d'Ivoire | Sub-Saharan Africa (excluding high income) | 30.20% |
Albania | Europe & Central Asia (excluding high income) | 30.00% |
Bulgaria | Europe & Central Asia (excluding high income) | 29.99% |
Benin | Sub-Saharan Africa (excluding high income) | 29.33% |
Mozambique | Sub-Saharan Africa (excluding high income) | 29.33% |
Tanzania | Sub-Saharan Africa (excluding high income) | 29.24% |
Colombia | Latin America & Caribbean (excluding high income) | 29.08% |
Indonesia | East Asia & Pacific (excluding high income) | 28.85% |
South Sudan | Sub-Saharan Africa (excluding high income) | 28.84% |
Ecuador | Latin America & Caribbean (excluding high income) | 28.79% |
Serbia | Europe & Central Asia (excluding high income) | 28.49% |
Russian Federation | Europe & Central Asia (excluding high income) | 28.40% |
Mongolia | East Asia & Pacific (excluding high income) | 27.01% |
Kyrgyz Republic | Europe & Central Asia (excluding high income) | 27.01% |
China | East Asia & Pacific (excluding high income) | 26.43% |
Honduras | Latin America & Caribbean (excluding high income) | 26.07% |
Greece | High income | 25.94% |
Kosovo | Europe & Central Asia (excluding high income) | 25.86% |
Argentina | Latin America & Caribbean (excluding high income) | 25.72% |
Kazakhstan | Europe & Central Asia (excluding high income) | 25.64% |
Romania | Europe & Central Asia (excluding high income) | 25.58% |
Malawi | Sub-Saharan Africa (excluding high income) | 25.24% |
North Macedonia | Europe & Central Asia (excluding high income) | 25.14% |
Dominican Republic | Latin America & Caribbean (excluding high income) | 24.70% |
Brazil | Latin America & Caribbean (excluding high income) | 24.66% |
Congo, Rep. | Sub-Saharan Africa (excluding high income) | 24.40% |
Lebanon | Middle East & North Africa (excluding high income) | 24.26% |
Nicaragua | Latin America & Caribbean (excluding high income) | 23.75% |
Iceland | High income | 23.63% |
Peru | Latin America & Caribbean (excluding high income) | 23.34% |
United Arab Emirates | High income | 23.04% |
Myanmar | East Asia & Pacific (excluding high income) | 23.03% |
Sri Lanka | South Asia | 22.53% |
Paraguay | Latin America & Caribbean (excluding high income) | 22.20% |
Pakistan | South Asia | 21.87% |
Uzbekistan | Europe & Central Asia (excluding high income) | 21.53% |
Cyprus | High income | 20.95% |
Bosnia and Herzegovina | Europe & Central Asia (excluding high income) | 20.94% |
Chile | High income | 20.72% |
Georgia | Europe & Central Asia (excluding high income) | 20.61% |
Mauritius | Sub-Saharan Africa (excluding high income) | 20.48% |
Costa Rica | Latin America & Caribbean (excluding high income) | 20.29% |
Jamaica | Latin America & Caribbean (excluding high income) | 20.02% |
Tajikistan | Europe & Central Asia (excluding high income) | 19.86% |
Poland | High income | 19.34% |
Norway | High income | 19.29% |
United States | High income | 18.09% |
Uruguay | High income | 17.60% |
Panama | Latin America & Caribbean (excluding high income) | 17.54% |
Denmark | High income | 17.51% |
Croatia | High income | 17.09% |
El Salvador | Latin America & Caribbean (excluding high income) | 16.78% |
Slovenia | High income | 16.77% |
Latvia | High income | 16.57% |
Australia | High income | 16.44% |
Estonia | High income | 15.74% |
Malaysia | East Asia & Pacific (excluding high income) | 15.44% |
Israel | High income | 15.43% |
New Zealand | High income | 15.19% |
Slovak Republic | High income | 15.02% |
Germany | High income | 15.01% |
Austria | High income | 14.41% |
Canada | High income | 14.00% |
Finland | High income | 13.43% |
Czech Republic | High income | 13.41% |
Korea, Rep. | High income | 13.16% |
Malta | High income | 12.99% |
Belgium | High income | 12.13% |
Sweden | High income | 11.79% |
Hungary | High income | 11.15% |
Lithuania | High income | 10.65% |
Spain | High income | 10.44% |
France | High income | 10.42% |
Netherlands | High income | 10.24% |
Ireland | High income | 9.84% |
Taiwan, China | High income | 9.70% |
Portugal | High income | 8.22% |
Hong Kong SAR, China | High income | 7.59% |
Japan | High income | 6.43% |
Switzerland | High income | 6.10% |
United Kingdom | High income | 5.24% |
Italy | High income | 5.06% |
Singapore | High income | 1.89% |
Many individuals in African countries including Uganda (57%), Kenya (54%), Namibia (50%), and Morocco (49%) also are choosing to borrow money from friends and family over financial institutions.
These preferences can be attributed to various factors including a lack of trust in banking and financial institutions, lacking access to such services, or the lack of information about such services if they are available.
And in some societies, borrowing from friends and family can be seen as a cultural norm, especially in places where mutual support and solidarity play a strong role.
What’s Next?
As viewed by the World Bank, financial inclusion is an important foundation of any nation’s development, and it’s also one of the UN’s Sustainable Development Goals. Increasing levels of financial inclusion helps give people access to services like savings plans, credit avenues, and online payments and transactions.
And thanks to commitments from countries and financial systems, global ownership of banking accounts has increased significantly (and been further spurred by the COVID-19 pandemic). According to the Global Findex Database, bank account ownership has risen to 76% in 2021, up from just 51% a decade prior.
However, access to these services is still rife with gaps when it comes to low income nations, low income individuals, and unequal access based on gender. The future of borrowing now relies on how nations deal with these challenges.
-
Wealth3 weeks ago
Ranked: The World’s Top 50 Endowment Funds
-
Green5 days ago
Ranked: The 20 Most Air-Polluted Cities on Earth
-
United States3 weeks ago
Charting the Rise of America’s Debt Ceiling
-
Stocks3 days ago
Ranked: America’s Largest Semiconductor Companies
-
China3 weeks ago
Ranked: The Cities with the Most Skyscrapers in 2023
-
Markets3 days ago
The Fastest Rising Asset Classes in 2023
-
Mining3 weeks ago
Ranked: The World’s Biggest Steel Producers, by Country
-
Markets2 days ago
Mapped: The State of Economic Freedom in 2023