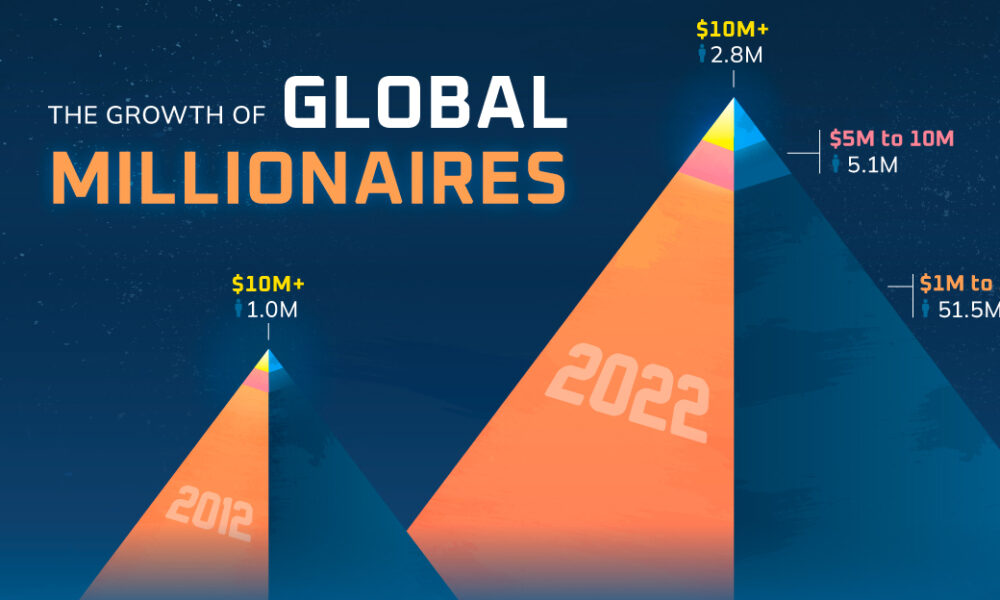
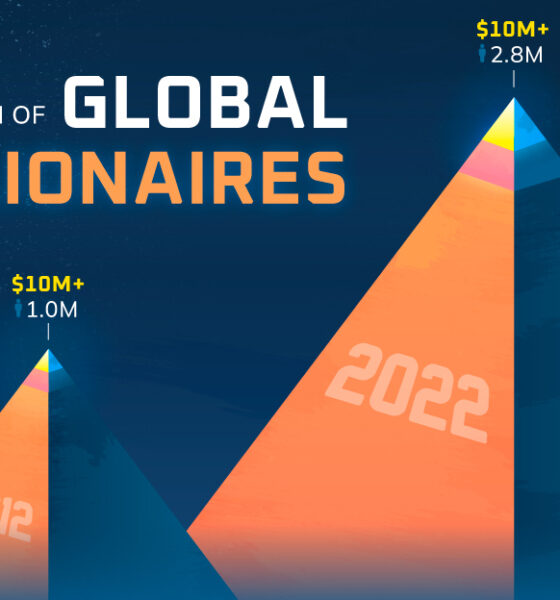
The world's millionaire population has more than doubled in the last decade between 2012 and 2022. We visualize these numbers...
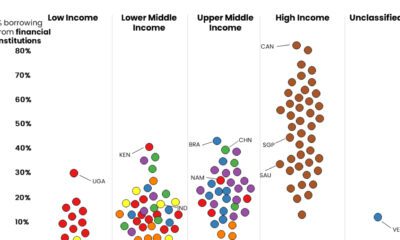

These graphics shed light on which people borrow money from financial institutions, and which rely on friends and family for monetary help.


Analyzing 2023 per capita GDP numbers from the International Monetary Fund lets us know where the richest countries in the world are.


Analyzing 2023 per capita GDP numbers from the International Monetary Fund lets us know where the poorest countries are.


This infographic shows the net minimum wage across 67 countries, as of January 2023. A breakdown by U.S. state is also included.


From New York to Damascus, this infographic uses EIU cost of living data to rank the world's most and least expensive cities to live in


America is home to the most billionaires in the world. But which billionaire is the richest in each state?


This graphic compares the cost of living and purchasing power of 578 cities worldwide, using New York City as a benchmark for comparison.
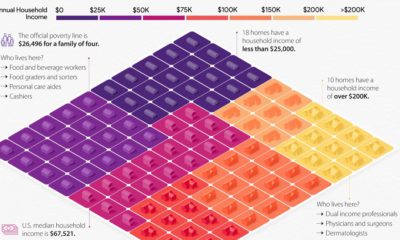

This visual breaks down U.S. household income categories as 100 homes, based on the most recent data from the U.S. Census Bureau.
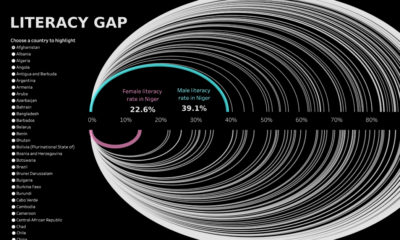

Global literacy rates have increased in the last few decades, but some countries are still lagging behind, especially in Sub-Saharan Africa.


 Creator Program