Personal Finance
Where People Borrow Money From, by Country Income Level
Article/Editing:
When making the decision to borrow money, do you turn to friends and family for financial help, or do you go to a financial institution like a bank or credit card company?
On a country-to-country basis, this choice often depends on a mix of various factors, including the availability of financial services, financial literacy, and the cultural approach to the very concept of lending itself.
In these graphics, Richie Lionell sheds some light on where people borrow money from, using the 2021 Global Findex Database published by the World Bank.
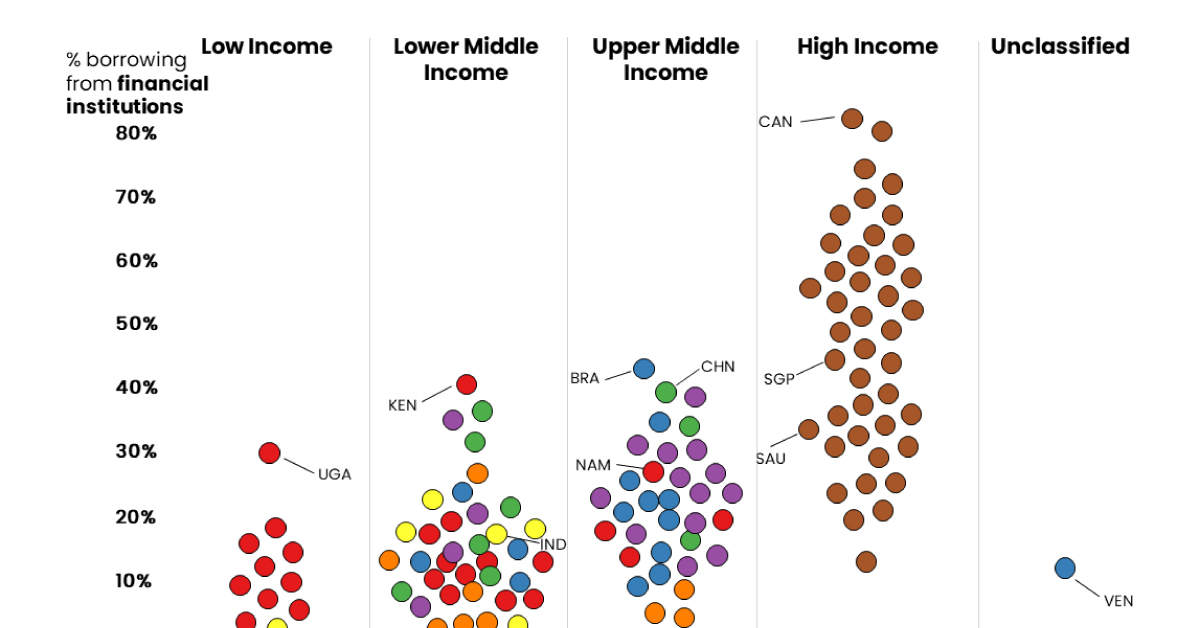
Borrowing From Financial Institutions
To compare borrowing practices across both location and income level, the dataset features survey results from respondents aged 15+ and groups countries by region except for high-income countries, which are grouped together.
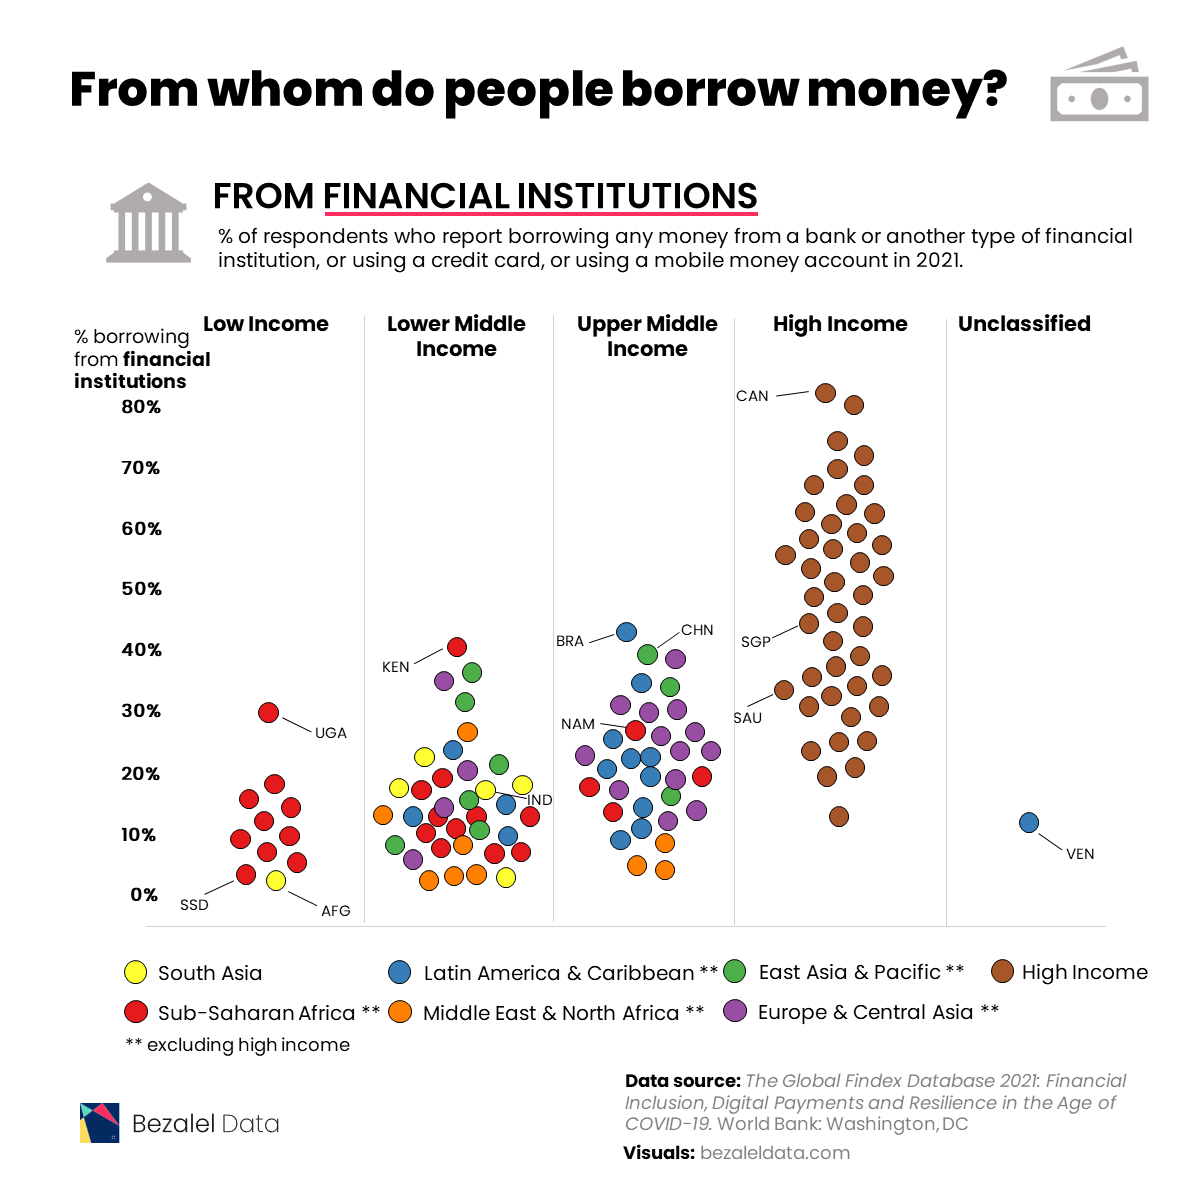
In 2021, most individuals in high income economies borrowed money from formal financial institutions.
| Country | Region | Borrowed from a financial institution |
|---|---|---|
| Canada | High income | 81.01% |
| Israel | High income | 79.52% |
| Iceland | High income | 73.36% |
| Hong Kong SAR, China | High income | 70.01% |
| Korea, Rep. | High income | 68.64% |
| Norway | High income | 66.82% |
| United States | High income | 66.21% |
| Taiwan, China | High income | 61.95% |
| Switzerland | High income | 61.40% |
| Japan | High income | 61.19% |
| New Zealand | High income | 60.38% |
| Australia | High income | 57.29% |
| Austria | High income | 56.52% |
| Italy | High income | 55.01% |
| United Kingdom | High income | 54.98% |
| Germany | High income | 54.68% |
| Ireland | High income | 54.11% |
| Denmark | High income | 53.16% |
| Finland | High income | 52.98% |
| Spain | High income | 51.92% |
| Sweden | High income | 48.69% |
| Belgium | High income | 47.98% |
| France | High income | 44.37% |
| Singapore | High income | 42.82% |
| Slovenia | High income | 42.36% |
| Uruguay | High income | 42.01% |
| Brazil | Latin America & Caribbean (excluding high income) | 40.75% |
| China | East Asia & Pacific (excluding high income) | 39.19% |
| Malta | High income | 38.95% |
| Türkiye | Europe & Central Asia (excluding high income) | 37.84% |
| Netherlands | High income | 34.45% |
| Slovak Republic | High income | 34.41% |
| Mongolia | East Asia & Pacific (excluding high income) | 34.39% |
| Ukraine | Europe & Central Asia (excluding high income) | 34.13% |
| Estonia | High income | 33.64% |
| Croatia | High income | 33.03% |
| Saudi Arabia | High income | 32.38% |
| Poland | High income | 31.92% |
| Czech Republic | High income | 31.33% |
| Cyprus | High income | 31.25% |
| Cambodia | East Asia & Pacific (excluding high income) | 30.89% |
| Argentina | Latin America & Caribbean (excluding high income) | 30.81% |
| Portugal | High income | 30.44% |
| Kazakhstan | Europe & Central Asia (excluding high income) | 29.76% |
| Russian Federation | Europe & Central Asia (excluding high income) | 29.75% |
| Thailand | East Asia & Pacific (excluding high income) | 28.26% |
| Bulgaria | Europe & Central Asia (excluding high income) | 26.36% |
| Armenia | Europe & Central Asia (excluding high income) | 26.17% |
| Iran, Islamic Rep. | Middle East & North Africa (excluding high income) | 25.11% |
| Chile | High income | 24.20% |
| Georgia | Europe & Central Asia (excluding high income) | 23.89% |
| Ecuador | Latin America & Caribbean (excluding high income) | 23.23% |
| Latvia | High income | 22.74% |
| United Arab Emirates | High income | 22.46% |
| Kenya | Sub-Saharan Africa (excluding high income) | 22.18% |
| North Macedonia | Europe & Central Asia (excluding high income) | 22.10% |
| Peru | Latin America & Caribbean (excluding high income) | 21.95% |
| Dominican Republic | Latin America & Caribbean (excluding high income) | 21.65% |
| Bosnia and Herzegovina | Europe & Central Asia (excluding high income) | 21.30% |
| Sri Lanka | South Asia | 21.29% |
| Namibia | Sub-Saharan Africa (excluding high income) | 20.97% |
| Serbia | Europe & Central Asia (excluding high income) | 20.65% |
| Greece | High income | 20.11% |
| Mauritius | Sub-Saharan Africa (excluding high income) | 20.09% |
| Bolivia | Latin America & Caribbean (excluding high income) | 19.30% |
| Romania | Europe & Central Asia (excluding high income) | 19.14% |
| Hungary | High income | 18.93% |
| Uganda | Sub-Saharan Africa (excluding high income) | 18.62% |
| South Africa | Sub-Saharan Africa (excluding high income) | 18.22% |
| Colombia | Latin America & Caribbean (excluding high income) | 18.10% |
| Kyrgyz Republic | Europe & Central Asia (excluding high income) | 17.73% |
| Kosovo | Europe & Central Asia (excluding high income) | 17.61% |
| Costa Rica | Latin America & Caribbean (excluding high income) | 17.46% |
| Philippines | East Asia & Pacific (excluding high income) | 17.45% |
| Liberia | Sub-Saharan Africa (excluding high income) | 15.42% |
| Bangladesh | South Asia | 14.22% |
| Nepal | South Asia | 14.11% |
| Malaysia | East Asia & Pacific (excluding high income) | 13.48% |
| Albania | Europe & Central Asia (excluding high income) | 13.39% |
| Moldova | Europe & Central Asia (excluding high income) | 13.18% |
| Indonesia | East Asia & Pacific (excluding high income) | 12.86% |
| Tajikistan | Europe & Central Asia (excluding high income) | 12.43% |
| Paraguay | Latin America & Caribbean (excluding high income) | 12.39% |
| Nicaragua | Latin America & Caribbean (excluding high income) | 12.19% |
| Jamaica | Latin America & Caribbean (excluding high income) | 12.04% |
| Lithuania | High income | 11.95% |
| India | South Asia | 11.79% |
| Mali | Sub-Saharan Africa (excluding high income) | 10.99% |
| El Salvador | Latin America & Caribbean (excluding high income) | 10.56% |
| Panama | Latin America & Caribbean (excluding high income) | 10.39% |
| Honduras | Latin America & Caribbean (excluding high income) | 10.32% |
| Mozambique | Sub-Saharan Africa (excluding high income) | 10.27% |
| Senegal | Sub-Saharan Africa (excluding high income) | 9.98% |
| Tunisia | Middle East & North Africa (excluding high income) | 9.89% |
| Jordan | Middle East & North Africa (excluding high income) | 9.86% |
| Lao PDR | East Asia & Pacific (excluding high income) | 9.15% |
| Venezuela, RB | Latin America & Caribbean (excluding high income) | 8.83% |
| Benin | Sub-Saharan Africa (excluding high income) | 8.21% |
| Malawi | Sub-Saharan Africa (excluding high income) | 7.99% |
| Uzbekistan | Europe & Central Asia (excluding high income) | 7.50% |
| Togo | Sub-Saharan Africa (excluding high income) | 7.42% |
| Ghana | Sub-Saharan Africa (excluding high income) | 7.40% |
| Egypt, Arab Rep. | Middle East & North Africa (excluding high income) | 7.30% |
| Myanmar | East Asia & Pacific (excluding high income) | 7.06% |
| Cameroon | Sub-Saharan Africa (excluding high income) | 6.99% |
| Zambia | Sub-Saharan Africa (excluding high income) | 6.76% |
| Burkina Faso | Sub-Saharan Africa (excluding high income) | 6.66% |
| Nigeria | Sub-Saharan Africa (excluding high income) | 6.40% |
| Congo, Rep. | Sub-Saharan Africa (excluding high income) | 6.19% |
| Guinea | Sub-Saharan Africa (excluding high income) | 6.11% |
| Gabon | Sub-Saharan Africa (excluding high income) | 5.48% |
| Morocco | Middle East & North Africa (excluding high income) | 4.99% |
| West Bank and Gaza | Middle East & North Africa (excluding high income) | 4.94% |
| Tanzania | Sub-Saharan Africa (excluding high income) | 4.45% |
| Sierra Leone | Sub-Saharan Africa (excluding high income) | 4.29% |
| Cote d'Ivoire | Sub-Saharan Africa (excluding high income) | 4.10% |
| Algeria | Middle East & North Africa (excluding high income) | 3.80% |
| Iraq | Middle East & North Africa (excluding high income) | 3.64% |
| Pakistan | South Asia | 3.51% |
| Lebanon | Middle East & North Africa (excluding high income) | 3.31% |
| Zimbabwe | Sub-Saharan Africa (excluding high income) | 2.89% |
| South Sudan | Sub-Saharan Africa (excluding high income) | 2.48% |
| Afghanistan | South Asia | 2.05% |
With 81% of respondents borrowing from financial institutions, Canada tops this list. Meanwhile, Israel (80%), Iceland (73%), Hong Kong (70%), and South Korea (69%) are not far behind.
This is not surprising for richer nations, as financial services in these countries are more available and accessible. This, coupled with higher financial literacy, including a general understanding of interest rates and credit-building opportunities, contribute to the popularity of financial institutions.
Also, it’s worth noting that some countries have cultural practices that factor in. For example, 61% of respondents in Japan used formal financial institutions, which are a more socially acceptable option than asking to borrow money from friends and family (just 6% of people in Japan).
Borrowing from Friends and Family
In contrast, more individuals in lower income economies approached family and friends in order to borrow money.
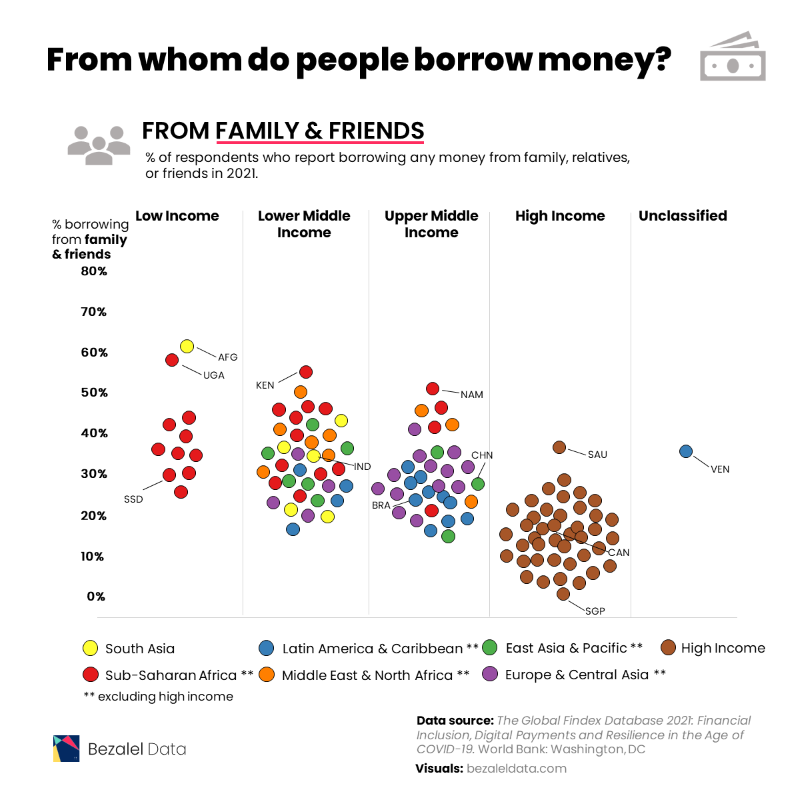
Afghanistan tops this list with 60% of respondents relying on friends and family, compared to only 2% borrowing money from formal financial institutions.
| Country | Region | Borrowed from family or friends |
|---|---|---|
| Afghanistan | South Asia | 60.18% |
| Uganda | Sub-Saharan Africa (excluding high income) | 57.45% |
| Kenya | Sub-Saharan Africa (excluding high income) | 54.40% |
| Namibia | Sub-Saharan Africa (excluding high income) | 50.25% |
| Morocco | Middle East & North Africa (excluding high income) | 48.73% |
| Nigeria | Sub-Saharan Africa (excluding high income) | 44.71% |
| South Africa | Sub-Saharan Africa (excluding high income) | 44.54% |
| Iraq | Middle East & North Africa (excluding high income) | 44.10% |
| Cameroon | Sub-Saharan Africa (excluding high income) | 43.49% |
| Zambia | Sub-Saharan Africa (excluding high income) | 43.08% |
| Zimbabwe | Sub-Saharan Africa (excluding high income) | 42.34% |
| Guinea | Sub-Saharan Africa (excluding high income) | 42.04% |
| Nepal | South Asia | 41.79% |
| Jordan | Middle East & North Africa (excluding high income) | 41.76% |
| Gabon | Sub-Saharan Africa (excluding high income) | 41.41% |
| Liberia | Sub-Saharan Africa (excluding high income) | 41.37% |
| Tunisia | Middle East & North Africa (excluding high income) | 41.05% |
| Philippines | East Asia & Pacific (excluding high income) | 40.82% |
| Türkiye | Europe & Central Asia (excluding high income) | 40.80% |
| Iran, Islamic Rep. | Middle East & North Africa (excluding high income) | 39.80% |
| Sierra Leone | Sub-Saharan Africa (excluding high income) | 39.02% |
| Ghana | Sub-Saharan Africa (excluding high income) | 38.58% |
| Egypt, Arab Rep. | Middle East & North Africa (excluding high income) | 37.75% |
| Saudi Arabia | High income | 35.76% |
| Bangladesh | South Asia | 35.49% |
| Mali | Sub-Saharan Africa (excluding high income) | 35.15% |
| Burkina Faso | Sub-Saharan Africa (excluding high income) | 35.14% |
| Cambodia | East Asia & Pacific (excluding high income) | 34.85% |
| Venezuela, RB | Latin America & Caribbean (excluding high income) | 34.81% |
| Togo | Sub-Saharan Africa (excluding high income) | 33.99% |
| West Bank and Gaza | Middle East & North Africa (excluding high income) | 33.93% |
| Thailand | East Asia & Pacific (excluding high income) | 32.83% |
| Lao PDR | East Asia & Pacific (excluding high income) | 32.36% |
| Moldova | Europe & Central Asia (excluding high income) | 32.18% |
| Ukraine | Europe & Central Asia (excluding high income) | 32.17% |
| Senegal | Sub-Saharan Africa (excluding high income) | 31.30% |
| Armenia | Europe & Central Asia (excluding high income) | 31.29% |
| India | South Asia | 31.02% |
| Bolivia | Latin America & Caribbean (excluding high income) | 30.69% |
| Algeria | Middle East & North Africa (excluding high income) | 30.52% |
| Cote d'Ivoire | Sub-Saharan Africa (excluding high income) | 30.20% |
| Albania | Europe & Central Asia (excluding high income) | 30.00% |
| Bulgaria | Europe & Central Asia (excluding high income) | 29.99% |
| Benin | Sub-Saharan Africa (excluding high income) | 29.33% |
| Mozambique | Sub-Saharan Africa (excluding high income) | 29.33% |
| Tanzania | Sub-Saharan Africa (excluding high income) | 29.24% |
| Colombia | Latin America & Caribbean (excluding high income) | 29.08% |
| Indonesia | East Asia & Pacific (excluding high income) | 28.85% |
| South Sudan | Sub-Saharan Africa (excluding high income) | 28.84% |
| Ecuador | Latin America & Caribbean (excluding high income) | 28.79% |
| Serbia | Europe & Central Asia (excluding high income) | 28.49% |
| Russian Federation | Europe & Central Asia (excluding high income) | 28.40% |
| Mongolia | East Asia & Pacific (excluding high income) | 27.01% |
| Kyrgyz Republic | Europe & Central Asia (excluding high income) | 27.01% |
| China | East Asia & Pacific (excluding high income) | 26.43% |
| Honduras | Latin America & Caribbean (excluding high income) | 26.07% |
| Greece | High income | 25.94% |
| Kosovo | Europe & Central Asia (excluding high income) | 25.86% |
| Argentina | Latin America & Caribbean (excluding high income) | 25.72% |
| Kazakhstan | Europe & Central Asia (excluding high income) | 25.64% |
| Romania | Europe & Central Asia (excluding high income) | 25.58% |
| Malawi | Sub-Saharan Africa (excluding high income) | 25.24% |
| North Macedonia | Europe & Central Asia (excluding high income) | 25.14% |
| Dominican Republic | Latin America & Caribbean (excluding high income) | 24.70% |
| Brazil | Latin America & Caribbean (excluding high income) | 24.66% |
| Congo, Rep. | Sub-Saharan Africa (excluding high income) | 24.40% |
| Lebanon | Middle East & North Africa (excluding high income) | 24.26% |
| Nicaragua | Latin America & Caribbean (excluding high income) | 23.75% |
| Iceland | High income | 23.63% |
| Peru | Latin America & Caribbean (excluding high income) | 23.34% |
| United Arab Emirates | High income | 23.04% |
| Myanmar | East Asia & Pacific (excluding high income) | 23.03% |
| Sri Lanka | South Asia | 22.53% |
| Paraguay | Latin America & Caribbean (excluding high income) | 22.20% |
| Pakistan | South Asia | 21.87% |
| Uzbekistan | Europe & Central Asia (excluding high income) | 21.53% |
| Cyprus | High income | 20.95% |
| Bosnia and Herzegovina | Europe & Central Asia (excluding high income) | 20.94% |
| Chile | High income | 20.72% |
| Georgia | Europe & Central Asia (excluding high income) | 20.61% |
| Mauritius | Sub-Saharan Africa (excluding high income) | 20.48% |
| Costa Rica | Latin America & Caribbean (excluding high income) | 20.29% |
| Jamaica | Latin America & Caribbean (excluding high income) | 20.02% |
| Tajikistan | Europe & Central Asia (excluding high income) | 19.86% |
| Poland | High income | 19.34% |
| Norway | High income | 19.29% |
| United States | High income | 18.09% |
| Uruguay | High income | 17.60% |
| Panama | Latin America & Caribbean (excluding high income) | 17.54% |
| Denmark | High income | 17.51% |
| Croatia | High income | 17.09% |
| El Salvador | Latin America & Caribbean (excluding high income) | 16.78% |
| Slovenia | High income | 16.77% |
| Latvia | High income | 16.57% |
| Australia | High income | 16.44% |
| Estonia | High income | 15.74% |
| Malaysia | East Asia & Pacific (excluding high income) | 15.44% |
| Israel | High income | 15.43% |
| New Zealand | High income | 15.19% |
| Slovak Republic | High income | 15.02% |
| Germany | High income | 15.01% |
| Austria | High income | 14.41% |
| Canada | High income | 14.00% |
| Finland | High income | 13.43% |
| Czech Republic | High income | 13.41% |
| Korea, Rep. | High income | 13.16% |
| Malta | High income | 12.99% |
| Belgium | High income | 12.13% |
| Sweden | High income | 11.79% |
| Hungary | High income | 11.15% |
| Lithuania | High income | 10.65% |
| Spain | High income | 10.44% |
| France | High income | 10.42% |
| Netherlands | High income | 10.24% |
| Ireland | High income | 9.84% |
| Taiwan, China | High income | 9.70% |
| Portugal | High income | 8.22% |
| Hong Kong SAR, China | High income | 7.59% |
| Japan | High income | 6.43% |
| Switzerland | High income | 6.10% |
| United Kingdom | High income | 5.24% |
| Italy | High income | 5.06% |
| Singapore | High income | 1.89% |
Many individuals in African countries including Uganda (57%), Kenya (54%), Namibia (50%), and Morocco (49%) also are choosing to borrow money from friends and family over financial institutions.
These preferences can be attributed to various factors including a lack of trust in banking and financial institutions, lacking access to such services, or the lack of information about such services if they are available.
And in some societies, borrowing from friends and family can be seen as a cultural norm, especially in places where mutual support and solidarity play a strong role.
What’s Next?
As viewed by the World Bank, financial inclusion is an important foundation of any nation’s development, and it’s also one of the UN’s Sustainable Development Goals. Increasing levels of financial inclusion helps give people access to services like savings plans, credit avenues, and online payments and transactions.
And thanks to commitments from countries and financial systems, global ownership of banking accounts has increased significantly (and been further spurred by the COVID-19 pandemic). According to the Global Findex Database, bank account ownership has risen to 76% in 2021, up from just 51% a decade prior.
However, access to these services is still rife with gaps when it comes to low income nations, low income individuals, and unequal access based on gender. The future of borrowing now relies on how nations deal with these challenges.

This article was published as a part of Visual Capitalist's Creator Program, which features data-driven visuals from some of our favorite Creators around the world.


Personal Finance
Chart: The Declining Value of the U.S. Federal Minimum Wage
This graphic compares the nominal vs. inflation-adjusted value of the U.S. minimum wage, from 1940 to 2023.


The Declining Value of the U.S. Federal Minimum Wage
This was originally posted on our Voronoi app. Download the app for free on iOS or Android and discover incredible data-driven charts from a variety of trusted sources.
This graphic illustrates the history of the U.S. federal minimum wage using data compiled by Statista, in both nominal and real (inflation-adjusted) terms. The federal minimum wage was raised to $7.25 per hour in July 2009, where it has remained ever since.
Nominal vs. Real Value
The data we used to create this graphic can be found in the table below.
| Year | Nominal value ($/hour) | Real value ($/hour) |
|---|---|---|
| 1940 | 0.3 | 6.5 |
| 1945 | 0.4 | 6.82 |
| 1950 | 0.75 | 9.64 |
| 1955 | 0.75 | 8.52 |
| 1960 | 1 | 10.28 |
| 1965 | 1.25 | 12.08 |
| 1970 | 1.6 | 12.61 |
| 1975 | 2.1 | 12.04 |
| 1980 | 3.1 | 11.61 |
| 1985 | 3.35 | 9.51 |
| 1990 | 3.8 | 8.94 |
| 1995 | 4.25 | 8.49 |
| 2000 | 5.15 | 9.12 |
| 2005 | 5.15 | 8.03 |
| 2010 | 7.25 | 10.09 |
| 2015 | 7.25 | 9.3 |
| 2018 | 7.25 | 8.78 |
| 2019 | 7.25 | 8.61 |
| 2020 | 7.25 | 8.58 |
| 2021 | 7.25 | 8.24 |
| 2022 | 7.25 | 7.61 |
| 2023 | 7.25 | 7.25 |
What our graphic shows is how inflation has eroded the real value of the U.S. minimum wage over time, despite nominal increases.
For instance, consider the year 1960, when the federal minimum wage was $1 per hour. After accounting for inflation, this would be worth around $10.28 today!
The two lines converge at 2023 because the nominal and real value are identical in present day terms.
Many States Have Their Own Minimum Wage
According to the National Conference of State Legislatures (NCSL), 30 states and Washington, D.C. have implemented a minimum wage that is higher than $7.25.
The following states have adopted the federal minimum: Georgia, Idaho, Indiana, Iowa, Kansas, Kentucky, New Hampshire, North Carolina, North Dakota, Oklahoma, Pennsylvania, Texas, Utah, Wisconsin, and Wyoming.
Meanwhile, the states of Alabama, Louisiana, Mississippi, South Carolina, and Tennessee have no wage minimums, but have to follow the federal minimum.
How Does the U.S. Minimum Wage Rank Globally?
If you found this topic interesting, check out Mapped: Minimum Wage Around the World to see which countries have the highest minimum wage in monthly terms, as of January 2023.

-

 Green7 days ago
The Carbon Footprint of Major Travel Methods
-

 Debt2 weeks ago
How Debt-to-GDP Ratios Have Changed Since 2000
-

 Sports2 weeks ago
The Highest Earning Athletes in Seven Professional Sports
-

 Science2 weeks ago
Visualizing the Average Lifespans of Mammals
-

 Brands2 weeks ago
How Tech Logos Have Evolved Over Time
-

 Energy2 weeks ago
Ranked: The Top 10 EV Battery Manufacturers in 2023
-

 Demographics2 weeks ago
Countries With the Largest Happiness Gains Since 2010
-

 VC+2 weeks ago
VC+: Get Our Key Takeaways From the IMF’s World Economic Outlook