Markets
The 7 Major Flaws of the Global Financial System
.container {
max-width: 1200px;
}
.button {
display: inline-block;
height: 45px;
color: #ffffff;
text-align: center;
font-family: helvetica;
letter-spacing: .01rem;
text-decoration: none;
white-space: nowrap;
border-radius: 0px;
line-height: 45px;
border: 1px;
font-size: em(13);
cursor: pointer;
box-sizing: border-box;
background: #6C1ABD;
transition-duration: 0.4s;
margin-bottom: 1px;
width: 33.33333%;
}
.button-group {
position: left;
width: 100%;
display: inline-block;
list-style: none;
padding: 0;
margin: 0;
/* IE hacks */
zoom: 1;
*display: inline;
}
.button-group li {
float: left;
padding: 0;
margin: 0;
}
.button-group .button {
display: inline-block;
box-sizing: border-box;
color: white;
}
.button-group > .button:not(:first-child):not(:last-child), .button-group li:not(:first-child):not(:last-child) .button {
border-radius: 0;
}
.button-group > .button:first-child, .button-group li:first-child .button {
margin-left: 0;
border-top-right-radius: 0;
border-bottom-right-radius: 0;
}
.button-group > .button:last-child, .button-group li:last-child > .button {
border-top-left-radius: 0;
border-bottom-left-radius: 0;
border-bottom-right-radius: 0;
}
.button:hover {
background-color: #FFA774;
}
.button.active {
background-color: #FFA774;
}
.button-group :not(:last-child) {
border-right: 1px solid white;
padding-right: 2px;
}
.button-group {
border-right: none;
margin-right: none;
}
@media (max-width: 600px) {
.button {
font-size: 13px;}
}

The 7 Major Flaws of the Global Financial System
Since the invention of banking, the global financial system has become increasingly centralized.
In the modern system, central banks now control everything from interest rates to the issuance of currency, while government regulators, corporations, and intergovernmental organizations wield unparalleled influence at the top of this crucial food chain.
There is no doubt that this centralization has led to the creation of massive amounts of wealth, especially to those properly connected to the financial system. However, the same centralization has also arguably contributed to many global challenges and risks we face today.
Flaws of the Global Financial System
Today’s infographic comes to us from investment app Abra, and it highlights the seven major flaws of the global financial system, ranging from the lack of basic access to financial services to growing inequality.
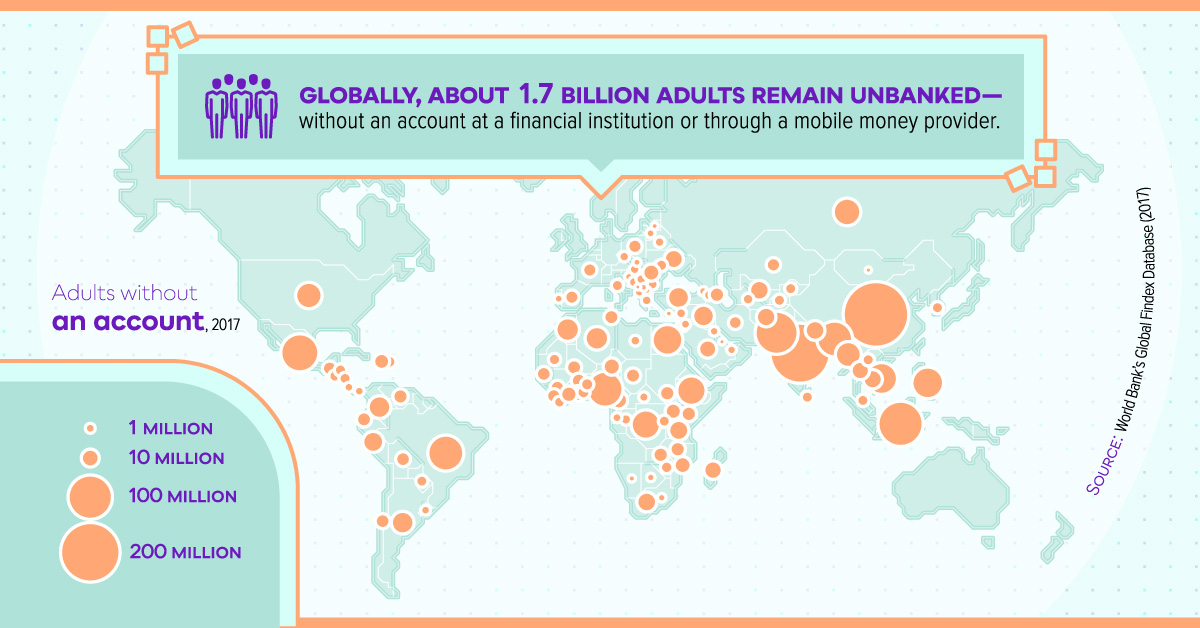
1. Billions of people globally remain unbanked
To participate in the global financial sector, whether it is to make a digital payment or manage one’s wealth, one must have access to a bank account. However, 1.7 billion adults worldwide remain unbanked, having zero access to an account with a financial institution or a mobile money provider.
2. Global financial literacy remains low
For people to successfully use financial services and markets, they must have some degree of financial literacy. According to a recent global survey, just 1-in-3 people show an understanding of basic financial concepts, with most of these people living in high income economies.
Without an understanding of key concepts in finance, it makes it difficult for the majority of the population to make the right decisions – and to build wealth.
3. High intermediary costs and slow transactions
Once a person has access to financial services, sending and storing money should be inexpensive and fast.
However, just the opposite is true. Around the globe, the average cost of a remittance is 7.01% in fees per transaction – and when using banks, that rises to 10.53%. Even worse, these transactions can take days at a time, which seems quite unnecessary in today’s digital era.
4. Low trust in financial institutions and governments
The financial sector is the least trusted business sector globally, with only a 57% level of trust according to Edelman. Meanwhile, trust in governments is even lower, with only 40% trusting the U.S. government, and the global country average sitting at 47%.
5. Rising global inequality
In a centralized system, financial markets tend to be dominated by those who are best connected to them.
These are people who have:
- Access to many financial opportunities and asset classes
- Capital to deploy
- Informational advantages
- Access to financial expertise
In fact, according to recent data on global wealth concentration, the top 1% own 47% of all household wealth, while the top 10% hold roughly 85%.
On the other end of the spectrum, the vast majority of people have little to no financial assets to even start building wealth. Not only are many people living paycheck to paycheck – but they also don’t have access to assets that can create wealth, like stocks, bonds, mutual funds, or ETFs.
6. Currency manipulation and censorship
In a centralized system, countries have the power to manipulate and devalue fiat currencies, and this can have a devastating effect on markets and the lives of citizens.
In Venezuela, for example, the government has continually devalued its currency, creating runaway hyperinflation as a result. The last major currency manipulation in 2018 increased the price of a cup of coffee by over 772,400% in six months.
Further, centralized power also gives governments and financial institutions the ability to financially censor citizens, by taking actions such as freezing accounts, denying access to payment systems, removing funds from accounts, and denying the retrieval of funds during bank runs.
7. The build-up of systemic risk
Finally, centralization creates one final and important drawback.
With financial power concentrated with just a select few institutions, such as central banks and “too big too fail” companies, it means that one abject failure can decimate an entire system.
This happened in 2008 as U.S. subprime mortgages turned out to be an Achilles Heel for bank balance sheets, creating a ripple effect throughout the globe. Centralization means all eggs in one basket – and if that basket breaks it can possibly lead to the destruction of wealth on a large scale.
The Future of the Global Financial System?
The risks and drawbacks of centralization to the global financial system are well known, however there has never been much of a real alternative – until now.
With the proliferation of mobile phones and internet access, as well as the development of decentralization technologies like the blockchain, it may be possible to build an entirely new financial system.
But is the world ready?


Markets
The European Stock Market: Attractive Valuations Offer Opportunities
On average, the European stock market has valuations that are nearly 50% lower than U.S. valuations. But how can you access the market?


European Stock Market: Attractive Valuations Offer Opportunities
Europe is known for some established brands, from L’Oréal to Louis Vuitton. However, the European stock market offers additional opportunities that may be lesser known.
The above infographic, sponsored by STOXX, outlines why investors may want to consider European stocks.
Attractive Valuations
Compared to most North American and Asian markets, European stocks offer lower or comparable valuations.
| Index | Price-to-Earnings Ratio | Price-to-Book Ratio |
|---|---|---|
| EURO STOXX 50 | 14.9 | 2.2 |
| STOXX Europe 600 | 14.4 | 2 |
| U.S. | 25.9 | 4.7 |
| Canada | 16.1 | 1.8 |
| Japan | 15.4 | 1.6 |
| Asia Pacific ex. China | 17.1 | 1.8 |
Data as of February 29, 2024. See graphic for full index names. Ratios based on trailing 12 month financials. The price to earnings ratio excludes companies with negative earnings.
On average, European valuations are nearly 50% lower than U.S. valuations, potentially offering an affordable entry point for investors.
Research also shows that lower price ratios have historically led to higher long-term returns.
Market Movements Not Closely Connected
Over the last decade, the European stock market had low-to-moderate correlation with North American and Asian equities.
The below chart shows correlations from February 2014 to February 2024. A value closer to zero indicates low correlation, while a value of one would indicate that two regions are moving in perfect unison.
| EURO STOXX 50 | STOXX EUROPE 600 | U.S. | Canada | Japan | Asia Pacific ex. China |
|
|---|---|---|---|---|---|---|
| EURO STOXX 50 | 1.00 | 0.97 | 0.55 | 0.67 | 0.24 | 0.43 |
| STOXX EUROPE 600 | 1.00 | 0.56 | 0.71 | 0.28 | 0.48 | |
| U.S. | 1.00 | 0.73 | 0.12 | 0.25 | ||
| Canada | 1.00 | 0.22 | 0.40 | |||
| Japan | 1.00 | 0.88 | ||||
| Asia Pacific ex. China | 1.00 |
Data is based on daily USD returns.
European equities had relatively independent market movements from North American and Asian markets. One contributing factor could be the differing sector weights in each market. For instance, technology makes up a quarter of the U.S. market, but health care and industrials dominate the broader European market.
Ultimately, European equities can enhance portfolio diversification and have the potential to mitigate risk for investors.
Tracking the Market
For investors interested in European equities, STOXX offers a variety of flagship indices:
| Index | Description | Market Cap |
|---|---|---|
| STOXX Europe 600 | Pan-regional, broad market | €10.5T |
| STOXX Developed Europe | Pan-regional, broad-market | €9.9T |
| STOXX Europe 600 ESG-X | Pan-regional, broad market, sustainability focus | €9.7T |
| STOXX Europe 50 | Pan-regional, blue-chip | €5.1T |
| EURO STOXX 50 | Eurozone, blue-chip | €3.5T |
Data is as of February 29, 2024. Market cap is free float, which represents the shares that are readily available for public trading on stock exchanges.
The EURO STOXX 50 tracks the Eurozone’s biggest and most traded companies. It also underlies one of the world’s largest ranges of ETFs and mutual funds. As of November 2023, there were €27.3 billion in ETFs and €23.5B in mutual fund assets under management tracking the index.
“For the past 25 years, the EURO STOXX 50 has served as an accurate, reliable and tradable representation of the Eurozone equity market.”
— Axel Lomholt, General Manager at STOXX
Partnering with STOXX to Track the European Stock Market
Are you interested in European equities? STOXX can be a valuable partner:
- Comprehensive, liquid and investable ecosystem
- European heritage, global reach
- Highly sophisticated customization capabilities
- Open architecture approach to using data
- Close partnerships with clients
- Part of ISS STOXX and Deutsche Börse Group
With a full suite of indices, STOXX can help you benchmark against the European stock market.
Learn how STOXX’s European indices offer liquid and effective market access.

-

 Economy2 days ago
Economic Growth Forecasts for G7 and BRICS Countries in 2024
The IMF has released its economic growth forecasts for 2024. How do the G7 and BRICS countries compare?
-

 Markets1 week ago
U.S. Debt Interest Payments Reach $1 Trillion
U.S. debt interest payments have surged past the $1 trillion dollar mark, amid high interest rates and an ever-expanding debt burden.
-

 United States2 weeks ago
Ranked: The Largest U.S. Corporations by Number of Employees
We visualized the top U.S. companies by employees, revealing the massive scale of retailers like Walmart, Target, and Home Depot.
-

 Markets2 weeks ago
The Top 10 States by Real GDP Growth in 2023
This graphic shows the states with the highest real GDP growth rate in 2023, largely propelled by the oil and gas boom.
-

 Markets2 weeks ago
Ranked: The World’s Top Flight Routes, by Revenue
In this graphic, we show the highest earning flight routes globally as air travel continued to rebound in 2023.
-

 Markets3 weeks ago
Ranked: The Most Valuable Housing Markets in America
The U.S. residential real estate market is worth a staggering $47.5 trillion. Here are the most valuable housing markets in the country.


-

 Debt1 week ago
How Debt-to-GDP Ratios Have Changed Since 2000
-
Markets2 weeks ago
Ranked: The World’s Top Flight Routes, by Revenue
-

 Countries2 weeks ago
Population Projections: The World’s 6 Largest Countries in 2075
-
Markets2 weeks ago
The Top 10 States by Real GDP Growth in 2023
-

 Demographics2 weeks ago
The Smallest Gender Wage Gaps in OECD Countries
-

 United States2 weeks ago
Where U.S. Inflation Hit the Hardest in March 2024
-

 Green2 weeks ago
Top Countries By Forest Growth Since 2001
-
United States2 weeks ago
Ranked: The Largest U.S. Corporations by Number of Employees