Markets
Form and Function: Visualizing the Shape of Cities and Economies
Visualizing the Shape of Cities and Economies
The Industrial Revolution changed the form and function of cities. New patterns of work resulted in massive wealth and distinct advantages for certain regions. Urbanization emerged as a defining characteristic of this age.
During the latter part of the Industrial Revolution, Cambridge School economist Alfred Marshall looked at a particular question: why did certain industries concentrate in specific places?
Marshall argued that the local concentration of industry created powerful economies promoting technical dynamism and innovation.
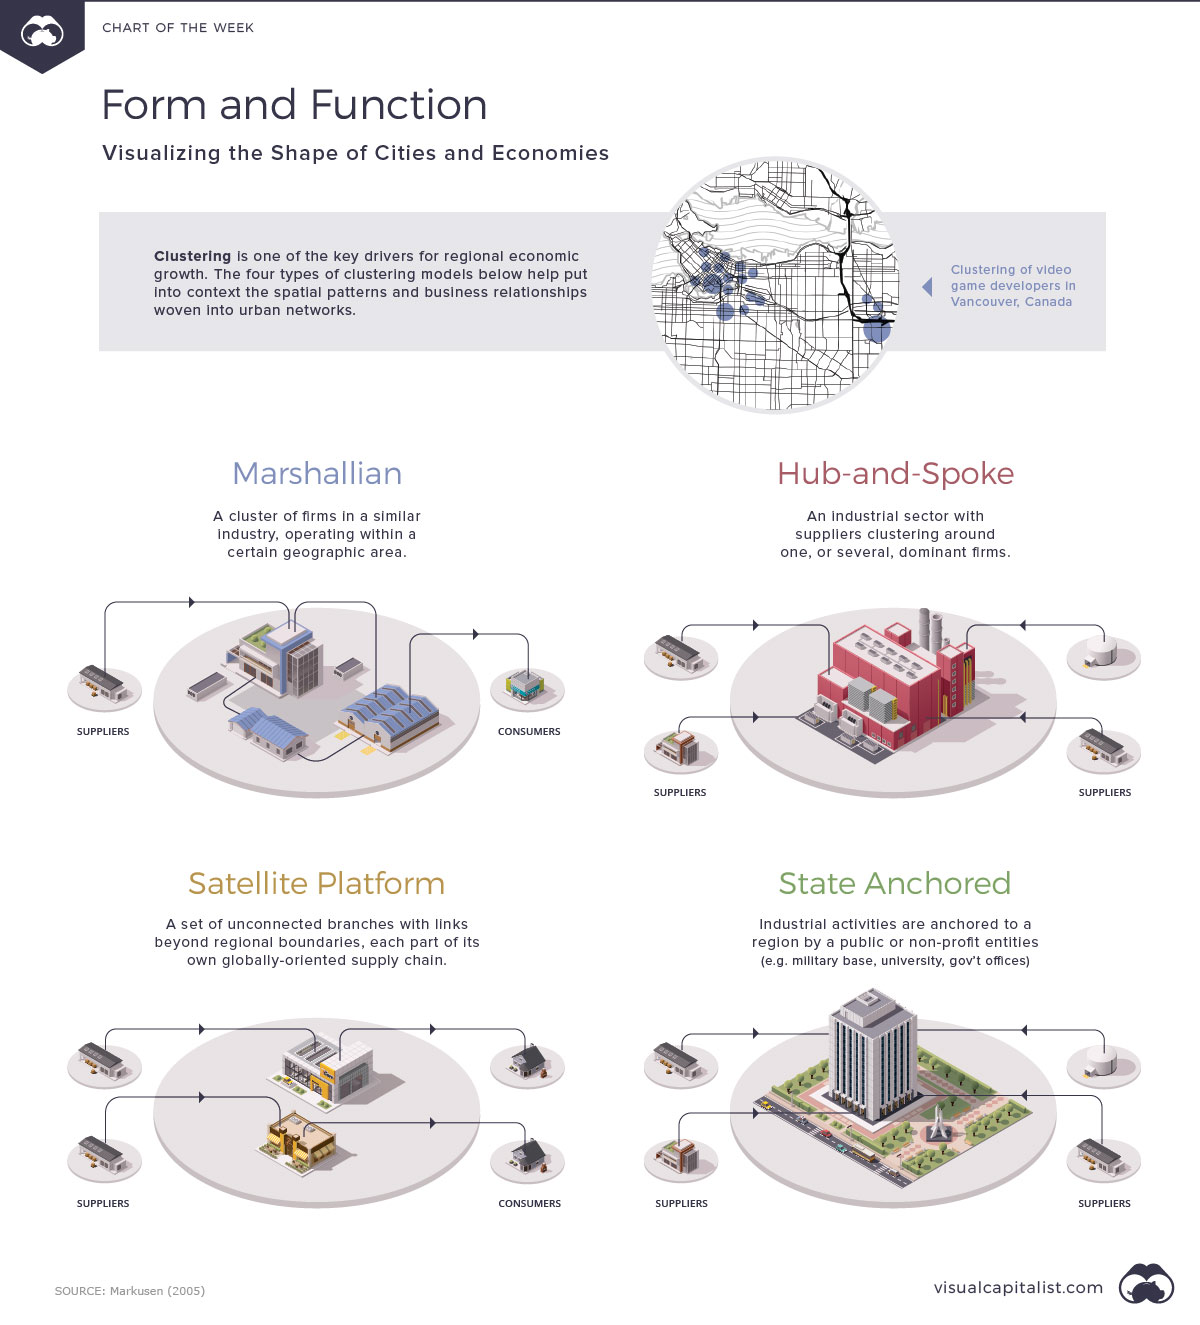
This Chart of the Week highlights the spatial patterns and business relationships created at the urban scale. Marshall’s insights from the past help us understand present-day tech and media economies and the massive growth of urban regions.
The Logic of Concentration
Marshall observed that industrial concentration led to long-term tendencies such as increasing returns on capital and compounding regional advantages.
The heart of this observation is that knowledge resides within the companies that make up a particular industry. Over time, these companies can accumulate even more information and direct the flow of new and innovative ideas. This creates local specialization and increasing profits, while also concentrating success, knowledge, and wealth into one key locale.
He defined this pattern as a Marshallian Industrial District.
An Evolving Landscape: Four Patterns
Marshall’s work would later influence the work of Ann Markusen, who created a typology of three additional industrial patterns. The patterns identify what makes a city attractive or repellent to income-generating activities.
| District Type: | Description: | Example: |
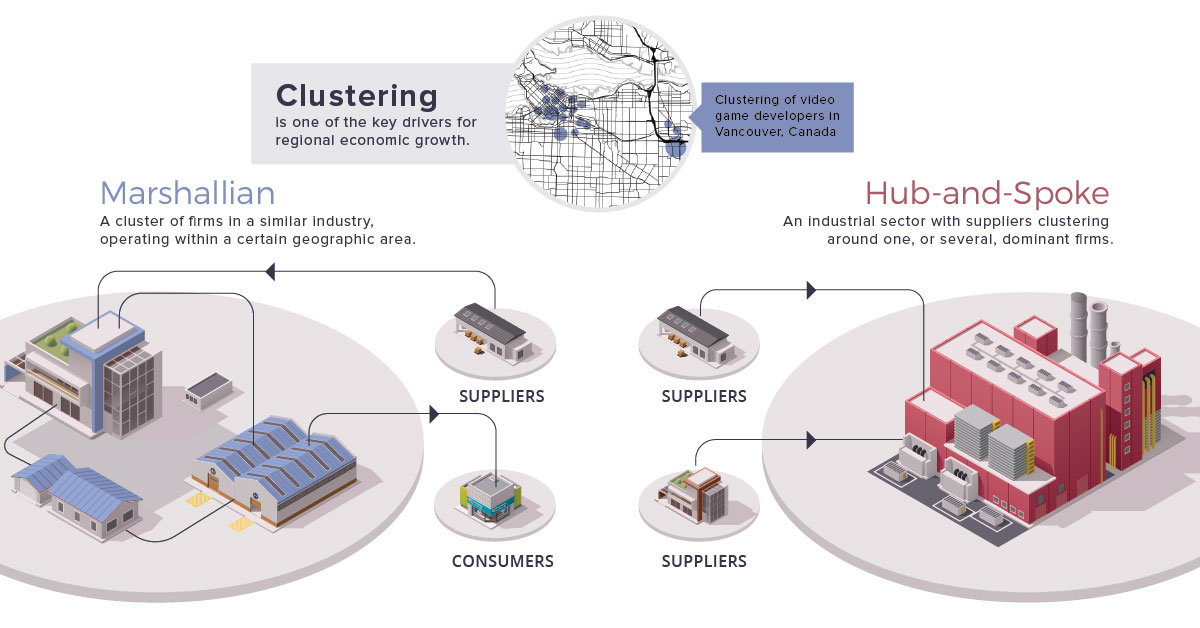
| Marshallian Industrial District | This is a clustering of firms in a similar industry, operating within a certain geographic area. | Social media marketing companies in San Francisco |
| Satellite Platform District | A set of unconnected branches with links beyond regional boundaries, each part of its own globally oriented supply chain. | Suburban neighborhoods |
| Hub and Spoke District | An industrial sector with suppliers clustering around one, or several, dominant firms. | Airplane manufacturer Boeing and the region of Seattle. |
| State-anchored District | Industrial activities are anchored to a region by a public or non-profit entity, such as a military base, a university, or a concentration of public laboratories or government offices. | Madison, WI and Columbus, OH are examples of university towns, as are many cities with large defense installations such as Pearl Harbor in Hawaii. |
There are both benefits and problems—called “externalities”—associated with the spatial agglomeration of physical capital, companies, consumers, and workers:
| Advantages | Disadvantages |
|
|
Clusters for a Digital Age
In the past, the physical constraints of an area defined the structure of cities. Now that so many companies are free from the shackles of producing physical goods, does geography still matter?
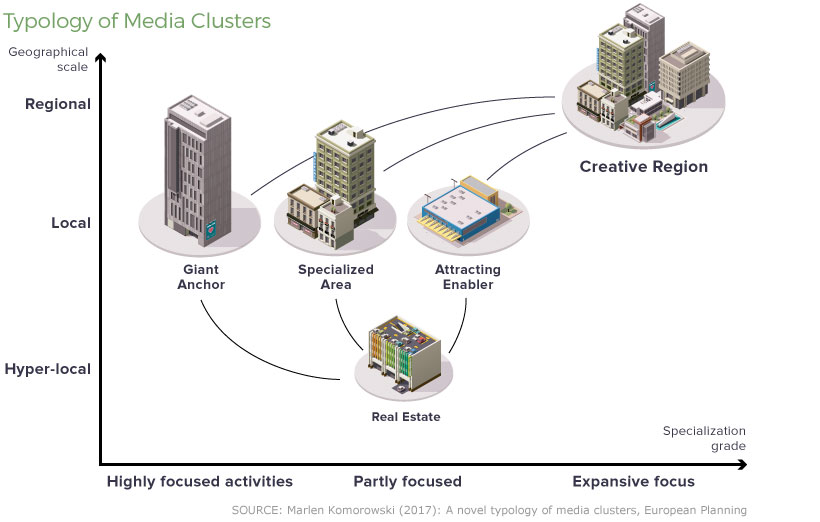
Researcher Marlen Komorowski re-examined the concept of clustering with this question in mind. Here are five types of media clusters identified in her research.
| District Type: | Description: | Example: |
| The Creative Region | A metropolitan region that provides advantages due to readily available infrastructures and institutions, and encourages the development of face-to-face interaction and collaboration networks. | Berlin, Singapore, Amsterdam |
| The Giant Anchor | A location defined by the activities of one or several large media institutions, which attract complementary firms to agglomerate. Similar to the hub-and-spoke cluster model. | Seattle, (Microsoft, Amazon), and Cambridge (Harvard, MIT) |
| The Specialized Area | A media cluster that is located either in a neighborhood within a big metropolitan area or in a small urbanized area. The Specialized Area is marked by a readily available, large pool of employees from a specialized field. | Soho (London), Silicon Valley |
| The Attracting Enabler | Determined by the location of certain facilities or resources that can be shared that enable media activities. Movie studios are a prime example. | Los Angeles, Vancouver |
| The Real Estate | This type of cluster is centered around office space, sometimes purpose-built for media and creative companies. This space can also include incubators / accelerators. | Dubai Media City, Dublin’s Digital Hub |
Four rationales drive these patterns: agglomeration, urbanization, localization economies. and artificial formation.
The Shadow of the Industrial Revolution
Alfred Marshall made the argument that local concentration of industry can offer powerful economies and technical dynamism and innovation.
We now see this pattern with the emergence of megacities that accrue the majority of the financial and knowledge returns. These megaregions set the perfect stage for dynamic economic exchanges between skilled labor, technology, and networks.
What does your city look like?


Markets
The European Stock Market: Attractive Valuations Offer Opportunities
On average, the European stock market has valuations that are nearly 50% lower than U.S. valuations. But how can you access the market?


European Stock Market: Attractive Valuations Offer Opportunities
Europe is known for some established brands, from L’Oréal to Louis Vuitton. However, the European stock market offers additional opportunities that may be lesser known.
The above infographic, sponsored by STOXX, outlines why investors may want to consider European stocks.
Attractive Valuations
Compared to most North American and Asian markets, European stocks offer lower or comparable valuations.
| Index | Price-to-Earnings Ratio | Price-to-Book Ratio |
|---|---|---|
| EURO STOXX 50 | 14.9 | 2.2 |
| STOXX Europe 600 | 14.4 | 2 |
| U.S. | 25.9 | 4.7 |
| Canada | 16.1 | 1.8 |
| Japan | 15.4 | 1.6 |
| Asia Pacific ex. China | 17.1 | 1.8 |
Data as of February 29, 2024. See graphic for full index names. Ratios based on trailing 12 month financials. The price to earnings ratio excludes companies with negative earnings.
On average, European valuations are nearly 50% lower than U.S. valuations, potentially offering an affordable entry point for investors.
Research also shows that lower price ratios have historically led to higher long-term returns.
Market Movements Not Closely Connected
Over the last decade, the European stock market had low-to-moderate correlation with North American and Asian equities.
The below chart shows correlations from February 2014 to February 2024. A value closer to zero indicates low correlation, while a value of one would indicate that two regions are moving in perfect unison.
| EURO STOXX 50 | STOXX EUROPE 600 | U.S. | Canada | Japan | Asia Pacific ex. China |
|
|---|---|---|---|---|---|---|
| EURO STOXX 50 | 1.00 | 0.97 | 0.55 | 0.67 | 0.24 | 0.43 |
| STOXX EUROPE 600 | 1.00 | 0.56 | 0.71 | 0.28 | 0.48 | |
| U.S. | 1.00 | 0.73 | 0.12 | 0.25 | ||
| Canada | 1.00 | 0.22 | 0.40 | |||
| Japan | 1.00 | 0.88 | ||||
| Asia Pacific ex. China | 1.00 |
Data is based on daily USD returns.
European equities had relatively independent market movements from North American and Asian markets. One contributing factor could be the differing sector weights in each market. For instance, technology makes up a quarter of the U.S. market, but health care and industrials dominate the broader European market.
Ultimately, European equities can enhance portfolio diversification and have the potential to mitigate risk for investors.
Tracking the Market
For investors interested in European equities, STOXX offers a variety of flagship indices:
| Index | Description | Market Cap |
|---|---|---|
| STOXX Europe 600 | Pan-regional, broad market | €10.5T |
| STOXX Developed Europe | Pan-regional, broad-market | €9.9T |
| STOXX Europe 600 ESG-X | Pan-regional, broad market, sustainability focus | €9.7T |
| STOXX Europe 50 | Pan-regional, blue-chip | €5.1T |
| EURO STOXX 50 | Eurozone, blue-chip | €3.5T |
Data is as of February 29, 2024. Market cap is free float, which represents the shares that are readily available for public trading on stock exchanges.
The EURO STOXX 50 tracks the Eurozone’s biggest and most traded companies. It also underlies one of the world’s largest ranges of ETFs and mutual funds. As of November 2023, there were €27.3 billion in ETFs and €23.5B in mutual fund assets under management tracking the index.
“For the past 25 years, the EURO STOXX 50 has served as an accurate, reliable and tradable representation of the Eurozone equity market.”
— Axel Lomholt, General Manager at STOXX
Partnering with STOXX to Track the European Stock Market
Are you interested in European equities? STOXX can be a valuable partner:
- Comprehensive, liquid and investable ecosystem
- European heritage, global reach
- Highly sophisticated customization capabilities
- Open architecture approach to using data
- Close partnerships with clients
- Part of ISS STOXX and Deutsche Börse Group
With a full suite of indices, STOXX can help you benchmark against the European stock market.
Learn how STOXX’s European indices offer liquid and effective market access.

-

 Economy3 days ago
Economic Growth Forecasts for G7 and BRICS Countries in 2024
The IMF has released its economic growth forecasts for 2024. How do the G7 and BRICS countries compare?
-

 Markets2 weeks ago
U.S. Debt Interest Payments Reach $1 Trillion
U.S. debt interest payments have surged past the $1 trillion dollar mark, amid high interest rates and an ever-expanding debt burden.
-

 United States2 weeks ago
Ranked: The Largest U.S. Corporations by Number of Employees
We visualized the top U.S. companies by employees, revealing the massive scale of retailers like Walmart, Target, and Home Depot.
-

 Markets2 weeks ago
The Top 10 States by Real GDP Growth in 2023
This graphic shows the states with the highest real GDP growth rate in 2023, largely propelled by the oil and gas boom.
-

 Markets2 weeks ago
Ranked: The World’s Top Flight Routes, by Revenue
In this graphic, we show the highest earning flight routes globally as air travel continued to rebound in 2023.
-

 Markets3 weeks ago
Ranked: The Most Valuable Housing Markets in America
The U.S. residential real estate market is worth a staggering $47.5 trillion. Here are the most valuable housing markets in the country.


-

 Debt1 week ago
How Debt-to-GDP Ratios Have Changed Since 2000
-
Markets2 weeks ago
Ranked: The World’s Top Flight Routes, by Revenue
-

 Demographics2 weeks ago
Population Projections: The World’s 6 Largest Countries in 2075
-
Markets2 weeks ago
The Top 10 States by Real GDP Growth in 2023
-

 Demographics2 weeks ago
The Smallest Gender Wage Gaps in OECD Countries
-

 Economy2 weeks ago
Where U.S. Inflation Hit the Hardest in March 2024
-

 Green2 weeks ago
Top Countries By Forest Growth Since 2001
-
United States2 weeks ago
Ranked: The Largest U.S. Corporations by Number of Employees