Healthcare
Visualizing Global Attitudes Towards the COVID-19 Vaccines
Visualizing Global Attitudes Towards COVID-19 Vaccines
View the high-resolution of the infographic by clicking here.
To vaccinate, or not to vaccinate? That is the question.
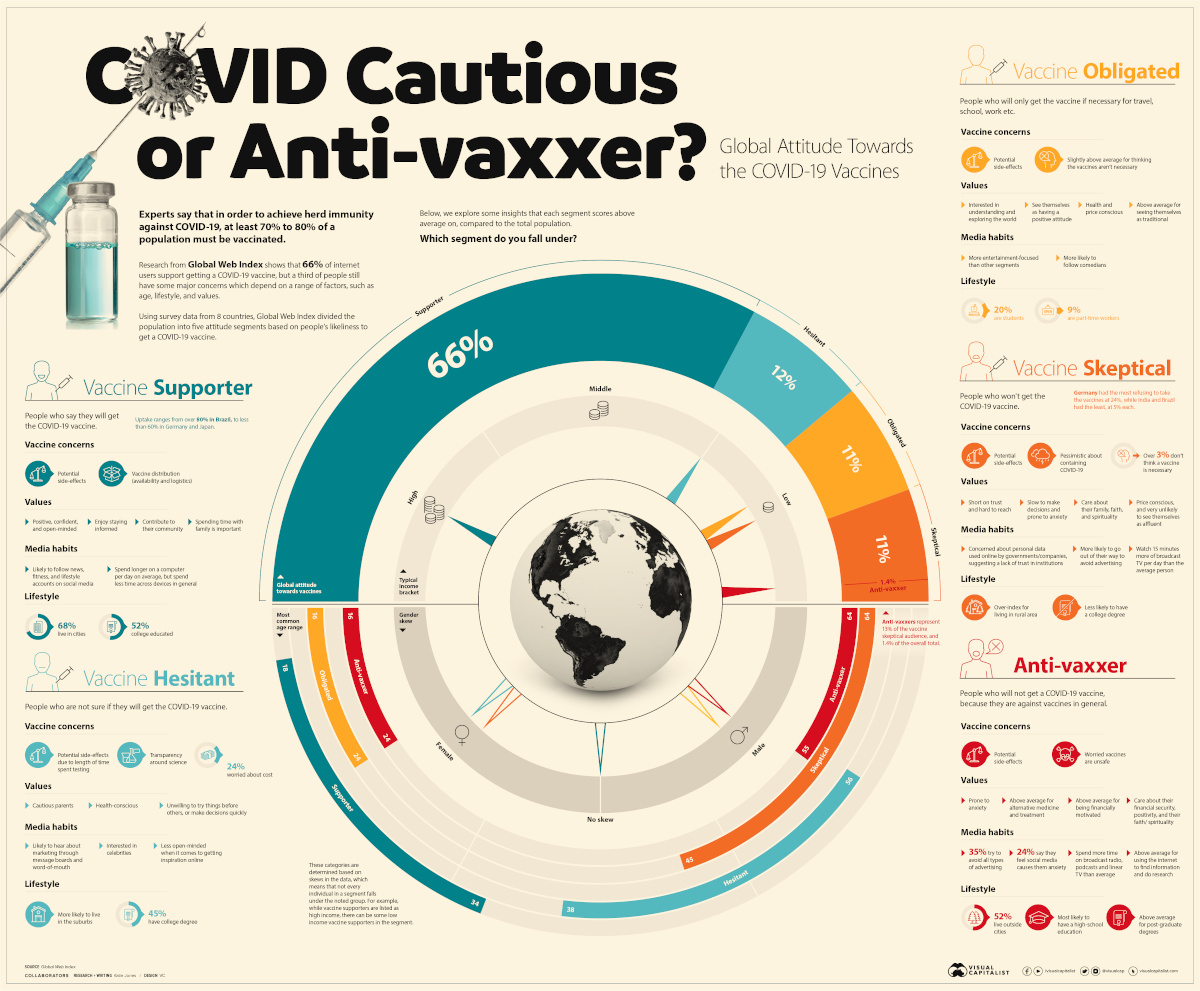
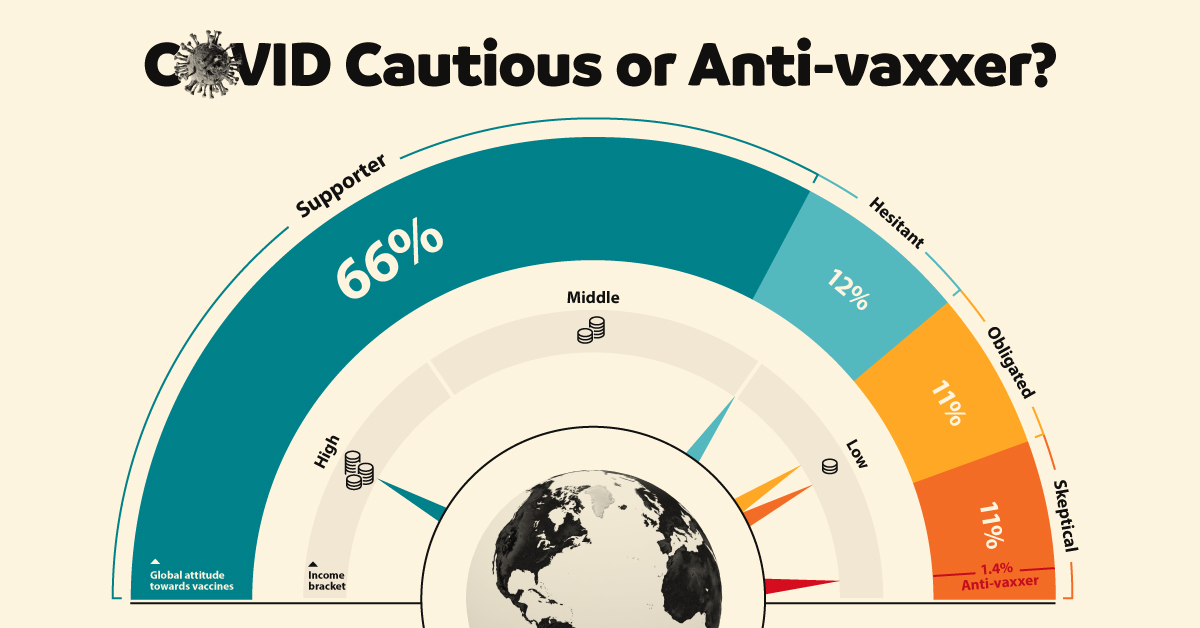
In order to achieve herd immunity against COVID-19, some experts believe that between 70% to 80% of a population must be vaccinated.
But attitudes towards these vaccines are undoubtedly mixed. In fact, it’s estimated that one-third of people globally have some major concerns.
Using survey data from eight different countries, Global Web Index created five archetypes to help illustrate how typical attitudes towards vaccines differ depending on a range of factors, such as age, income, lifestyle, and values.
Segment | Breakdown | Age Skew | Gender Skew | Income | Vaccine Concerns |
---|---|---|---|---|---|
Vaccine Supporter | 66% | 18-34 | None | High income | Potential side-effects, availability, and logistics of vaccine distribution. |
Vaccines Hesitant | 12% | 38-56 | Female | Low/Middle income | Potential side-effects specifically due to no long-term testing, cost of vaccine, and more transparency around science required. |
Vaccine Obligated | 11% | 16-24 | Male | Low income | Potential side-effects, not sure COVID-19 vaccine is necessary to combat the virus. |
Vaccine Skeptical | 11% | 45-64 | Female | Low income | Potential side-effects, donโt believe vaccines can curtail the pandemic. |
Anti-vaxxer | 1.4% (13% of the Vaccine Skeptical segment) | 16-24, 55-64 | Male | Low income | Potential side-effects, donโt believe vaccines in general are safe. |
Countries surveyed: United States, Germany, United Kingdom, Brazil, China, India, Japan, and Italy.
Which segment are you most likely to fall under, according to these segments?
Vaccine Supporters
[People who say they will get the COVID-19 vaccine.]
Out of all participants surveyed, 66% of them support the idea of getting a COVID-19 vaccine. Within this group, there is a skew towards younger people (aged 18-34) who are likely working professionals earning a high income and living in a city.
Despite their optimism towards COVID-19 vaccines, however, one-third of vaccine supporters say they will wait to get one, due to lingering concerns regarding issues with vaccine distribution and any potential side-effects.
Interestingly, this procrastination mindset has been seen before during the H1N1 (swine flu) pandemic when both members of the general public and healthcare workers showed low levels of vaccine acceptance due to safety concerns.
Vaccine Hesitant
[People who are not sure if they will get the COVID-19 vaccine.]
The vaccine hesitant group, which is more common among cautious suburban parents, makes up 12% of the total study. They are more likely to be female, and feel anxious about the length of time spent testing vaccines and therefore require more transparency around the science.
With that being said, this group could be easily swayed, as they are more receptive to word-of-mouth and messaging boards to get advice from their peers over any other medium.
Vaccine Obligated
[People who will only get the vaccine if it’s necessary for travel, school, work etc.]
The vaccine obligated group makes up 11% of the total, and has a skew towards males aged between 16 and 24 years old.
While this group is also concerned with potential side-effects, their responses suggesting that a vaccine may not be necessary to combat COVID-19 was above average compared to other segments in the study. They also index above average when it comes to viewing themselves as traditionalists.
Vaccine Skeptical
[People who wonโt get the COVID-19 vaccine.]
The vaccine skeptical group makes up another 11% of the total. However, this group is mostly female, who are aged between 45-64 and earn a lower-than-average income. They are less likely to have a college degree, and are more likely to live in a rural area.
Along with the worry of potential side-effects, this group is generally more pessimistic about containing COVID-19 at all. Therefore a small percentage do not believe a vaccine will help tackle the global health crisis.
With notably low trust levels, this group is one of the hardest to reach and potentially persuade. What makes them unique however, is their lack of faith in the scientific process.
Anti-Vaxxers
[People who will not get the vaccine, because they are against vaccines in general.]
It is important to note that those who choose not to get a COVID-19 vaccine should not be confused with anti-vaxxers.
Anti-vaxxers are a sub-segment of the vaccine skeptical group that makes up 1.4% of the total population. The difference is, anti-vaxxers do not believe in getting any vaccine due to safety concerns, not just not a vaccine for COVID-19.
According to the study, anti-vaxxers tend to fall into one of two age brackets, between 16-24 years or 55-64 years old, and are typically males with lower incomes.
Another Tool in the Arsenal Against COVID-19
The study demonstrates that broad segments of societyโregardless of their demographic or viewsโare at least somewhat concerned about COVID-19 vaccines becoming widely available.
While scientists are not quite sure if the current vaccines on the market can stop infection or transmission of the virus, they are an important part of our global defenses against COVID-19, along with other safety restrictions like wearing masks and keeping a distance.
Countries
Charted: The Worldโs Aging Population from 1950 to 2100
This graphic visualizes the worldโs aging population, showing data for every country and territory around the world.

Charted: The Worldโs Aging Population from 1950 to 2100
As demographics continue to shift in the 21st century, the worldโs aging population will continue to be a focal point for many global decision makers.
Most countries around the world have experienced population explosions, or are about to. Combine this with declining birth rates and falling mortality rates, and it’s clear that the global senior population will continue to reach new heights.
These graphics by Pablo Alvarez use data from the 2022 UN World Population Prospects to visualize this increasing aging population across countries.
The Worldโs Aging Population from 1950 to 2100
In 2022, there were 771 million people aged 65+ years globally, accounting for almost 10% of the world’s population.
This segment has been growing at an increasing rate, and it’s expected to hit 16% in 2050, and eventually 24% by 2100. Here’s what that’s projected to look like, for every country and territory.
Country by Population Aged +65 Years | 1950 | 2022 | 2100 |
---|---|---|---|
๐ฆ๐ซ Afghanistan | 2.85% | 2.39% | 16.03% |
๐ฆ๐ฑ Albania | 6.04% | 16.66% | 49.08% |
๐ฉ๐ฟ Algeria | 3.49% | 6.39% | 28.83% |
๐ฆ๐ธ American Samoa | 2.38% | 7.27% | 45.41% |
๐ฆ๐ฉ Andorra | 10.02% | 14.98% | 37.04% |
๐ฆ๐ด Angola | 2.93% | 2.6% | 12.07% |
๐ฆ๐ฎ Anguilla | 3.69% | 10.71% | 37.49% |
๐ฆ๐ฌ Antigua and Barbuda | 4.14% | 10.63% | 35.4% |
๐ฆ๐ท Argentina | 4.13% | 11.92% | 31.79% |
๐ฆ๐ฒ Armenia | 8.17% | 13.15% | 36.13% |
๐ฆ๐ผ Aruba | 1.77% | 16.15% | 36.51% |
๐ฆ๐บ Australia | 8.17% | 16.9% | 31.38% |
๐ฆ๐น Austria | 10.42% | 19.81% | 33.93% |
๐ฆ๐ฟ Azerbaijan | 6.89% | 7.11% | 30.5% |
๐ง๐ธ Bahamas | 4.76% | 8.89% | 29.58% |
๐ง๐ญ Bahrain | 2.88% | 3.76% | 21.89% |
๐ง๐ฉ Bangladesh | 3.9% | 6.04% | 32.56% |
๐ง๐ง Barbados | 5.24% | 16.28% | 33.19% |
๐ง๐พ Belarus | 8.24% | 17.18% | 30.45% |
๐ง๐ช Belgium | 11.03% | 19.73% | 32.83% |
๐ง๐ฟ Belize | 3.57% | 5.09% | 29.21% |
๐ง๐ฏ Benin | 7.85% | 3.06% | 11.03% |
๐ง๐ฒ Bermuda | 5.71% | 20.41% | 37.73% |
๐ง๐น Bhutan | 2.53% | 6.25% | 33.35% |
๐ง๐ด Bolivia | 6.11% | 4.85% | 21.75% |
๐ง๐ถ Bonaire Sint Eustatius and Saba | 14.22% | 13.84% | 28.94% |
๐ง๐ฆ Bosnia and Herzegovina | 3.95% | 18.4% | 36.4% |
๐ง๐ผ Botswana | 4.32% | 3.65% | 17.96% |
๐ง๐ท Brazil | 2.39% | 9.88% | 33.52% |
๐ป๐ฌ British Virgin Islands | 8.63% | 9.95% | 32.47% |
๐ง๐ณ Brunei | 4.85% | 6.17% | 30.93% |
๐ง๐ฌ Bulgaria | 6.66% | 22.38% | 37.13% |
๐ง๐ซ Burkina Faso | 2.01% | 2.53% | 13.07% |
๐ง๐ฎ Burundi | 3.22% | 2.48% | 13.23% |
๐ฐ๐ญ Cambodia | 2.67% | 5.81% | 26.43% |
๐จ๐ฒ Cameroon | 3.47% | 2.67% | 11.89% |
๐จ๐ฆ Canada | 7.7% | 19.03% | 31.55% |
๐จ๐ป Cape Verde | 3.67% | 5.55% | 32.63% |
๐ฐ๐พ Cayman Islands | 6.05% | 8.17% | 28.75% |
๐จ๐ซ Central African Republic | 5.% | 2.51% | 11.43% |
๐น๐ฉ Chad | 4.33% | 2.01% | 9.64% |
๐จ๐ฑ Chile | 3.3% | 13.03% | 36.61% |
๐จ๐ณ China | 5.04% | 13.72% | 40.93% |
๐จ๐ด Colombia | 3.22% | 9.% | 34.49% |
๐ฐ๐ฒ Comoros | 3.8% | 4.28% | 17.81% |
๐จ๐ฌ Congo | 3.36% | 2.72% | 11.99% |
๐จ๐ฐ Cook Islands | 2.94% | 11.73% | 29.75% |
๐จ๐ท Costa Rica | 2.97% | 10.83% | 36.99% |
๐จ๐ฎ Cote d'Ivoire | 2.21% | 2.4% | 10.86% |
๐ญ๐ท Croatia | 7.82% | 22.36% | 37.03% |
๐จ๐บ Cuba | 4.36% | 15.81% | 36.31% |
๐จ๐ผ Curacao | 5.82% | 14.95% | 30.46% |
๐จ๐พ Cyprus | 5.95% | 14.83% | 33.36% |
๐จ๐ฟ Czechia | 8.29% | 20.64% | 26.94% |
๐จ๐ฉ Democratic Republic of Congo | 3.77% | 2.92% | 10.62% |
๐ฉ๐ฐ Denmark | 9.04% | 20.49% | 30.45% |
๐ฉ๐ฏ Djibouti | 1.99% | 4.54% | 19.68% |
๐ฉ๐ฒ Dominica | 7.67% | 9.53% | 34.28% |
๐ฉ๐ด Dominican Republic | 2.72% | 7.4% | 30.47% |
๐ช๐จ Ecuador | 5.2% | 7.83% | 31.97% |
๐ช๐ฌ Egypt | 2.95% | 4.83% | 21.77% |
๐ธ๐ป El Salvador | 3.93% | 8.22% | 36.02% |
๐ฌ๐ถ Equatorial Guinea | 5.53% | 3.12% | 15.13% |
๐ช๐ท Eritrea | 3.2% | 4.01% | 19.86% |
๐ช๐ช Estonia | 10.56% | 20.58% | 34.15% |
๐ธ๐ฟ Eswatini | 2.68% | 4.% | 16.26% |
๐ช๐น Ethiopia | 3.01% | 3.14% | 18.6% |
๐ซ๐ด Faeroe Islands | 7.59% | 17.92% | 26.91% |
๐ซ๐ฐ Falkland Islands | 8.27% | 11.08% | 35.86% |
๐ซ๐ฏ Fiji | 5.99% | 5.9% | 20.6% |
๐ซ๐ฎ Finland | 6.63% | 23.27% | 34.04% |
๐ซ๐ท France | 11.39% | 21.66% | 34.23% |
๐ฌ๐ซ French Guiana | 7.96% | 5.98% | 21.13% |
๐ต๐ซ French Polynesia | 3.% | 10.07% | 37.85% |
๐ฌ๐ฆ Gabon | 7.21% | 3.89% | 16.25% |
๐ฌ๐ฒ Gambia | 2.5% | 2.43% | 16.06% |
๐ฌ๐ช Georgia | 9.35% | 14.61% | 31.19% |
๐ฉ๐ช Germany | 9.46% | 22.41% | 33.72% |
๐ฌ๐ญ Ghana | 4.62% | 3.55% | 15.91% |
๐ฌ๐ฎ Gibraltar | 6.94% | 20.84% | 37.63% |
๐ฌ๐ท Greece | 6.8% | 22.82% | 37.52% |
๐ฌ๐ฑ Greenland | 3.06% | 10.02% | 29.16% |
๐ฌ๐ฉ Grenada | 5.12% | 10.07% | 30.54% |
๐ฌ๐ต Guadeloupe | 5.51% | 20.04% | 34.45% |
๐ฌ๐บ Guam | 1.11% | 11.84% | 31.19% |
๐ฌ๐น Guatemala | 2.31% | 4.91% | 28.05% |
๐ฌ๐ฌ Guernsey | 11.96% | 16.64% | 35.4% |
๐ฌ๐ณ Guinea | 5.39% | 3.32% | 14.% |
๐ฌ๐ผ Guinea-Bissau | 3.45% | 2.82% | 14.34% |
๐ฌ๐พ Guyana | 3.89% | 6.28% | 28.94% |
๐ญ๐น Haiti | 3.64% | 4.54% | 19.07% |
๐ญ๐ณ Honduras | 3.96% | 4.27% | 26.5% |
๐ญ๐ฐ Hong Kong | 2.48% | 20.47% | 41.64% |
๐ญ๐บ Hungary | 7.81% | 20.01% | 31.85% |
๐ฎ๐ธ Iceland | 7.52% | 15.33% | 34.25% |
๐ฎ๐ณ India | 3.1% | 6.9% | 29.81% |
๐ฎ๐ฉ Indonesia | 1.74% | 6.86% | 25.28% |
๐ฎ๐ท Iran | 5.22% | 7.62% | 33.72% |
๐ฎ๐ถ Iraq | 2.79% | 3.41% | 18.44% |
๐ฎ๐ช Ireland | 10.99% | 15.14% | 32.48% |
๐ฎ๐ฒ Isle of Man | 13.9% | 22.29% | 31.8% |
๐ฎ๐ฑ Israel | 4.% | 12.04% | 25.97% |
๐ฎ๐น Italy | 8.09% | 24.05% | 38.19% |
๐ฏ๐ฒ Jamaica | 3.83% | 7.45% | 44.05% |
๐ฏ๐ต Japan | 4.89% | 29.92% | 38.7% |
๐ฏ๐ช Jersey | 12.34% | 16.22% | 30.52% |
๐ฏ๐ด Jordan | 5.03% | 3.84% | 27.3% |
๐ฐ๐ฟ Kazakhstan | 6.47% | 8.04% | 19.58% |
๐ฐ๐ช Kenya | 5.28% | 2.87% | 16.98% |
๐ฐ๐ฎ Kiribati | 7.13% | 3.81% | 17.33% |
๐ฝ๐ฐ Kosovo | 5.33% | 10.19% | 43.35% |
๐ฐ๐ผ Kuwait | 2.88% | 4.93% | 31.56% |
๐ฐ๐ฌ Kyrgyzstan | 7.91% | 4.54% | 21.08% |
๐ฑ๐ฆ Laos | 2.13% | 4.45% | 25.24% |
๐ฑ๐ป Latvia | 10.12% | 21.86% | 32.86% |
๐ฑ๐ง Lebanon | 7.24% | 9.89% | 32.11% |
๐ฑ๐ธ Lesotho | 6.34% | 4.2% | 13.44% |
๐ฑ๐ท Liberia | 2.97% | 3.31% | 13.88% |
๐ฑ๐พ Libya | 5.21% | 4.86% | 27.77% |
๐ฑ๐ฎ Liechtenstein | 7.89% | 19.37% | 34.79% |
๐ฑ๐น Lithuania | 8.65% | 20.8% | 32.79% |
๐ฑ๐บ Luxembourg | 9.71% | 15.03% | 31.55% |
๐ฒ๐ด Macao | 3.11% | 13.% | 32.39% |
๐ฒ๐ฌ Madagascar | 3.25% | 3.35% | 16.21% |
๐ฒ๐ผ Malawi | 3.06% | 2.61% | 15.61% |
๐ฒ๐พ Malaysia | 4.91% | 7.5% | 30.78% |
๐ฒ๐ป Maldives | 3.14% | 4.78% | 35.61% |
๐ฒ๐ฑ Mali | 2.78% | 2.38% | 11.% |
๐ฒ๐น Malta | 7.42% | 19.13% | 38.26% |
๐ฒ๐ญ Marshall Islands | 5.68% | 4.56% | 17.8% |
๐ฒ๐ถ Martinique | 5.85% | 22.77% | 37.31% |
๐ฒ๐ท Mauritania | 1.44% | 3.22% | 15.03% |
๐ฒ๐บ Mauritius | 3.18% | 12.79% | 33.76% |
๐พ๐น Mayotte | 6.61% | 2.88% | 18.15% |
๐ฒ๐ฝ Mexico | 2.99% | 8.32% | 34.88% |
๐ซ๐ฒ Micronesia (country) | 4.11% | 6.16% | 27.59% |
๐ฒ๐ฉ Moldova | 7.56% | 12.98% | 26.36% |
๐ฒ๐จ Monaco | 15.64% | 35.92% | 30.16% |
๐ฒ๐ณ Mongolia | 3.87% | 4.61% | 26.18% |
๐ฒ๐ช Montenegro | 7.85% | 16.55% | 34.16% |
๐ฒ๐ธ Montserrat | 7.92% | 17.7% | 33.05% |
๐ฒ๐ฆ Morocco | 2.86% | 7.72% | 29.97% |
๐ฒ๐ฟ Mozambique | 3.13% | 2.57% | 13.43% |
๐ฒ๐ฒ Myanmar | 3.21% | 6.82% | 23.69% |
๐ณ๐ฆ Namibia | 4.1% | 3.97% | 15.38% |
๐ณ๐ท Nauru | 8.98% | 2.5% | 15.87% |
๐ณ๐ต Nepal | 2.74% | 6.09% | 29.51% |
๐ณ๐ฑ Netherlands | 7.76% | 20.31% | 32.89% |
๐ณ๐จ New Caledonia | 5.% | 11.02% | 31.61% |
๐ณ๐ฟ New Zealand | 9.09% | 16.31% | 33.2% |
๐ณ๐ฎ Nicaragua | 2.71% | 5.29% | 28.92% |
๐ณ๐ช Niger | .92% | 2.4% | 9.76% |
๐ณ๐ฌ Nigeria | 3.% | 2.97% | 12.31% |
๐ณ๐บ Niue | 4.79% | 15.16% | 22.55% |
๐ฐ๐ต North Korea | 2.72% | 11.71% | 30.49% |
๐ฒ๐ฐ North Macedonia | 5.87% | 14.91% | 36.56% |
๐ฒ๐ต Northern Mariana Islands | 2.95% | 10.81% | 32.09% |
๐ณ๐ด Norway | 9.52% | 18.44% | 31.65% |
๐ด๐ฒ Oman | 3.05% | 2.76% | 23.96% |
๐ต๐ฐ Pakistan | 5.48% | 4.27% | 17.23% |
๐ต๐ผ Palau | 8.59% | 9.93% | 21.48% |
๐ต๐ธ Palestine | 4.77% | 3.53% | 23.44% |
๐ต๐ฆ Panama | 3.57% | 8.77% | 30.03% |
๐ต๐ฌ Papua New Guinea | 1.09% | 3.19% | 16.81% |
๐ต๐พ Paraguay | 3.73% | 6.26% | 26.51% |
๐ต๐ช Peru | 3.43% | 8.41% | 30.33% |
๐ต๐ญ Philippines | 3.56% | 5.44% | 23.38% |
๐ต๐ฑ Poland | 5.22% | 18.55% | 35.69% |
๐ต๐น Portugal | 7.% | 22.9% | 36.28% |
๐ต๐ท Puerto Rico | 3.63% | 22.93% | 48.9% |
๐ถ๐ฆ Qatar | 3.5% | 1.52% | 15.01% |
๐ท๐ช Reunion | 3.81% | 13.28% | 32.4% |
๐ท๐ด Romania | 7.16% | 18.64% | 32.22% |
๐ท๐บ Russia | 4.8% | 15.8% | 27.86% |
๐ท๐ผ Rwanda | 2.76% | 3.2% | 17.36% |
๐ง๐ฑ Saint Barthlemy | 7.3% | 10.61% | 43.89% |
๐ธ๐ญ Saint Helena | 8.63% | 28.66% | 32.61% |
๐ฐ๐ณ Saint Kitts and Nevis | 5.36% | 10.13% | 29.79% |
๐ฑ๐จ Saint Lucia | 3.59% | 9.23% | 33.39% |
๐ฒ๐ซ Saint Martin (French part) | 4.47% | 11.14% | 30.08% |
๐ต๐ฒ Saint Pierre and Miquelon | 6.34% | 17.32% | 33.4% |
๐ป๐จ Saint Vincent and the Grenadines | 7.71% | 10.86% | 32.34% |
๐ผ๐ธ Samoa | 2.52% | 5.22% | 18.75% |
๐ธ๐ฒ San Marino | 10.15% | 20.47% | 35.73% |
๐ธ๐น Sao Tome and Principe | 3.92% | 3.76% | 15.6% |
๐ธ๐ฆ Saudi Arabia | 3.32% | 2.81% | 30.28% |
๐ธ๐ณ Senegal | 3.42% | 3.14% | 16.54% |
๐ท๐ธ Serbia | 6.15% | 20.56% | 37.55% |
๐ธ๐จ Seychelles | 10.68% | 8.16% | 28.84% |
๐ธ๐ฑ Sierra Leone | 3.02% | 3.14% | 15.52% |
๐ธ๐ฌ Singapore | 2.29% | 15.12% | 36.51% |
๐ธ๐ฝ Sint Maarten (Dutch part) | 12.03% | 10.57% | 34.51% |
๐ธ๐ฐ Slovakia | 6.63% | 16.98% | 33.4% |
๐ธ๐ฎ Slovenia | 7.52% | 20.96% | 33.59% |
๐ธ๐ง Solomon Islands | 4.03% | 3.47% | 15.29% |
๐ธ๐ด Somalia | 2.6% | 2.57% | 10.75% |
๐ฟ๐ฆ South Africa | 4.06% | 5.89% | 20.55% |
๐ฐ๐ท South Korea | 2.74% | 17.49% | 44.44% |
๐ธ๐ธ South Sudan | 3.48% | 2.89% | 13.11% |
๐ช๐ธ Spain | 7.23% | 20.27% | 38.72% |
๐ฑ๐ฐ Sri Lanka | 8.76% | 11.54% | 35.73% |
๐ธ๐ฉ Sudan | 3.03% | 3.5% | 13.28% |
๐ธ๐ท Suriname | 4.09% | 7.39% | 25.8% |
๐ธ๐ช Sweden | 10.19% | 20.25% | 31.83% |
๐จ๐ญ Switzerland | 9.49% | 19.31% | 32.61% |
๐ธ๐พ Syria | 7.66% | 4.68% | 24.62% |
๐น๐ผ Taiwan | 2.11% | 16.71% | 37.32% |
๐น๐ฏ Tajikistan | 4.34% | 3.47% | 19.43% |
๐น๐ฟ Tanzania | 2.2% | 3.1% | 14.97% |
๐น๐ญ Thailand | 3.21% | 15.21% | 39.17% |
๐น๐ฑ Timor | 3.14% | 5.21% | 25.42% |
๐น๐ฌ Togo | 4.29% | 3.13% | 11.77% |
๐น๐ฐ Tokelau | 4.7% | 8.66% | 25.03% |
๐น๐ด Tonga | 4.6% | 6.22% | 21.65% |
๐น๐น Trinidad and Tobago | 3.93% | 11.52% | 32.67% |
๐น๐ณ Tunisia | 4.4% | 9.02% | 31.24% |
๐น๐ท Turkey | 3.77% | 8.64% | 33.9% |
๐น๐ฒ Turkmenistan | 5.84% | 5.15% | 21.55% |
๐น๐จ Turks and Caicos Islands | 5.79% | 10.34% | 28.25% |
๐น๐ป Tuvalu | 4.98% | 6.48% | 16.15% |
๐บ๐ฌ Uganda | 2.87% | 1.69% | 14.33% |
๐บ๐ฆ Ukraine | 7.54% | 18.81% | 33.2% |
๐ฆ๐ช United Arab Emirates | 3.35% | 1.83% | 15.77% |
๐ฌ๐ง United Kingdom | 10.84% | 19.17% | 32.56% |
๐บ๐ธ United States | 8.18% | 17.13% | 30.47% |
๐ป๐ฎ United States Virgin Islands | 7.54% | 20.42% | 39.11% |
๐บ๐พ Uruguay | 8.23% | 15.58% | 35.98% |
๐บ๐ฟ Uzbekistan | 5.87% | 5.14% | 22.24% |
๐ป๐บ Vanuatu | 5.65% | 3.74% | 16.29% |
๐ป๐ช Venezuela | 2.29% | 8.61% | 27.71% |
๐ป๐ณ Vietnam | 4.13% | 9.12% | 30.02% |
๐ผ๐ซ Wallis and Futuna | 1.76% | 13.47% | 32.98% |
๐ช๐ญ Western Sahara | 2.82% | 5.84% | 23.73% |
๐พ๐ช Yemen | 3.98% | 2.66% | 18.25% |
๐ฟ๐ฒ Zambia | 2.76% | 1.75% | 12.66% |
๐ฟ๐ผ Zimbabwe | 3.18% | 3.32% | 14.22% |
๐ World | 5.13% | 9.82% | 24.03% |
Some of the places with high elderly shares today include high-income countries like Japan (30%), Italy (24%), and Finland (23%).
The lowest shares are concentrated in the Middle East and Africa. Many countries have just 2% of their population aged 65 years and older, such as Qatar, Uganda, and Afghanistan.
But over time, almost all countries are expected to see their older population segments grow. In just three decades, it is estimated that one-in-four European, North American, and Asian residents will be over 65 years of age.
By 2100, a variety of Asian countries and island nations facing low population growth are expected to see more than one-third of their populations aged 65 years or older, including South Korea and Jamaica at 44%. However, it’s actually Albania that’s the biggest outlier overall, with a projected 49% of its population to be aged 65 and older by 2100.
Passing the Generational Torch
The challenge of an aging population is set to impact all sectors of society, including labor and financial markets, demand for housing and transportation, and especially family structures and intergenerational ties.
One way to help grasp the nature of transition is to note the changing ratio between seniors and young children in the world population, as seen in the below crossover diagram:
Dropping fertility rates, in addition to improved child and infant mortality rates, are known to have played a major role in the plateauing population of children.
However, not all countries have witnessed this crossover yet, as it usually coincides with higher levels of economic development.
As countries such as India, Brazil, and South Africa reach higher levels of per capita income, they will be likely to follow down the paths of more advanced economies, eventually experiencing similar demographic fates and challenges.
-
Visual Capitalist3 weeks ago
Calling All Data Storytellers to Enter our Creator Program Challenge
-
AI5 days ago
Ranked: The World’s Top 25 Websites in 2023
-
Misc3 weeks ago
Ranked: Top 10 Cities Where International Travelers Spend the Most
-
AI4 days ago
Visualizing the Top U.S. States for AI Jobs
-
VC+3 weeks ago
Coming Soon: Here’s What’s Coming to VC+ Next
-
Personal Finance4 weeks ago
Ranked: The Best U.S. States for Retirement
-
Demographics2 weeks ago
Visualizing the American Workforce as 100 People
-
Commodities4 weeks ago
Charted: Commodities vs Equity Valuations (1970โ2023)