Healthcare
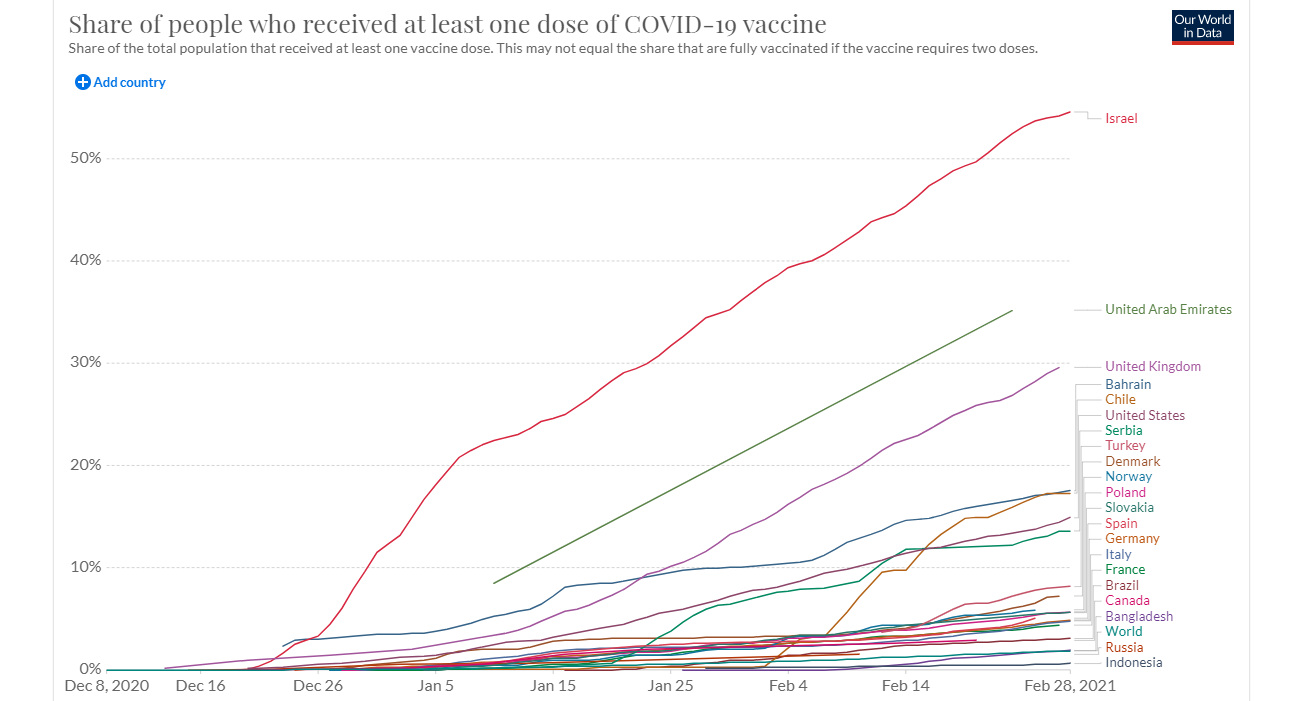
COVID-19 Vaccine Doses: Who’s Got At Least One?
Note: Use the “Add Country” (top left) function to add countries to the list. This visualization updates regularly.
COVID-19 Vaccine Doses: Who’s Got At Least One?
With COVID-19 vaccine rollouts well underway in some countries, a return to ‘normal life’ could come sooner than later.
That said, many jurisdictions have experienced serious delays and supply shortages that have made it difficult to distribute COVID-19 vaccine doses to their populations. As of mid-February, 130 countries had not been able to begin vaccinating at all.
This interactive chart from Our World in Data tracks the share of people in each country that have received COVID-19 vaccine doses so far.
The Global Vaccine Rollout
As of publication date, roughly 100 countries have begun vaccine distribution, with about seven different vaccines available for public use at this stage.
The sheer logistical challenge of doling out vaccines is immense. Experts estimate that 70-80% of the world’s population will need to be vaccinated to reach herd immunity. Additionally, some of the vaccines require two doses which adds extra time and complexity to the process.
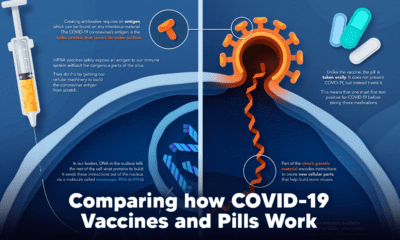
Here’s how the various vaccines compare in terms of required doses and levels of effectiveness.
| Vaccine | Number of Shots Required | Effectiveness |
|---|---|---|
| Pfizer/BioNTech | 2 | 95% |
| Moderna | 2 | 95% |
| Oxford/AstraZeneca | 2 | 70% |
| Johnson & Johnson | 1 | 66% |
| Novavax (*Novavax has not yet been approved for public use) | 2 | 89% |
| Sinovac Biotech | 2 | 50% |
| Gamaleya (Sputnik) | 2 | 92% |
| CanSino Biologics | 1 | 66% |
| Sinopharm | 2 | 79% |
Source: Bloomberg Vaccine Tracker
One key barrier to successfully administering vaccines is the prevalence of vaccine hesitancy around the globe.
For example, many people in Germany have been refusing the AstraZeneca vaccine due to a belief in its ineffectiveness and a preference for the ‘in-house’ German Pfizer/BioNTech vaccine. Although 1.45 million AstraZeneca COVID-19 vaccine doses have arrived in the country so far, just 270,000 have been administered.
Who’s Got at Least One Dose?
According to Bloomberg’s Vaccine Tracker, the current rate of doses being administered globally is more than 6 million per day. In particular, the U.S. has been remarkably efficient at administering doses, with a vaccine administration rate of over 1.7 million per day.
Here’s a breakdown of the countries who have begun vaccinating their populations and their current daily rate of doses administered.
| Country | Daily Rate of Doses Administered |
|---|---|
| 🇦🇷 Argentina | 43,534 |
| 🇦🇹 Austria | 21,073 |
| 🇧🇭 Bahrain | 3,364 |
| 🇧🇩 Bangladesh | 113,082 |
| 🇧🇧 Barbados | 3,503 |
| 🇧🇪 Belgium | 18,998 |
| 🇧🇲 Bermuda | 560 |
| 🇧🇷 Brazil | 215,713 |
| 🇧🇬 Bulgaria | 14,486 |
| 🇰🇭 Cambodia | 1,564 |
| 🇨🇦 Canada | 54,698 |
| 🇰🇾 Cayman Islands | 621 |
| 🇨🇱 Chile | 67,093 |
| 🇨🇳 China | 1,550,000 |
| 🇨🇴 Colombia | 11,080 |
| 🇨🇷 Costa Rica | 706 |
| 🇭🇷 Croatia | 9,511 |
| 🇨🇾 Cyprus | 3,201 |
| 🇨🇿 Czech Republic | 15,298 |
| 🇩🇰 Denmark | 16,682 |
| 🇩🇴 Dominican Republic | 9,356 |
| 🇪🇪 Estonia | 3,507 |
| 🇪🇺 EU | 888,360 |
| 🇫🇮 Finland | 14,204 |
| 🇫🇷 France | 119,107 |
| 🇩🇪 Germany | 160,127 |
| 🇬🇮 Gibraltar | 989 |
| 🇬🇷 Greece | 31,013 |
| 🇬🇬 Guernsey | 387 |
| 🇭🇺 Hungary | 41,563 |
| 🇮🇸 Iceland | 927 |
| 🇮🇳 India | 459,442 |
| 🇮🇩 Indonesia | 111,856 |
| 🇮🇪 Ireland | 11,865 |
| 🇮🇲 Isle of Man | 599 |
| 🇮🇱 Israel | 95,178 |
| 🇮🇹 Italy | 112,300 |
| 🇯🇵 Japan | 3,173 |
| 🇯🇪 Jersey | 480 |
| 🇰🇼 Kuwait | 7,000 |
| 🇱🇻 Latvia | 2,516 |
| 🇱🇧 Lebanon | 1,299 |
| 🇱🇹 Lithuania | 6,942 |
| 🇱🇺 Luxembourg | 1,211 |
| 🇲🇻 Maldives | 5,200 |
| 🇲🇹 Malta | 2,094 |
| 🇲🇽 Mexico | 103,872 |
| 🇲🇦 Morocco | 179,010 |
| 🇲🇲 Myanmar | 21 |
| 🇳🇵 Nepal | 11,837 |
| 🇳🇱 Netherlands | 24,871 |
| 🇳🇴 Norway | 22,157 |
| 🇴🇲 Oman | 1,629 |
| 🇵🇰 Pakistan | 6,705 |
| 🇵🇦 Panama | 8,389 |
| 🇵🇪 Peru | 14,701 |
| 🇵🇱 Poland | 88,323 |
| 🇵🇹 Portugal | 27,655 |
| 🇶🇦 Qatar | 2,632 |
| 🇷🇴 Romania | 21,950 |
| 🇷🇺 Russia | 35,000 |
| 🇸🇦 Saudi Arabia | 34,180 |
| 🇷🇸 Serbia | 24,009 |
| 🇸🇨 Seychelles | 2,054 |
| 🇸🇬 Singapore | 13,000 |
| 🇸🇰 Slovakia | 10,433 |
| 🇸🇮 Slovenia | 4,065 |
| 🇿🇦 South Africa | 7,569 |
| 🇪🇸 Spain | 129,384 |
| 🇱🇰 Sri Lanka | 4,755 |
| 🇸🇪 Sweden | 23,686 |
| 🇨🇭 Switzerland | 22,409 |
| 🇹🇷 Turkey | 284,090 |
| 🇬🇧 UK | 384,059 |
| 🇦🇪 UAE | 66,588 |
| 🇺🇸 U.S. | 1,735,053 |
| Global Total | 6,730,633 |
Source: Bloomberg Vaccine Tracker. Data as of Feb 28, 2021.
Certain countries appear to be on track to distribute all of their COVID-19 vaccine doses at an immensely quick rate. For example, the UK plans to vaccinate enough people to be able to lift all lockdown restrictions completely by the end of June 2021.
Additionally, the first COVAX rollouts have officially begun; COVAX is an initiative working to ensure equitable access to COVID-19 vaccines. Ghana was the first country to receive doses through the initiative.
Back to Normal?
Most countries are prioritizing vaccinating their high-risk groups first, from older adults to healthcare workers. That said, the planning required to vaccinate an entire population needs to be carefully thought out and often comes with immense logistical challenges.
While many countries have begun to immunize their populations, others have not been able to purchase doses yet. At the current pace, it could take a few years before things are completely back to normal and we reach herd immunity globally.


Healthcare
The Cost of an EpiPen in Major Markets
This visualization compares EpiPen prices around the world, with the U.S. having the highest prices by far.


The Cost of an EpiPen in Major Markets
This was originally posted on our Voronoi app. Download the app for free on iOS or Android and discover incredible data-driven charts from a variety of trusted sources.
EpiPens are auto-injectors containing epinephrine, a drug that can treat or reverse severe allergic reactions, potentially preventing death.
The global epinephrine market was valued at $1.75 billion in 2022 and is projected to reach $4.08 billion by 2030. North America represents over 60% of the market.
EpiPens, however, can be prohibitively expensive in some regions.
In this graphic, we present estimated EpiPen prices in major global markets, compiled by World Population Review and converted to U.S. dollars as of August 2023.
Why are U.S. Prices so High?
The U.S. stands out as the most expensive market for EpiPens, despite over 1 million Americans having epinephrine prescriptions. After Mylan (now part of Pfizer) acquired the rights to produce EpiPens in the U.S. in 2007, the cost of a two-pack skyrocketed to $600, up from about $60.
| Country | Price (USD) |
|---|---|
| 🇺🇸 U.S. | 300* |
| 🇯🇵 Japan | 98 |
| 🇩🇪 Germany | 85 |
| 🇨🇦 Canada | 80 |
| 🇫🇷 France | 76 |
| 🇦🇺 Australia | 66 |
| 🇬🇧 UK | 61 |
| 🇮🇳 India | 30 |
*Per unit cost. Commonly sold as a two-pack, meaning total cost is equal to $600
Former Mylan CEO Heather Bresch defended the price hikes to Congress, citing minimal profit margins. Mylan eventually settled with the U.S. government for a nine-figure sum.
Notably, EpiPens are available at a fraction of the cost in other developed countries like Japan, Germany, and Canada.
Making EpiPens More Affordable
Efforts to improve EpiPen affordability are underway in several U.S. states. For instance, the Colorado House approved a $60 price cap on epinephrine, now under review by the state Senate.
Similar measures in Rhode Island, Delaware, Missouri, and Vermont aim to ensure insurance coverage for epinephrine, which is not currently mandatory, although most health plans cover it.

-

 Education1 week ago
How Hard Is It to Get Into an Ivy League School?
-

 Technology2 weeks ago
Ranked: Semiconductor Companies by Industry Revenue Share
-

 Markets2 weeks ago
Ranked: The World’s Top Flight Routes, by Revenue
-

 Demographics2 weeks ago
Population Projections: The World’s 6 Largest Countries in 2075
-

 Markets2 weeks ago
The Top 10 States by Real GDP Growth in 2023
-

 Demographics2 weeks ago
The Smallest Gender Wage Gaps in OECD Countries
-

 Economy2 weeks ago
Where U.S. Inflation Hit the Hardest in March 2024
-

 Environment2 weeks ago
Top Countries By Forest Growth Since 2001