Datastream
Visualizing Amazon’s Rising Shipping Costs


The Briefing
- Amazon’s shipping and fulfillment costs have soared to over $150 billion
- Global supply chain constraints have accelerated these costs, which are now 40x their 2009 levels
Visualizing Amazon’s Rising Shipping Costs
Most investors would agree that Amazon has been a winner during the COVID-19 pandemic. After all, in two short years from 2019 to 2021, sales soared to $469 billion from $280 billion and their market cap surged towards a $1.7 trillion valuation.
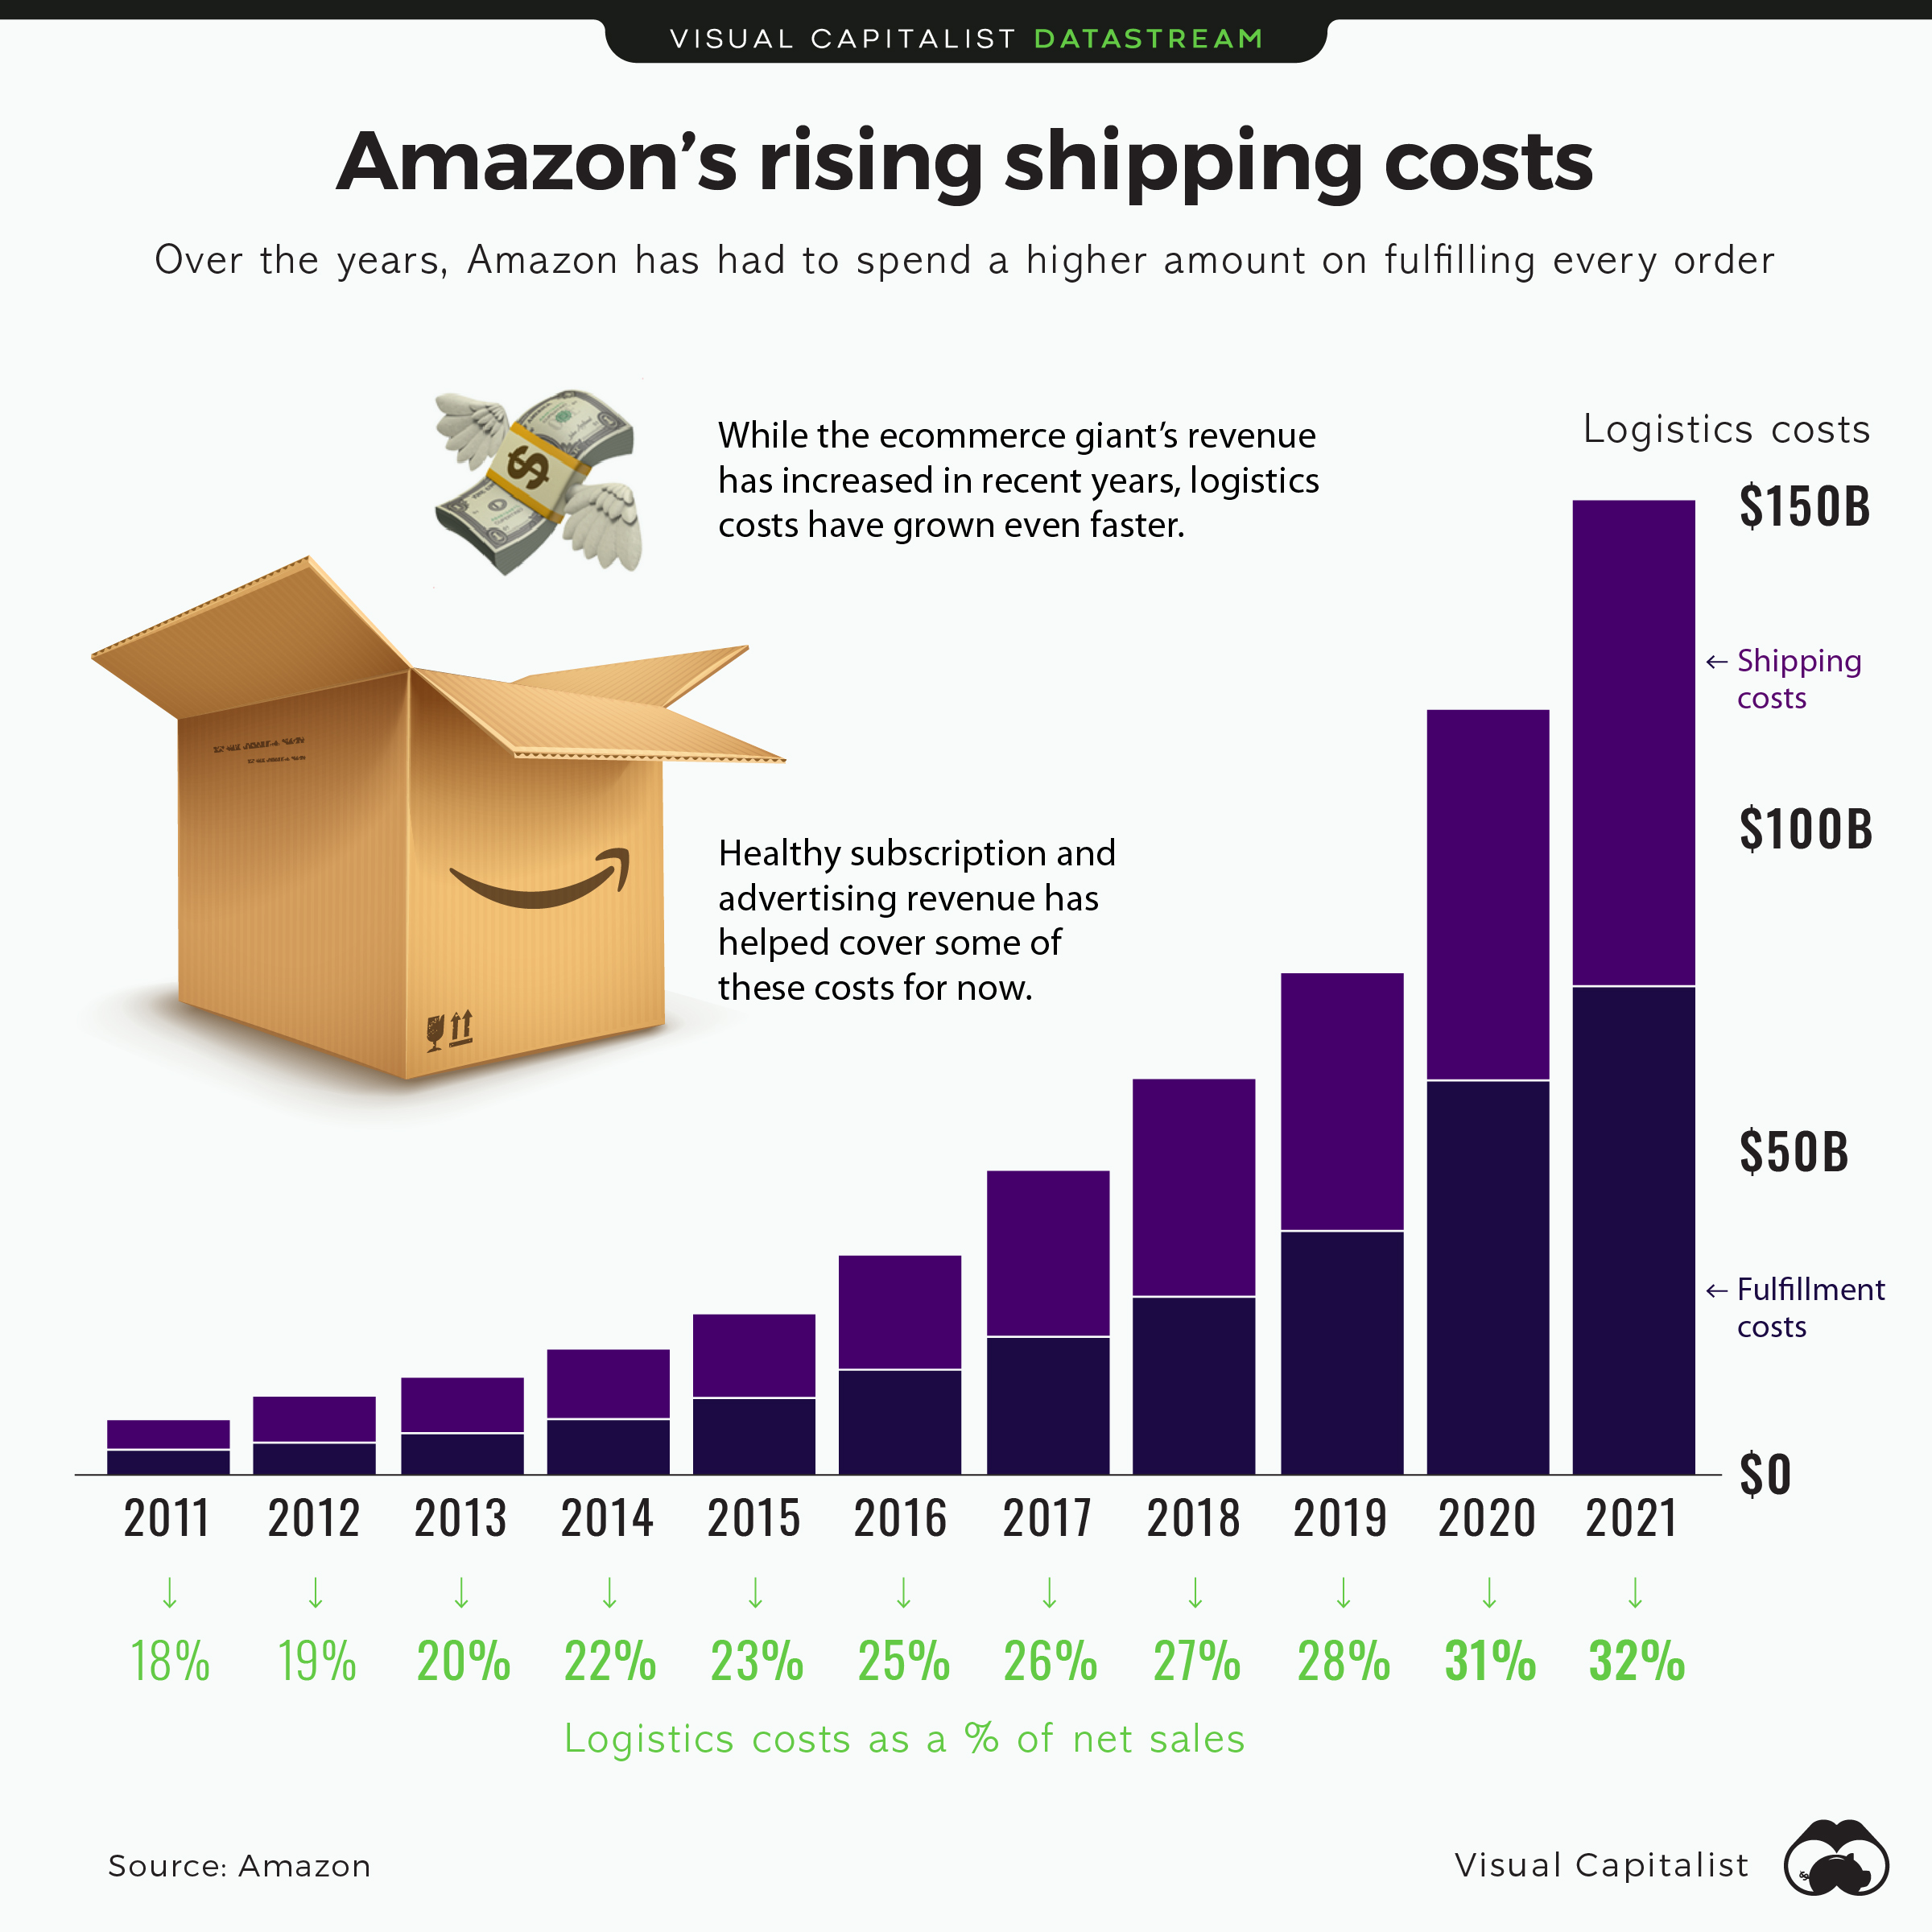
But even the best of companies have had to navigate choppy waters and uncertainty during this time. For Amazon, this has come in the form of cost pressures in their shipping and fulfillment department, which are now representing an increasingly large share of revenues.
Just how large are Amazon’s shipping and fulfillment costs becoming?
In 2021, shipping and fulfillment costs added up to $151.8 billion. Shipping, which includes sortation, delivery centers, and transportation costs amounted to $76.7 billion. Fulfillment costs, which include cost of operating and staff fulfillment centers, were $75.1 billion.
As a result of these trends, Amazon’s shipping and fulfillment expenses now represent 32% of their revenues:
| Year | Cost as a % of revenue |
|---|---|
| 2021 | 32% |
| 2020 | 31% |
| 2019 | 28% |
| 2018 | 27% |
| 2017 | 26% |
| 2016 | 25% |
| 2015 | 23% |
| 2014 | 22% |
| 2013 | 20% |
| 2012 | 19% |
| 2011 | 18% |
As you can see, costs are escalating, and today’s figure is almost twice that of the 18% figure seen in 2011.
Amazon Web Services to the Rescue
While these expenses are rising, it’s important to remember that Amazon’s profits are still healthy. They generated $33 billion in profits for 2021. One reason for this is that the majority of Amazon’s profits never came from ecommerce to begin with. Amazon Web Services (AWS), which is a much higher margin segment of their business, accounts for over 50% of their operating profits, but only 13% of their sales.
AWS is such a profit generating machine that prominent investors have called for Amazon to spin off AWS into its own entity. They argue that pure play technology companies are often assigned a higher equity multiple, and spinning off AWS would be accretive to shareholder value.
Rising Costs to Scale
The $151.8 billion in expenditures towards shipping and fulfillment is absolutely massive. On a per minute basis, this results in $288K per minute in expenses, compared to their $956K in revenue per minute.
Another way to put this gargantuan figure to scale is to remember that this business expense is greater than the equity value of about 90% of all companies in the S&P 500.
Where does this data come from?
Source: Statista
Notes: Fulfillment costs include customer service centers and payment processing costs


Datastream
Can You Calculate Your Daily Carbon Footprint?
Discover how the average person’s carbon footprint impacts the environment and learn how carbon credits can offset your carbon footprint.


The Briefing
- A person’s carbon footprint is substantial, with activities such as food consumption creating as much as 4,500 g of CO₂ emissions daily.
- By purchasing carbon credits from Carbon Streaming Corporation, you can offset your own emissions and fund positive climate action.
Your Everyday Carbon Footprint
While many large businesses and countries have committed to net-zero goals, it is essential to acknowledge that your everyday activities also contribute to global emissions.
In this graphic, sponsored by Carbon Streaming Corporation, we will explore how the choices we make and the products we use have a profound impact on our carbon footprint.
Carbon Emissions by Activity
Here are some of the daily activities and products of the average person and their carbon footprint, according to Clever Carbon.
| Household Activities & Products | CO2 Emissions (g) |
|---|---|
| 💡 Standard Light Bulb (100 watts, four hours) | 172 g |
| 📱 Mobile Phone Use (195 minutes per day)* | 189 g |
| 👕 Washing Machine (0.63 kWh) | 275 g |
| 🔥 Electric Oven (1.56 kWh) | 675 g |
| ♨️ Tumble Dryer (2.5 kWh) | 1,000 g |
| 🧻 Toilet Roll (2 ply) | 1,300 g |
| 🚿 Hot Shower (10 mins) | 2,000 g |
| 🚙 Daily Commute (one hour, by car) | 3,360 g |
| 🍽️ Average Daily Food Consumption (three meals of 600 calories) | 4,500 g |
| *Phone use based on yearly use of 69kg per the source, Reboxed | |
Your choice of transportation plays a crucial role in determining your carbon footprint. For instance, a 15 km daily commute to work on public transport generates an average of 1,464 g of CO₂ emissions. Compared to 3,360 g—twice the volume for a journey the same length by car.
By opting for more sustainable modes of transport, such as cycling, walking, or public transportation, you can significantly reduce your carbon footprint.
Addressing Your Carbon Footprint
One way to compensate for your emissions is by purchasing high-quality carbon credits.
Carbon credits are used to help fund projects that avoid, reduce or remove CO₂ emissions. This includes nature-based solutions such as reforestation and improved forest management, or technology-based solutions such as the production of biochar and carbon capture and storage (CCS).
While carbon credits offer a potential solution for individuals to help reduce global emissions, public awareness remains a significant challenge. A BCG-Patch survey revealed that only 34% of U.S. consumers are familiar with carbon credits, and only 3% have purchased them in the past.
About Carbon Streaming
By financing the creation or expansion of carbon projects, Carbon Streaming Corporation secures the rights to future carbon credits generated by these sustainable projects. You can then purchase these carbon credits to help fund climate solutions around the world and compensate for your own emissions.
Ready to get involved?
>> Learn more about purchasing carbon credits at Carbon Streaming

-

 Misc1 week ago
How Hard Is It to Get Into an Ivy League School?
-

 Technology2 weeks ago
Ranked: Semiconductor Companies by Industry Revenue Share
-

 Markets2 weeks ago
Ranked: The World’s Top Flight Routes, by Revenue
-

 Countries2 weeks ago
Population Projections: The World’s 6 Largest Countries in 2075
-

 Markets2 weeks ago
The Top 10 States by Real GDP Growth in 2023
-

 Demographics2 weeks ago
The Smallest Gender Wage Gaps in OECD Countries
-

 United States2 weeks ago
Where U.S. Inflation Hit the Hardest in March 2024
-

 Green2 weeks ago
Top Countries By Forest Growth Since 2001