Markets
How to Avoid Mediocre Leadership in Trying Times
In today’s complex world, leaders are being asked to step up in dynamic and unexpected ways.
Unfortunately, many of them are not equipped with the tools they need to lead under pressure. As a result, they fail to serve themselves and their employees effectively, and put the future of their entire organization at risk.
The Behaviors That Result in Mediocre Leadership
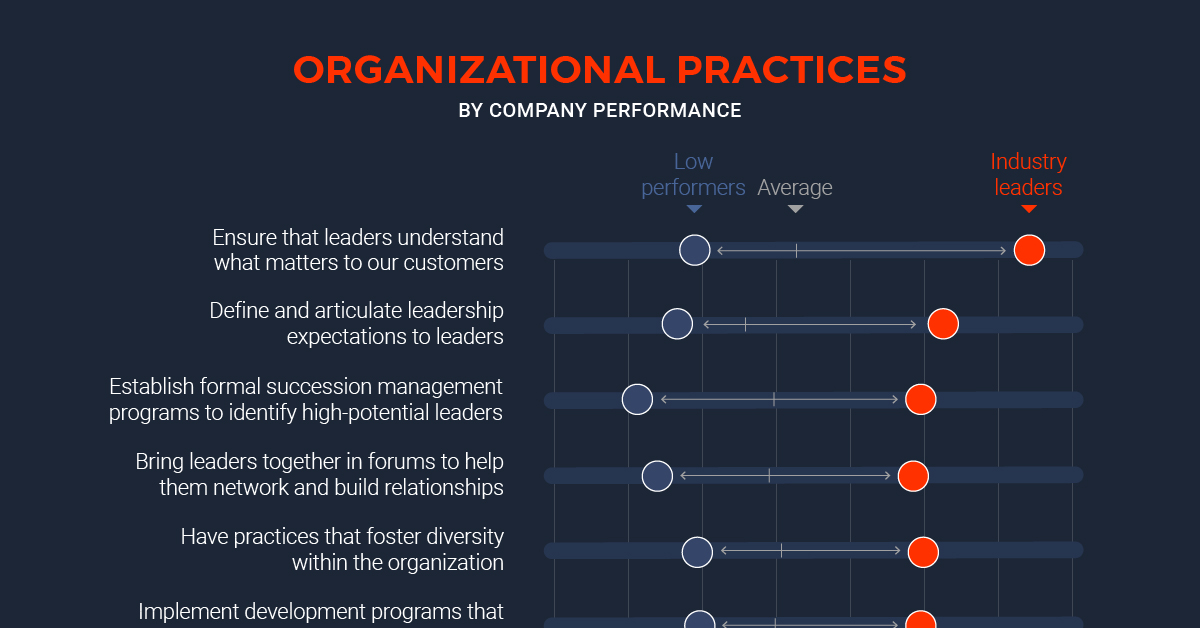
Today’s infographic from Vince Molinaro’s Accountable Leaders reveals the common behaviors that can result in leaders becoming mediocre due to mounting day-to-day pressures.

Order Vince Molinaro’s new book, Accountable Leaders
Leadership accountability is one of the most important ingredients for driving business growth and maintaining a healthy corporate culture.
How can leaders set the tone for accountability in their organization?
Accountable Leaders Invest in Themselves
Every leader has an obligation to their employees, their customers and their community, but failing to put themselves first could have serious consequences—and cause a ripple effect across other parts of the business.
In fact, 40% to 80% of a manager’s time is spent on activities that add little to no value, when the majority of their time should be spent investing in their personal development.
By not having a holistic view of their development, leaders succumb to the day-to-day challenges that come with managing a company, such as:
- Getting in over their head
- Confusing acting rough with tough
- Mistaking effort for results
- Feeling like the victim
- Being insecure and unable to use their voice
- Constantly needing to hear good news
- Needing to win at all costs
- Waiting for permission to act from senior leaders
- Being driven to distraction and lacking focus
- Not learning from past mistakes
Moreover, if leaders struggle to meet expectations, the risk is that they either give up, or ultimately become a mediocre leader—but what exactly does that look like?
The Characteristics of a Mediocre Leader
Mediocre leadership has become remarkably commonplace, yet it is not always easy for organizations to identify.
Here are the five problematic characteristics of a mediocre leader:
- Blames others: Never personally acknowledges their role or contribution to any mistake or failure.
- Selfish and self-serving: Regularly acts out of self-interest and brings a sense of entitlement to the role.
- Uncivil and mean: Routinely mistreats, demeans and insults others, usually in public.
- Inept and incompetent: Makes bad decisions, resulting in a trail of disaster behind them.
- Lacks initiative: Looks for the easy way out by deflecting responsibility.
Leaders cite several reasons for falling into this mediocre leadership trap, including their fear failure, having unclear leadership expectations, and being overloaded with tasks that could be delegated elsewhere.
The Danger of Mediocre Leadership
It comes as no surprise that this style of leadership has a negative impact on employees, with 73% claiming that they spend a significant amount of time dealing with problems that arise from an ineffective manager.
However, employees will put up with a mediocre leader because they find the work itself meaningful, or they value the relationship they have with their peers.
But while mediocre leaders can bring a team closer together through their collective misery, eventually this reaches a tipping point which could result in a high staff turnover or low rates of employee engagement.
Avoid a Culture of Mediocrity
As we navigate uncertain waters, leaders must not only demonstrate agility and resilience—they must also advocate for a culture of accountability.
”Senior leaders create the culture and set the tone for the organization. It’s imperative that they drive the set of behaviors influencing the behaviors of the next line leaders.”
—Molinaro, Vince (2020), Accountable Leaders.
But in order to maintain accountability across an organization, mediocre behavior must be addressed, and difficult decisions will need to be made.
Markets
U.S. Debt Interest Payments Reach $1 Trillion
U.S. debt interest payments have surged past the $1 trillion dollar mark, amid high interest rates and an ever-expanding debt burden.

U.S. Debt Interest Payments Reach $1 Trillion
This was originally posted on our Voronoi app. Download the app for free on iOS or Android and discover incredible data-driven charts from a variety of trusted sources.
The cost of paying for America’s national debt crossed the $1 trillion dollar mark in 2023, driven by high interest rates and a record $34 trillion mountain of debt.
Over the last decade, U.S. debt interest payments have more than doubled amid vast government spending during the pandemic crisis. As debt payments continue to soar, the Congressional Budget Office (CBO) reported that debt servicing costs surpassed defense spending for the first time ever this year.
This graphic shows the sharp rise in U.S. debt payments, based on data from the Federal Reserve.
A $1 Trillion Interest Bill, and Growing
Below, we show how U.S. debt interest payments have risen at a faster pace than at another time in modern history:
| Date | Interest Payments | U.S. National Debt |
|---|---|---|
| 2023 | $1.0T | $34.0T |
| 2022 | $830B | $31.4T |
| 2021 | $612B | $29.6T |
| 2020 | $518B | $27.7T |
| 2019 | $564B | $23.2T |
| 2018 | $571B | $22.0T |
| 2017 | $493B | $20.5T |
| 2016 | $460B | $20.0T |
| 2015 | $435B | $18.9T |
| 2014 | $442B | $18.1T |
| 2013 | $425B | $17.2T |
| 2012 | $417B | $16.4T |
| 2011 | $433B | $15.2T |
| 2010 | $400B | $14.0T |
| 2009 | $354B | $12.3T |
| 2008 | $380B | $10.7T |
| 2007 | $414B | $9.2T |
| 2006 | $387B | $8.7T |
| 2005 | $355B | $8.2T |
| 2004 | $318B | $7.6T |
| 2003 | $294B | $7.0T |
| 2002 | $298B | $6.4T |
| 2001 | $318B | $5.9T |
| 2000 | $353B | $5.7T |
| 1999 | $353B | $5.8T |
| 1998 | $360B | $5.6T |
| 1997 | $368B | $5.5T |
| 1996 | $362B | $5.3T |
| 1995 | $357B | $5.0T |
| 1994 | $334B | $4.8T |
| 1993 | $311B | $4.5T |
| 1992 | $306B | $4.2T |
| 1991 | $308B | $3.8T |
| 1990 | $298B | $3.4T |
| 1989 | $275B | $3.0T |
| 1988 | $254B | $2.7T |
| 1987 | $240B | $2.4T |
| 1986 | $225B | $2.2T |
| 1985 | $219B | $1.9T |
| 1984 | $205B | $1.7T |
| 1983 | $176B | $1.4T |
| 1982 | $157B | $1.2T |
| 1981 | $142B | $1.0T |
| 1980 | $113B | $930.2B |
| 1979 | $96B | $845.1B |
| 1978 | $84B | $789.2B |
| 1977 | $69B | $718.9B |
| 1976 | $61B | $653.5B |
| 1975 | $55B | $576.6B |
| 1974 | $50B | $492.7B |
| 1973 | $45B | $469.1B |
| 1972 | $39B | $448.5B |
| 1971 | $36B | $424.1B |
| 1970 | $35B | $389.2B |
| 1969 | $30B | $368.2B |
| 1968 | $25B | $358.0B |
| 1967 | $23B | $344.7B |
| 1966 | $21B | $329.3B |
Interest payments represent seasonally adjusted annual rate at the end of Q4.
At current rates, the U.S. national debt is growing by a remarkable $1 trillion about every 100 days, equal to roughly $3.6 trillion per year.
As the national debt has ballooned, debt payments even exceeded Medicaid outlays in 2023—one of the government’s largest expenditures. On average, the U.S. spent more than $2 billion per day on interest costs last year. Going further, the U.S. government is projected to spend a historic $12.4 trillion on interest payments over the next decade, averaging about $37,100 per American.
Exacerbating matters is that the U.S. is running a steep deficit, which stood at $1.1 trillion for the first six months of fiscal 2024. This has accelerated due to the 43% increase in debt servicing costs along with a $31 billion dollar increase in defense spending from a year earlier. Additionally, a $30 billion increase in funding for the Federal Deposit Insurance Corporation in light of the regional banking crisis last year was a major contributor to the deficit increase.
Overall, the CBO forecasts that roughly 75% of the federal deficit’s increase will be due to interest costs by 2034.
-

 Green2 weeks ago
Ranked: Top Countries by Total Forest Loss Since 2001
-

 Travel2 weeks ago
Ranked: The World’s Top Flight Routes, by Revenue
-

 Technology2 weeks ago
Ranked: Semiconductor Companies by Industry Revenue Share
-

 Money2 weeks ago
Which States Have the Highest Minimum Wage in America?
-

 Real Estate2 weeks ago
Ranked: The Most Valuable Housing Markets in America
-

 Markets2 weeks ago
Charted: Big Four Market Share by S&P 500 Audits
-

 AI2 weeks ago
The Stock Performance of U.S. Chipmakers So Far in 2024
-

 Automotive2 weeks ago
Almost Every EV Stock is Down After Q1 2024

