Markets
Visualizing the Future of the Pharma Market
Visualizing the Future of the Pharma Market
Around the world, people are living longer.
By 2050, there will be two billion people that are 60 years or older globally. Meanwhile, the amount of seniors (65+ years old) in the U.S. will double to 100 million by 2060.
To meet the needs of this aging population, we will continue to need larger quantities and more varieties of prescription drug treatments – an industry that is expected to skyrocket to $1.2 trillion in size by 2024.
Drug Sales, by Segment
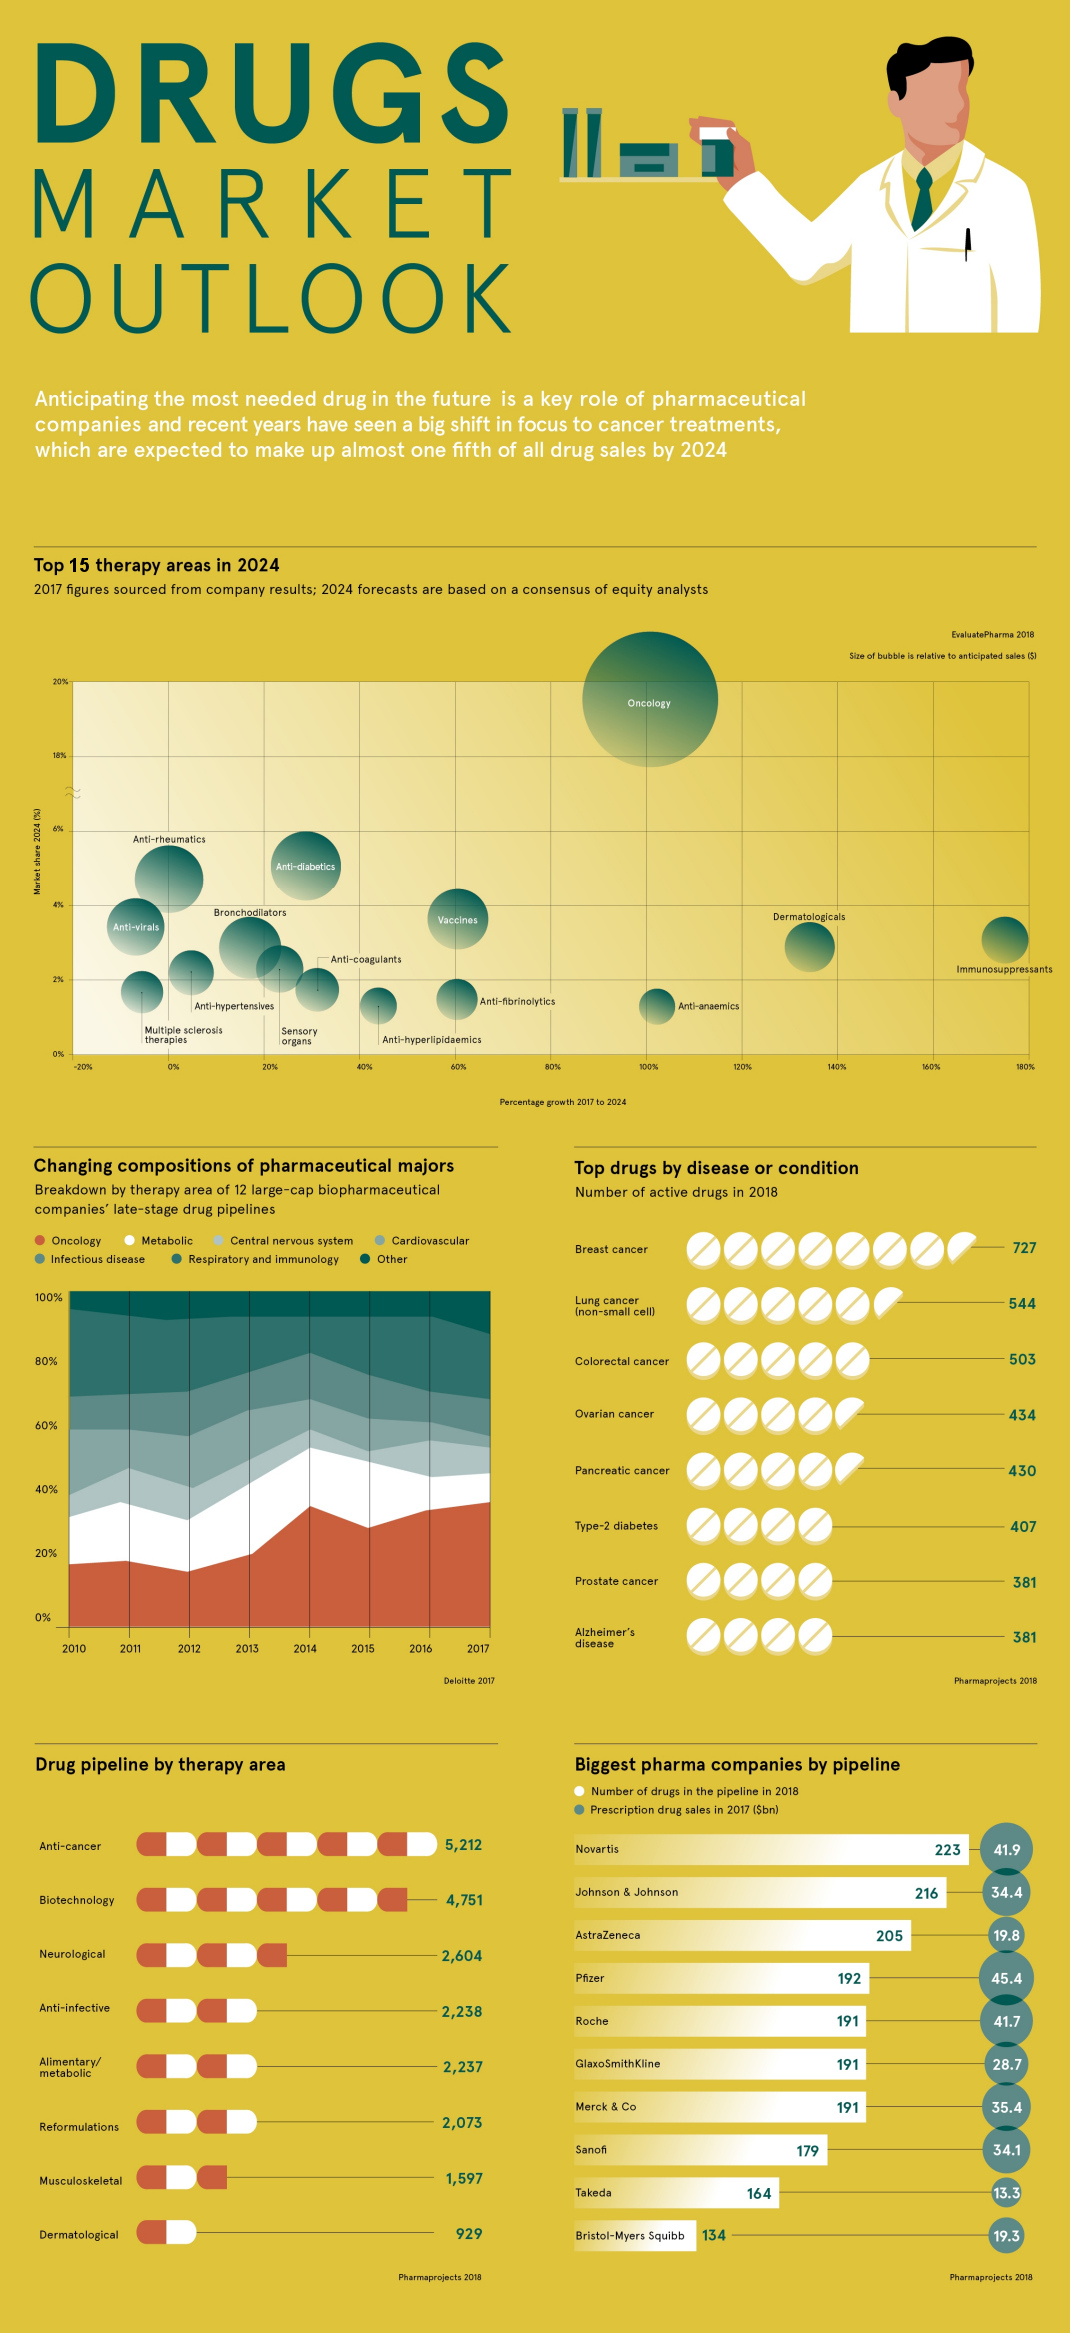
Today’s infographic comes to us from Raconteur, and it highlights the most anticipated drug treatments and therapy areas for the pharmaceutical industry.
It starts by breaking down the massive pharma market into therapy segments, showing a forecast for the size and growth for each category.
Here is the data for the top 15 segments, sorted by projected worldwide prescription drug sales in 2024:
| Rank | Therapy Area | 2017 sales | 2024 sales | CAGR |
|---|---|---|---|---|
| #1 | Oncology | $104B | $233B | +12.2% |
| #2 | Anti-diabetics | $46.1B | $59.5B | +3.3% |
| #3 | Anti-rheumatics | $55.7B | $56.7B | +0.2% |
| #4 | Vaccines | $27.7B | $44.6B | +7.1% |
| #5 | Anti-virals | $42.4B | $39.9B | -0.9% |
| #6 | Immunosuppressants | $13.7B | $38.1B | +15.7% |
| #7 | Bronchodilators | $27.2B | $32.3B | +2.5% |
| #8 | Dermatologicals | $12.9B | $30.3B | +13% |
| #9 | Sensory Organs | $21.6B | $26.9B | +3.2% |
| #10 | Anti-hypertensives | $23B | $24.4B | +0.8% |
| #11 | Anti-coagulants | $16.8B | $22.9B | +4.6% |
| #12 | MS Therapies | $22.7B | $21.5B | -0.8% |
| #13 | Anti-fibrinolytics | $12.7B | $20.4B | +7.1% |
| #14 | Anti-hyperlipidaemics | $11.3B | $16.4B | +5.5% |
| #15 | Anti-anaemics | $7.6B | $15.7B | +11% |
| Other | $379B | $567B | +5.9% | |
| Total | $825B | $1249B | +6.1% |
This data, which comes from a recent report from EvaluatePharma, helps showcase a few key insights.
Firstly, the oncology therapy area – which makes drugs that are used to treat various forms of cancer – is by far the largest in the pharma world with $107 billion in sales in 2017. It’s also projected to maintain its dominance going forward, growing at an impressive 12.2% CAGR to $233 billion by 2024.
Next, while sales in cancer-related drugs will be the most in absolute terms, the fastest growing treatment area is actually in immunosuppressants – a segment of drugs that make a body less likely to reject a transplanted organ, such as a liver, heart, or kidney. It’s projected that this segment will grow at 15.7% per year, eventually becoming the sixth largest pharma segment at $38.1 billion in 2024.
Lastly, while sales in the pharma market will be averaging 6.1% in annual growth as a whole, there are two major segments that will see negative annual growth going forward: Anti-virals (-0.9%) and MS Therapies (-0.8%).
The Battle Against Cancer
Currently, there are more drugs used for treating cancer than for any other type of disease or condition.
| Rank | Disease or Condition | Number of active drugs |
|---|---|---|
| #1 | Breast cancer | 727 |
| #2 | Lung cancer | 544 |
| #3 | Colorectal cancer | 503 |
| #4 | Ovarian cancer | 434 |
| #5 | Pancreatic cancer | 430 |
| #6 | Type-2 diabetes | 407 |
| #7 | Prostate cancer | 381 |
| - | Alzheimer's disease | 381 |
Unfortunately, even though many cancer drugs are available on the market already, the debilitating disease is still a leading cause of death. Existing drugs are used in treatments of chemotherapy or hormone therapy, but it’s clear that there is still plenty of room for progress to be made against the disease.
For these reasons – combined with the estimate that nearly 40% of Americans will be diagnosed with some form of cancer during their lifetimes – it’s no surprise to see that companies have yet even more cancer drugs in the pipeline:
| Rank | Therapy area | Number of drugs in pipeline |
|---|---|---|
| #1 | Anti-cancer | 5,212 |
| #2 | Biotechnology | 4,751 |
| #3 | Neurological | 2,604 |
| #4 | Anti-infective | 2,238 |
| #5 | Alimentary/metabolic | 2,237 |
| #6 | Reformulations | 2,073 |
| #7 | Musculoskeletal | 1,597 |
| #8 | Dermatological | 929 |
As more drugs get approved from the above pipeline, it is projected that $1 of every $5 spent on prescription drugs in 2024 will be going towards cancer-related treatments.


Markets
The European Stock Market: Attractive Valuations Offer Opportunities
On average, the European stock market has valuations that are nearly 50% lower than U.S. valuations. But how can you access the market?


European Stock Market: Attractive Valuations Offer Opportunities
Europe is known for some established brands, from L’Oréal to Louis Vuitton. However, the European stock market offers additional opportunities that may be lesser known.
The above infographic, sponsored by STOXX, outlines why investors may want to consider European stocks.
Attractive Valuations
Compared to most North American and Asian markets, European stocks offer lower or comparable valuations.
| Index | Price-to-Earnings Ratio | Price-to-Book Ratio |
|---|---|---|
| EURO STOXX 50 | 14.9 | 2.2 |
| STOXX Europe 600 | 14.4 | 2 |
| U.S. | 25.9 | 4.7 |
| Canada | 16.1 | 1.8 |
| Japan | 15.4 | 1.6 |
| Asia Pacific ex. China | 17.1 | 1.8 |
Data as of February 29, 2024. See graphic for full index names. Ratios based on trailing 12 month financials. The price to earnings ratio excludes companies with negative earnings.
On average, European valuations are nearly 50% lower than U.S. valuations, potentially offering an affordable entry point for investors.
Research also shows that lower price ratios have historically led to higher long-term returns.
Market Movements Not Closely Connected
Over the last decade, the European stock market had low-to-moderate correlation with North American and Asian equities.
The below chart shows correlations from February 2014 to February 2024. A value closer to zero indicates low correlation, while a value of one would indicate that two regions are moving in perfect unison.
| EURO STOXX 50 | STOXX EUROPE 600 | U.S. | Canada | Japan | Asia Pacific ex. China |
|
|---|---|---|---|---|---|---|
| EURO STOXX 50 | 1.00 | 0.97 | 0.55 | 0.67 | 0.24 | 0.43 |
| STOXX EUROPE 600 | 1.00 | 0.56 | 0.71 | 0.28 | 0.48 | |
| U.S. | 1.00 | 0.73 | 0.12 | 0.25 | ||
| Canada | 1.00 | 0.22 | 0.40 | |||
| Japan | 1.00 | 0.88 | ||||
| Asia Pacific ex. China | 1.00 |
Data is based on daily USD returns.
European equities had relatively independent market movements from North American and Asian markets. One contributing factor could be the differing sector weights in each market. For instance, technology makes up a quarter of the U.S. market, but health care and industrials dominate the broader European market.
Ultimately, European equities can enhance portfolio diversification and have the potential to mitigate risk for investors.
Tracking the Market
For investors interested in European equities, STOXX offers a variety of flagship indices:
| Index | Description | Market Cap |
|---|---|---|
| STOXX Europe 600 | Pan-regional, broad market | €10.5T |
| STOXX Developed Europe | Pan-regional, broad-market | €9.9T |
| STOXX Europe 600 ESG-X | Pan-regional, broad market, sustainability focus | €9.7T |
| STOXX Europe 50 | Pan-regional, blue-chip | €5.1T |
| EURO STOXX 50 | Eurozone, blue-chip | €3.5T |
Data is as of February 29, 2024. Market cap is free float, which represents the shares that are readily available for public trading on stock exchanges.
The EURO STOXX 50 tracks the Eurozone’s biggest and most traded companies. It also underlies one of the world’s largest ranges of ETFs and mutual funds. As of November 2023, there were €27.3 billion in ETFs and €23.5B in mutual fund assets under management tracking the index.
“For the past 25 years, the EURO STOXX 50 has served as an accurate, reliable and tradable representation of the Eurozone equity market.”
— Axel Lomholt, General Manager at STOXX
Partnering with STOXX to Track the European Stock Market
Are you interested in European equities? STOXX can be a valuable partner:
- Comprehensive, liquid and investable ecosystem
- European heritage, global reach
- Highly sophisticated customization capabilities
- Open architecture approach to using data
- Close partnerships with clients
- Part of ISS STOXX and Deutsche Börse Group
With a full suite of indices, STOXX can help you benchmark against the European stock market.
Learn how STOXX’s European indices offer liquid and effective market access.

-

 Economy2 days ago
Economic Growth Forecasts for G7 and BRICS Countries in 2024
The IMF has released its economic growth forecasts for 2024. How do the G7 and BRICS countries compare?
-

 Markets2 weeks ago
U.S. Debt Interest Payments Reach $1 Trillion
U.S. debt interest payments have surged past the $1 trillion dollar mark, amid high interest rates and an ever-expanding debt burden.
-

 United States2 weeks ago
Ranked: The Largest U.S. Corporations by Number of Employees
We visualized the top U.S. companies by employees, revealing the massive scale of retailers like Walmart, Target, and Home Depot.
-

 Markets2 weeks ago
The Top 10 States by Real GDP Growth in 2023
This graphic shows the states with the highest real GDP growth rate in 2023, largely propelled by the oil and gas boom.
-

 Markets2 weeks ago
Ranked: The World’s Top Flight Routes, by Revenue
In this graphic, we show the highest earning flight routes globally as air travel continued to rebound in 2023.
-

 Markets3 weeks ago
Ranked: The Most Valuable Housing Markets in America
The U.S. residential real estate market is worth a staggering $47.5 trillion. Here are the most valuable housing markets in the country.


-

 Debt1 week ago
How Debt-to-GDP Ratios Have Changed Since 2000
-
Markets2 weeks ago
Ranked: The World’s Top Flight Routes, by Revenue
-

 Countries2 weeks ago
Population Projections: The World’s 6 Largest Countries in 2075
-
Markets2 weeks ago
The Top 10 States by Real GDP Growth in 2023
-

 Demographics2 weeks ago
The Smallest Gender Wage Gaps in OECD Countries
-

 United States2 weeks ago
Where U.S. Inflation Hit the Hardest in March 2024
-

 Green2 weeks ago
Top Countries By Forest Growth Since 2001
-
United States2 weeks ago
Ranked: The Largest U.S. Corporations by Number of Employees