Markets
The 8 Ways Urban Demographics are Changing
The 8 Ways Urban Demographics are Changing
Cities are what keep the global economic machine humming.
Over 80% of the world’s economic output is derived from activities in cities – and more specifically, it’s estimated that 60% of GDP growth occurs in just the top 600 urban centers.
Given the above, it’s fair to say that the destiny of humankind is directly linked to what happens in major cities. Further, how urbanization plays out over time could end up having a significant ripple effect on the economy, and we should pay close attention to such trends.
Urbanization 2.0
Today’s infographic comes to us from Raconteur, and it showcases eight different ways that urban demographics are evolving.
Below we will summarize the changes, along with potential impacts on the economy:
1. A Higher Percentage of Urban Dwellers
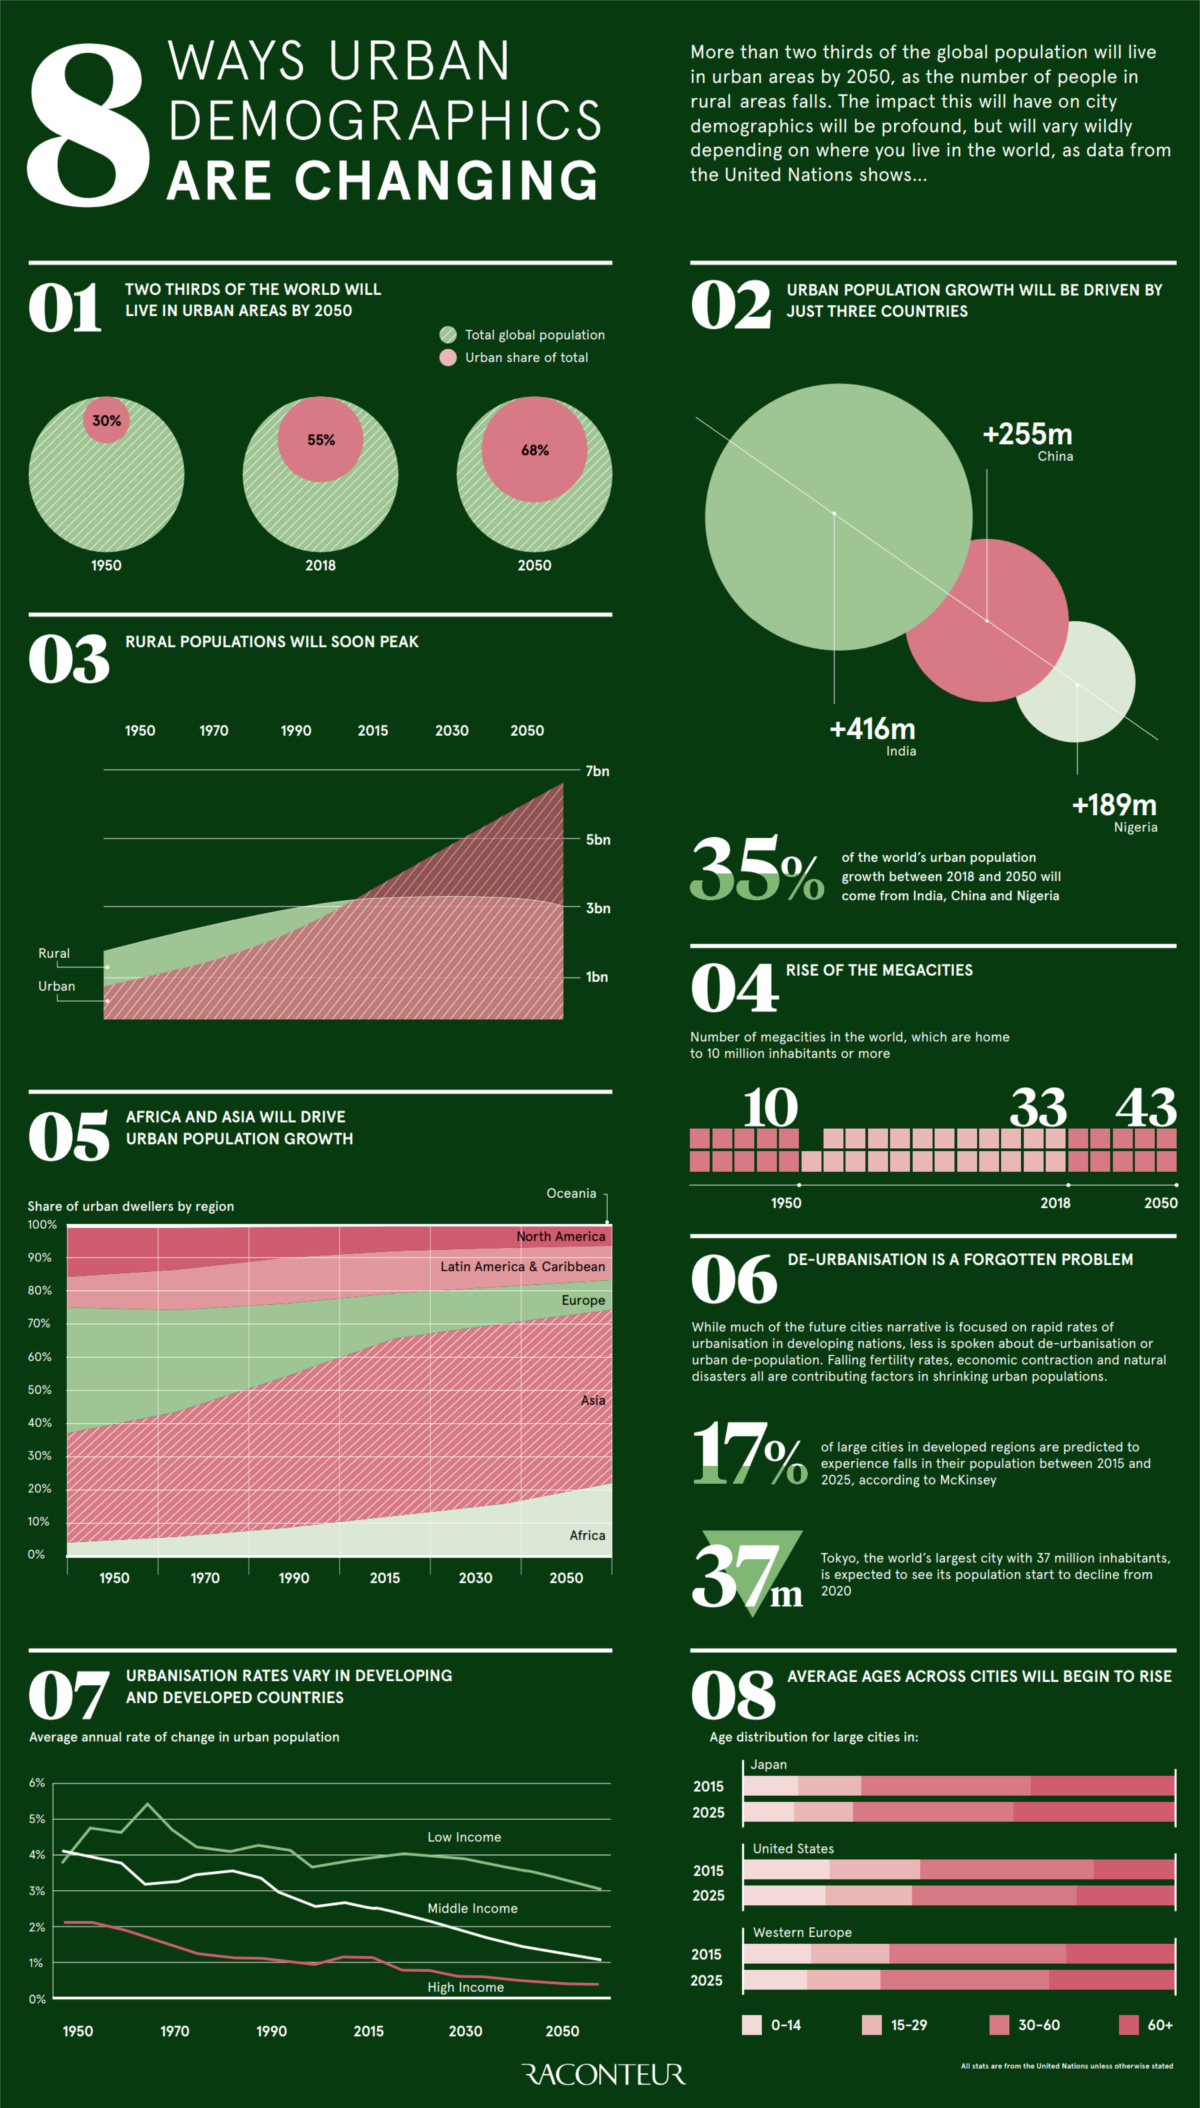
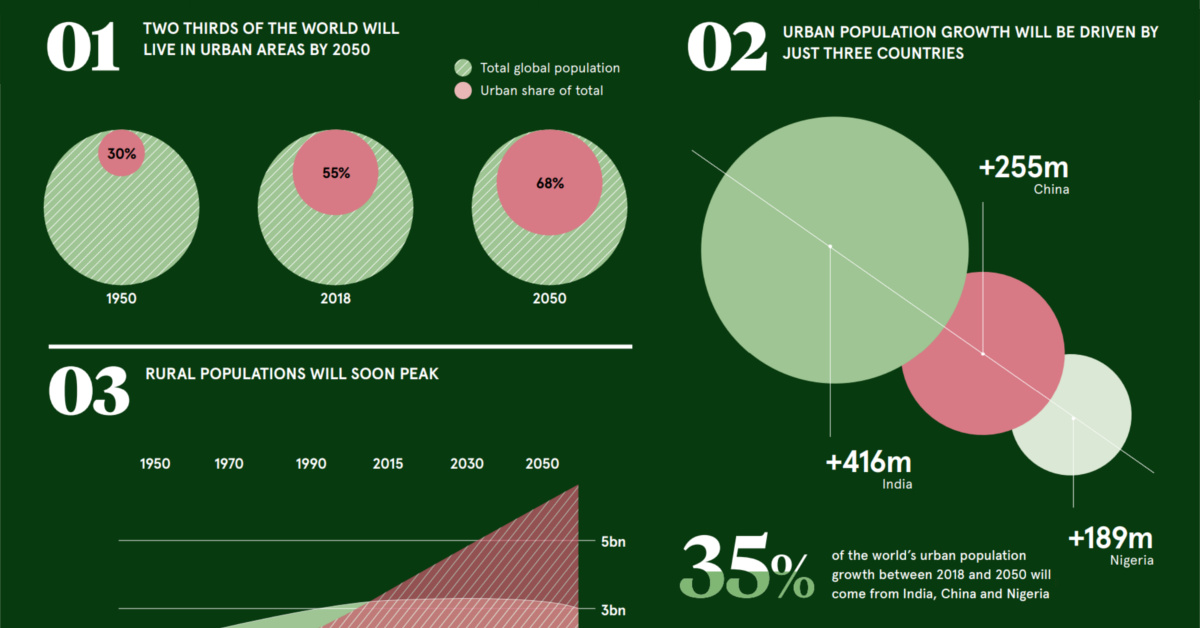
Between 1950 and 2018, we went from 30% to 55% of the world’s population living in cities. This has been driven largely by today’s middle and high income economies in places like North America, South America, Europe, and Japan.
The next stage of urbanization will see us move to 68% – more than two-thirds of the world’s population – living in these urban conglomerations. It will be driven by countries in developing markets, creating a potent investing megatrend along the way.
2. The Countries Driving Growth
It’s estimated that three countries will combine for 35% of all urban population growth.
| Rank | Country | Growth in Urban Population (2018-2050) | % of Global Urban Growth |
|---|---|---|---|
| #1 | India | 416 million people | 17% |
| #2 | China | 255 million people | 10% |
| #3 | Nigeria | 189 million people | 8% |
| World | 860 million people | 35% |
In total, there will be 2.5 billion more urban dwellers in 2050 than there are today. Many of these people will experience rising incomes in cities, increasing the global middle class to an unprecedented size.
3. Peaking Rural Populations
On the flipside, it appears the world’s rural population has nearly flatlined, with anticipation that it will peak in absolute terms in the next couple of years. Rural populations have been slowly growing since 1950 until this point.
4. The Rise of Megacities
There will be 43 megacities by the year 2050, which is more than quadruple the amount that existed back in 1950.
The changing geography of the world’s megacities will be one of the major forces that shapes the future of the global economy and accompanying investment trends.
5. New Population Centers
By 2050, more than 70% of the world’s urban population will live in Asia or Africa. Meanwhile, North America and Europe will combine for closer to 15% of that total.
6. De-Urbanization
The role of de-urbanization is often downplayed or forgot about when discussing urban demographics, but it is an interesting issue.
Factors such as falling fertility rates, economic contraction, and natural disasters are actually shrinking the size of some cities. In fact, McKinsey predicts that 17% of cities in developed regions will see a drop in population between 2015-2025.
7. Disparities in Urban Growth
The rate for urban population growth is actually trending down across all types of economies – however, these rates come from very different starting points.
High income countries are currently averaging growth of less than 1% per year, and this will continue to decline to below 0.5% per year by 2050. Over the same time period, low income nations will go from 4% to 3% per year.
8. Changes in Average Age
The age distributions in large cities within developed nations will begin to skew older, something we’ve shown previously when looking at the median age of every continent.
The biggest impact here may be felt on dependency ratios in the workforce. With a smaller pipeline of new workforce entrants and a burgeoning population of seniors, this changing ratio is one of the most significant stories impacting urban demographics.


Markets
The European Stock Market: Attractive Valuations Offer Opportunities
On average, the European stock market has valuations that are nearly 50% lower than U.S. valuations. But how can you access the market?


European Stock Market: Attractive Valuations Offer Opportunities
Europe is known for some established brands, from L’Oréal to Louis Vuitton. However, the European stock market offers additional opportunities that may be lesser known.
The above infographic, sponsored by STOXX, outlines why investors may want to consider European stocks.
Attractive Valuations
Compared to most North American and Asian markets, European stocks offer lower or comparable valuations.
| Index | Price-to-Earnings Ratio | Price-to-Book Ratio |
|---|---|---|
| EURO STOXX 50 | 14.9 | 2.2 |
| STOXX Europe 600 | 14.4 | 2 |
| U.S. | 25.9 | 4.7 |
| Canada | 16.1 | 1.8 |
| Japan | 15.4 | 1.6 |
| Asia Pacific ex. China | 17.1 | 1.8 |
Data as of February 29, 2024. See graphic for full index names. Ratios based on trailing 12 month financials. The price to earnings ratio excludes companies with negative earnings.
On average, European valuations are nearly 50% lower than U.S. valuations, potentially offering an affordable entry point for investors.
Research also shows that lower price ratios have historically led to higher long-term returns.
Market Movements Not Closely Connected
Over the last decade, the European stock market had low-to-moderate correlation with North American and Asian equities.
The below chart shows correlations from February 2014 to February 2024. A value closer to zero indicates low correlation, while a value of one would indicate that two regions are moving in perfect unison.
| EURO STOXX 50 | STOXX EUROPE 600 | U.S. | Canada | Japan | Asia Pacific ex. China |
|
|---|---|---|---|---|---|---|
| EURO STOXX 50 | 1.00 | 0.97 | 0.55 | 0.67 | 0.24 | 0.43 |
| STOXX EUROPE 600 | 1.00 | 0.56 | 0.71 | 0.28 | 0.48 | |
| U.S. | 1.00 | 0.73 | 0.12 | 0.25 | ||
| Canada | 1.00 | 0.22 | 0.40 | |||
| Japan | 1.00 | 0.88 | ||||
| Asia Pacific ex. China | 1.00 |
Data is based on daily USD returns.
European equities had relatively independent market movements from North American and Asian markets. One contributing factor could be the differing sector weights in each market. For instance, technology makes up a quarter of the U.S. market, but health care and industrials dominate the broader European market.
Ultimately, European equities can enhance portfolio diversification and have the potential to mitigate risk for investors.
Tracking the Market
For investors interested in European equities, STOXX offers a variety of flagship indices:
| Index | Description | Market Cap |
|---|---|---|
| STOXX Europe 600 | Pan-regional, broad market | €10.5T |
| STOXX Developed Europe | Pan-regional, broad-market | €9.9T |
| STOXX Europe 600 ESG-X | Pan-regional, broad market, sustainability focus | €9.7T |
| STOXX Europe 50 | Pan-regional, blue-chip | €5.1T |
| EURO STOXX 50 | Eurozone, blue-chip | €3.5T |
Data is as of February 29, 2024. Market cap is free float, which represents the shares that are readily available for public trading on stock exchanges.
The EURO STOXX 50 tracks the Eurozone’s biggest and most traded companies. It also underlies one of the world’s largest ranges of ETFs and mutual funds. As of November 2023, there were €27.3 billion in ETFs and €23.5B in mutual fund assets under management tracking the index.
“For the past 25 years, the EURO STOXX 50 has served as an accurate, reliable and tradable representation of the Eurozone equity market.”
— Axel Lomholt, General Manager at STOXX
Partnering with STOXX to Track the European Stock Market
Are you interested in European equities? STOXX can be a valuable partner:
- Comprehensive, liquid and investable ecosystem
- European heritage, global reach
- Highly sophisticated customization capabilities
- Open architecture approach to using data
- Close partnerships with clients
- Part of ISS STOXX and Deutsche Börse Group
With a full suite of indices, STOXX can help you benchmark against the European stock market.
Learn how STOXX’s European indices offer liquid and effective market access.

-

 Economy2 days ago
Economic Growth Forecasts for G7 and BRICS Countries in 2024
The IMF has released its economic growth forecasts for 2024. How do the G7 and BRICS countries compare?
-

 Markets1 week ago
U.S. Debt Interest Payments Reach $1 Trillion
U.S. debt interest payments have surged past the $1 trillion dollar mark, amid high interest rates and an ever-expanding debt burden.
-

 United States2 weeks ago
Ranked: The Largest U.S. Corporations by Number of Employees
We visualized the top U.S. companies by employees, revealing the massive scale of retailers like Walmart, Target, and Home Depot.
-

 Markets2 weeks ago
The Top 10 States by Real GDP Growth in 2023
This graphic shows the states with the highest real GDP growth rate in 2023, largely propelled by the oil and gas boom.
-

 Markets2 weeks ago
Ranked: The World’s Top Flight Routes, by Revenue
In this graphic, we show the highest earning flight routes globally as air travel continued to rebound in 2023.
-

 Markets2 weeks ago
Ranked: The Most Valuable Housing Markets in America
The U.S. residential real estate market is worth a staggering $47.5 trillion. Here are the most valuable housing markets in the country.

-

 Education1 week ago
How Hard Is It to Get Into an Ivy League School?
-

 Technology2 weeks ago
Ranked: Semiconductor Companies by Industry Revenue Share
-
Markets2 weeks ago
Ranked: The World’s Top Flight Routes, by Revenue
-

 Demographics2 weeks ago
Population Projections: The World’s 6 Largest Countries in 2075
-
Markets2 weeks ago
The Top 10 States by Real GDP Growth in 2023
-

 Demographics2 weeks ago
The Smallest Gender Wage Gaps in OECD Countries
-

 Economy2 weeks ago
Where U.S. Inflation Hit the Hardest in March 2024
-

 Green2 weeks ago
Top Countries By Forest Growth Since 2001