Environment
Mapped: Ocean Fishing and Aquaculture Around the World
Article/Editing:
Click to view this graphic in a higher-resolution.
Ocean Fishing and Aquaculture Around the World
Fish and seafood is the most popularly consumed meat in the world, the first choice in more than 56 countries.
But where do our fish come from? Are they caught by massive ocean fishing boats, or farmed in sprawling aquaculture installations?
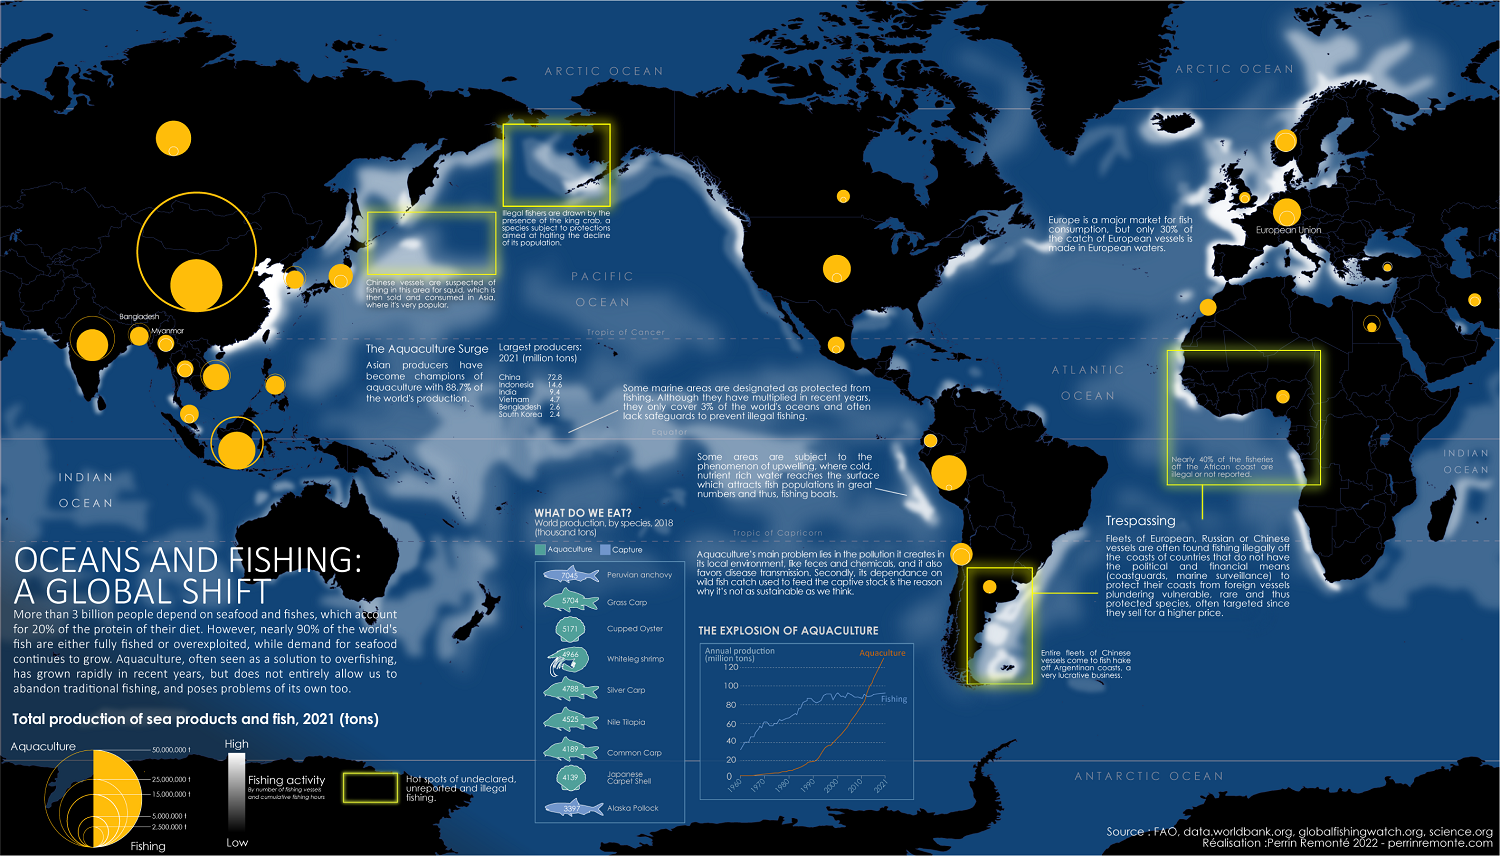
This map from creator Perrin Remonté points out where fishing activity (marked in white) occurs, using data from automatic identification system equipment aboard more than 70,000 industrial fishing vessels between 2012–2016.
The brightest white hotspots on the map—off the coast of China, western and nordic Europe, and the Pacific Northwest—give an indication of where most of the world’s fish supply is caught.
But who are the biggest producers?
Ranked: Which Country Produces the Most Fish?
By far the country with the biggest fish production is China, which supplied nearly 86 million metric tons of fish to the world in 2021, about 40% of global supply.
Chinese fishing vessels can be found fishing as far away from home as Argentina—sometimes illegally—to keep up with demand.
Here’s a list of the biggest fish producers, ranked by total output in 2021.
| Rank | Territory | Fish Production (2021, tonnes) |
|---|---|---|
| 1 | 🇨🇳 China | 85,948,134 |
| 2 | 🇮🇩 Indonesia | 21,813,413 |
| 3 | 🇮🇳 India | 14,433,205 |
| 4 | 🇻🇳 Vietnam | 8,289,524 |
| 5 | 🇵🇪 Peru | 6,726,989 |
| 6 | 🇷🇺 Russia | 5,487,045 |
| 7 | 🇺🇸 U.S. | 4,731,048 |
| 8 | 🇧🇩 Bangladesh | 4,621,228 |
| 9 | 🇳🇴 Norway | 4,220,624 |
| 10 | 🇵🇭 Philippines | 4,114,594 |
| 11 | 🇯🇵 Japan | 4,114,570 |
| 12 | 🇨🇱 Chile | 3,833,592 |
| 13 | 🇰🇷 South Korea | 3,742,566 |
| 14 | 🇲🇲 Myanmar | 2,594,957 |
| 15 | 🇹🇭 Thailand | 2,402,021 |
| 16 | 🇪🇬 Egypt | 2,001,959 |
| 17 | 🇲🇽 Mexico | 1,875,566 |
| 18 | 🇪🇨 Ecuador | 1,760,054 |
| 19 | 🇲🇾 Malaysia | 1,754,209 |
| 20 | 🇲🇦 Morocco | 1,434,205 |
| 21 | 🇧🇷 Brazil | 1,410,979 |
| 22 | 🇮🇷 Iran | 1,258,203 |
| 23 | 🇮🇸 Iceland | 1,109,563 |
| 24 | 🇪🇸 Spain | 1,088,454 |
| 25 | 🇳🇬 Nigeria | 1,080,855 |
| 26 | 🇨🇦 Canada | 945,954 |
| 27 | 🇴🇲 Oman | 923,786 |
| 28 | 🇰🇵 North Korea | 888,630 |
| 29 | 🇬🇧 UK | 864,698 |
| 30 | 🇲🇷 Mauritania | 860,217 |
| 31 | 🇰🇭 Cambodia | 856,400 |
| 32 | 🇦🇷 Argentina | 856,253 |
| 33 | 🇹🇷 Türkiye | 799,844 |
| 34 | 🇺🇬 Uganda | 760,545 |
| 35 | 🇫🇷 France | 708,995 |
| 36 | 🇵🇰 Pakistan | 660,586 |
| 37 | 🇫🇴 Faroe Islands | 656,364 |
| 38 | 🇹🇿 Tanzania | 621,058 |
| 39 | 🇦🇴 Angola | 531,772 |
| 40 | 🇸🇳 Senegal | 515,108 |
| 41 | 🇩🇰 Denmark | 507,097 |
| 42 | 🇿🇦 South Africa | 501,855 |
| 43 | 🇬🇭 Ghana | 482,142 |
| 44 | 🇳🇿 New Zealand | 459,937 |
| 45 | 🇱🇰 Sri Lanka | 431,255 |
| 46 | 🇳🇦 Namibia | 411,170 |
| 47 | 🇲🇿 Mozambique | 376,763 |
| 48 | 🇳🇱 Netherlands | 340,131 |
| 49 | 🇬🇳 Guinea | 326,270 |
| 50 | 🇨🇴 Colombia | 321,390 |
| 51 | 🇨🇲 Cameroon | 300,130 |
| 52 | 🇦🇺 Australia | 297,233 |
| 53 | 🇮🇹 Italy | 296,358 |
| 54 | 🇻🇪 Venezuela | 276,701 |
| 55 | 🇮🇪 Ireland | 276,258 |
| 56 | 🇬🇱 Greenland | 271,027 |
| 57 | 🇵🇱 Poland | 246,172 |
| 58 | 🇨🇩 DRC | 233,860 |
| 59 | 🇬🇪 Georgia | 220,365 |
| 60 | 🇩🇪 Germany | 220,312 |
| 61 | 🇱🇦 Laos | 206,008 |
| 62 | 🇸🇱 Sierra Leone | 205,015 |
| 63 | 🇬🇷 Greece | 203,558 |
| 64 | 🇵🇹 Portugal | 199,046 |
| 65 | 🇵🇬 Papua New Guinea | 194,786 |
| 66 | 🇧🇿 Belize | 192,226 |
| 67 | 🇰🇮 Kiribati | 191,168 |
| 68 | 🇵🇦 Panama | 183,774 |
| 69 | 🇸🇦 Saudi Arabia | 181,949 |
| 70 | 🇲🇼 Malawi | 180,508 |
| 71 | 🇸🇪 Sweden | 175,222 |
| 72 | 🇺🇿 Uzbekistan | 171,933 |
| 73 | 🇿🇲 Zambia | 168,480 |
| 74 | 🇫🇲 Micronesia | 166,334 |
| 75 | 🇰🇪 Kenya | 152,728 |
| 76 | 🇹🇳 Tunisia | 150,321 |
| 77 | 🇲🇻 Maldives | 144,993 |
| 78 | 🇫🇮 Finland | 139,370 |
| 79 | 🇸🇨 Seychelles | 139,174 |
| 80 | 🇾🇪 Yemen | 131,317 |
| 81 | 🇲🇬 Madagascar | 130,333 |
| 82 | 🇳🇵 Nepal | 121,854 |
| 83 | 🇳🇷 Nauru | 120,410 |
| 84 | 🇭🇰 Hong Kong | 119,088 |
| 85 | 🇲🇱 Mali | 115,584 |
| 86 | 🇨🇮 Cote d'Ivoire | 111,015 |
| 87 | 🇹🇩 Chad | 103,110 |
| 88 | 🇱🇹 Lithuania | 101,290 |
| 89 | 🇲🇭 Marshall Islands | 95,933 |
| 90 | 🇭🇷 Croatia | 89,253 |
| 91 | 🇳🇮 Nicaragua | 86,280 |
| 92 | 🇩🇿 Algeria | 83,979 |
| 93 | 🇭🇳 Honduras | 79,518 |
| 94 | 🇺🇦 Ukraine | 79,388 |
| 95 | 🇧🇯 Benin | 78,765 |
| 96 | 🇪🇪 Estonia | 73,085 |
| 97 | 🇸🇻 El Salvador | 71,754 |
| 98 | 🇨🇬 Congo | 70,330 |
| 99 | 🇺🇾 Uruguay | 66,403 |
| 100 | 🇮🇶 Iraq | 66,374 |
| 101 | 🇦🇪 UAE | 63,852 |
| 102 | 🇬🇼 Guinea-Bissau | 63,231 |
| 103 | 🇱🇻 Latvia | 62,560 |
| 104 | 🇸🇧 Solomon Islands | 62,314 |
| 105 | 🇪🇹 Ethiopia | 61,390 |
| 106 | 🇻🇺 Vanuatu | 55,935 |
| 107 | 🇬🇲 Gambia | 52,687 |
| 108 | 🇳🇪 Niger | 47,672 |
| 109 | 🇰🇿 Kazakhstan | 46,896 |
| 110 | 🇨🇷 Costa Rica | 46,432 |
| 111 | 🇸🇩 Sudan | 44,450 |
| 112 | 🇬🇹 Guatemala | 43,666 |
| 113 | 🇷🇼 Rwanda | 42,407 |
| 114 | 🇨🇺 Cuba | 40,718 |
| 115 | 🇬🇾 Guyana | 34,358 |
| 116 | 🇫🇯 Fiji | 33,081 |
| 117 | 🇲🇺 Mauritius | 32,955 |
| 118 | 🇸🇸 South Sudan | 32,545 |
| 119 | 🇸🇷 Suriname | 32,170 |
| 120 | 🇱🇾 Libya | 31,961 |
| 121 | 🇵🇾 Paraguay | 31,710 |
| 122 | 🇹🇻 Tuvalu | 31,097 |
| 123 | 🇧🇫 Burkina Faso | 30,609 |
| 124 | 🇸🇴 Somalia | 30,000 |
| 125 | 🇬🇦 Gabon | 29,925 |
| 126 | 🇨🇫 Central African Republic | 28,215 |
| 127 | 🇿🇼 Zimbabwe | 27,792 |
| 128 | 🇱🇷 Liberia | 25,444 |
| 129 | 🇨🇼 Curacao | 25,027 |
| 130 | 🇨🇿 Czechia | 24,305 |
| 131 | 🇧🇬 Bulgaria | 24,183 |
| 132 | 🇭🇺 Hungary | 22,447 |
| 133 | 🇧🇮 Burundi | 21,040 |
| 134 | 🇩🇴 Dominican Republic | 20,397 |
| 135 | 🇧🇳 Brunei Darussalam | 20,063 |
| 136 | 🇦🇲 Armenia | 19,700 |
| 137 | 🇰🇲 Comoros | 19,356 |
| 138 | 🇲🇹 Malta | 18,936 |
| 139 | 🇹🇬 Togo | 18,866 |
| 140 | 🇦🇱 Albania | 18,283 |
| 141 | 🇧🇪 Belgium | 18,160 |
| 142 | 🇷🇴 Romania | 18,065 |
| 143 | 🇭🇹 Haiti | 17,830 |
| 144 | 🇮🇱 Israel | 16,910 |
| 145 | 🇶🇦 Qatar | 16,668 |
| 146 | 🇧🇭 Bahrain | 15,736 |
| 147 | 🇹🇲 Turkmenistan | 15,202 |
| 148 | 🇵🇫 French Polynesia | 14,802 |
| 149 | 🇹🇹 Trinidad & Tobago | 13,102 |
| 150 | 🇲🇩 Moldova | 12,905 |
| 151 | 🇦🇫 Afghanistan | 12,607 |
| 152 | 🇯🇲 Jamaica | 11,840 |
| 153 | 🇨🇻 Cabo Verde | 11,652 |
| 154 | 🇧🇴 Bolivia | 11,453 |
| 155 | 🇰🇬 Kyrgyz Republic | 10,320 |
| 156 | 🇷🇸 Serbia | 9,662 |
| 157 | 🇨🇾 Cyprus | 9,264 |
| 158 | 🇼🇸 Samoa | 9,186 |
| 159 | 🇧🇾 Belarus | 9,115 |
| 160 | 🇧🇸 Bahamas | 8,705 |
| 161 | 🇸🇾 Syria | 6,660 |
| 162 | 🇬🇶 Equatorial Guinea | 6,322 |
| 163 | 🇹🇱 Timor-Leste | 6,024 |
| 164 | 🇸🇹 Sao Tome & Principe | 6,020 |
| 165 | 🇸🇬 Singapore | 5,550 |
| 166 | 🇵🇸 West Bank & Gaza | 5,348 |
| 167 | 🇦🇹 Austria | 5,270 |
| 168 | 🇳🇨 New Caledonia | 4,715 |
| 169 | 🇪🇷 Eritrea | 4,578 |
| 170 | 🇹🇯 Tajikistan | 4,389 |
| 171 | 🇧🇦 Bosnia & Herzegovina | 4,124 |
| 172 | 🇸🇰 Slovak Republic | 4,119 |
| 173 | 🇰🇼 Kuwait | 3,975 |
| 174 | 🇨🇭 Switzerland | 3,850 |
| 175 | 🇲🇰 North Macedonia | 3,683 |
| 176 | 🇱🇧 Lebanon | 3,358 |
| 177 | 🇯🇪 Channel Islands | 3,333 |
| 178 | 🇦🇬 Antigua & Barbuda | 3,225 |
| 179 | 🇩🇯 Djibouti | 3,089 |
| 180 | 🇮🇲 Isle of Man | 3,041 |
| 181 | 🇯🇴 Jordan | 2,810 |
| 182 | 🇹🇨 Turks & Caicos Islands | 2,277 |
| 183 | 🇦🇿 Azerbaijan | 1,971 |
| 184 | 🇸🇮 Slovenia | 1,955 |
| 185 | 🇲🇪 Montenegro | 1,666 |
| 186 | 🇱🇨 St. Lucia | 1,625 |
| 187 | 🇻🇨 St. Vincent & the Grenadines | 1,599 |
| 188 | 🇵🇷 Puerto Rico | 1,598 |
| 189 | 🇱🇸 Lesotho | 1,556 |
| 190 | 🇲🇴 Macao | 1,500 |
| 191 | 🇹🇴 Tonga | 1,265 |
| 192 | 🇻🇬 British Virgin Islands | 1,134 |
| 193 | 🇦🇸 American Samoa | 1,079 |
| 194 | 🇬🇩 Grenada | 1,046 |
| 195 | 🇧🇧 Barbados | 872 |
| 196 | 🇵🇼 Palau | 804 |
| 197 | 🇻🇮 Virgin Islands | 428 |
| 198 | 🇧🇲 Bermuda | 419 |
| 199 | 🇰🇳 St. Kitts & Nevis | 371 |
| 200 | 🇩🇲 Dominica | 289 |
| 201 | 🇸🇽 Sint Maarten | 253 |
| 202 | 🇲🇵 Northern Mariana Islands | 230 |
| 203 | 🇧🇹 Bhutan | 208 |
| 204 | 🇧🇼 Botswana | 201 |
| 205 | 🇦🇼 Aruba | 167 |
| 206 | 🇸🇿 Eswatini | 165 |
| 207 | 🇬🇺 Guam | 141 |
| 208 | 🇰🇾 Cayman Islands | 135 |
| 209 | 🇫🇷 St. Martin | 90 |
| 210 | 🇬🇮 Gibraltar | 1 |
| 211 | 🇲🇨 Monaco | 1 |
| N/A | 🌐 World | 216,872,258 |
Source: World Bank.
Other Asian countries—Indonesia (21.8 million tonnes), India (14.4 million tonnes), and Vietnam (8.2 million tonnes)—fill out the next few spots. Peru, with an annual production of 6.7 million tonnes rounds out the top five fish suppliers, which together account for nearly 60% of world fish supply.
The second half of the top 10 also has representatives from North America (the U.S.) and Europe (Russia), the latter whose fleets have also been caught fishing illegally off the coast of Africa.
Captured Ocean Fish vs Farmed Aquaculture Fish
A big footnote on total fish production is that it also includes aquaculture and farmed fish. Breaking down total fish supply between farmed and captured fish reveals some interesting trends. Here we rank the biggest fish suppliers by their farmed fish output.
| Rank | Territory | Aquaculture Supply (2021, tonnes) | Captured Supply (2021, tonnes) |
|---|---|---|---|
| 1 | 🇨🇳 China | 72,805,297 | 13,142,837 |
| 2 | 🇮🇩 Indonesia | 14,606,534 | 7,206,879 |
| 3 | 🇮🇳 India | 9,408,300 | 5,024,905 |
| 4 | 🇻🇳 Vietnam | 4,749,274 | 3,540,250 |
| 5 | 🇧🇩 Bangladesh | 2,638,745 | 1,982,483 |
| 6 | 🇰🇷 South Korea | 2,427,677 | 1,314,889 |
| 7 | 🇵🇭 Philippines | 2,272,528 | 1,842,067 |
| 8 | 🇳🇴 Norway | 1,665,112 | 2,555,512 |
| 9 | 🇪🇬 Egypt | 1,576,189 | 425,770 |
| 10 | 🇨🇱 Chile | 1,443,520 | 2,390,072 |
| 11 | 🇹🇭 Thailand | 989,898 | 1,412,123 |
| 12 | 🇯🇵 Japan | 963,680 | 3,150,890 |
| 13 | 🇲🇲 Myanmar | 929,217 | 1,665,740 |
| 14 | 🇪🇨 Ecuador | 896,435 | 863,619 |
| 15 | 🇰🇵 North Korea | 680,560 | 208,070 |
| 16 | 🇧🇷 Brazil | 650,356 | 760,623 |
| 17 | 🇮🇷 Iran | 478,737 | 779,466 |
| 18 | 🇹🇷 Türkiye | 471,686 | 328,158 |
| 19 | 🇺🇸 U.S. | 448,615 | 4,282,433 |
| 20 | 🇲🇾 Malaysia | 416,978 | 1,337,231 |
| 21 | 🇰🇭 Cambodia | 348,350 | 508,050 |
| 22 | 🇷🇺 Russia | 319,342 | 5,167,703 |
| 23 | 🇪🇸 Spain | 279,910 | 808,544 |
| 24 | 🇳🇬 Nigeria | 275,645 | 805,210 |
| 25 | 🇲🇽 Mexico | 246,914 | 1,628,652 |
| 26 | 🇬🇧 UK | 230,280 | 634,419 |
| 27 | 🇫🇷 France | 198,886 | 510,110 |
| 28 | 🇨🇴 Colombia | 192,521 | 128,869 |
| 29 | 🇨🇦 Canada | 191,449 | 754,505 |
| 30 | 🇵🇰 Pakistan | 164,527 | 496,059 |
| 31 | 🇵🇪 Peru | 150,818 | 6,576,171 |
| 32 | 🇮🇹 Italy | 145,862 | 150,496 |
| 33 | 🇬🇷 Greece | 143,926 | 59,632 |
| 34 | 🇺🇬 Uganda | 138,558 | 621,987 |
| 35 | 🇱🇦 Laos | 135,008 | 71,000 |
| 36 | 🇦🇺 Australia | 126,206 | 171,026 |
| 37 | 🇺🇿 Uzbekistan | 118,933 | 53,000 |
| 38 | 🇳🇿 New Zealand | 116,839 | 343,098 |
| 39 | 🇫🇴 Faroe Islands | 115,760 | 540,604 |
| 40 | 🇸🇦 Saudi Arabia | 114,490 | 67,459 |
| 41 | 🇹🇿 Tanzania | 106,482 | 514,575 |
| 42 | 🇳🇵 Nepal | 100,854 | 21,000 |
| 43 | 🇬🇭 Ghana | 89,380 | 392,762 |
| 44 | 🇿🇲 Zambia | 63,355 | 105,125 |
| 45 | 🇭🇳 Honduras | 63,268 | 16,250 |
| 46 | 🇻🇪 Venezuela | 53,601 | 223,100 |
| 47 | 🇮🇸 Iceland | 53,136 | 1,056,427 |
| 48 | 🇱🇰 Sri Lanka | 50,977 | 380,278 |
| 49 | 🇵🇱 Poland | 44,787 | 201,385 |
| 50 | 🇮🇪 Ireland | 42,099 | 234,159 |
| 51 | 🇩🇰 Denmark | 40,594 | 466,503 |
| 52 | 🇳🇱 Netherlands | 40,590 | 299,541 |
| 53 | 🇩🇪 Germany | 32,649 | 187,663 |
| 54 | 🇬🇹 Guatemala | 32,583 | 11,082 |
| 55 | 🇳🇮 Nicaragua | 31,006 | 55,275 |
| 56 | 🇭🇷 Croatia | 26,831 | 62,422 |
| 57 | 🇹🇳 Tunisia | 26,077 | 124,243 |
| 58 | 🇮🇶 Iraq | 22,694 | 43,680 |
| 59 | 🇨🇺 Cuba | 22,665 | 18,053 |
| 60 | 🇰🇪 Kenya | 21,825 | 130,903 |
| 61 | 🇨🇿 Czechia | 20,991 | 3,314 |
| 62 | 🇵🇹 Portugal | 19,516 | 179,530 |
| 63 | 🇦🇲 Armenia | 18,930 | 770 |
| 64 | 🇭🇺 Hungary | 17,847 | 4,601 |
| 65 | 🇨🇷 Costa Rica | 17,309 | 29,123 |
| 66 | 🇺🇦 Ukraine | 16,882 | 62,506 |
| 67 | 🇲🇹 Malta | 16,433 | 2,503 |
| 68 | 🇲🇬 Madagascar | 16,396 | 113,937 |
| 69 | 🇸🇪 Sweden | 15,253 | 159,969 |
| 70 | 🇧🇬 Bulgaria | 15,174 | 9,009 |
| 71 | 🇮🇱 Israel | 14,875 | 2,035 |
| 72 | 🇫🇮 Finland | 14,399 | 124,971 |
| 73 | 🇵🇾 Paraguay | 14,150 | 17,560 |
| 74 | 🇲🇩 Moldova | 12,905 | 0 |
| 75 | 🇸🇻 El Salvador | 12,749 | 59,005 |
| 76 | 🇸🇧 Solomon Islands | 12,461 | 49,854 |
| 77 | 🇷🇴 Romania | 11,714 | 6,351 |
| 78 | 🇦🇫 Afghanistan | 11,107 | 1,500 |
| 79 | 🇿🇦 South Africa | 10,525 | 491,330 |
| 80 | 🇷🇼 Rwanda | 10,313 | 32,094 |
| 81 | 🇰🇬 Kyrgyz Republic | 10,300 | 20 |
| 82 | 🇲🇼 Malawi | 9,948 | 170,560 |
| 83 | 🇸🇩 Sudan | 9,900 | 34,550 |
| 84 | 🇨🇲 Cameroon | 9,800 | 290,330 |
| 85 | 🇦🇱 Albania | 8,641 | 9,642 |
| 86 | 🇧🇾 Belarus | 8,504 | 611 |
| 87 | 🇲🇱 Mali | 8,484 | 107,100 |
| 88 | 🇨🇾 Cyprus | 7,862 | 1,401 |
| 89 | 🇷🇸 Serbia | 7,308 | 2,354 |
| 90 | 🇵🇦 Panama | 6,704 | 177,069 |
| 91 | 🇵🇬 Papua New Guinea | 6,122 | 188,664 |
| 92 | 🇨🇮 Cote d'Ivoire | 5,720 | 105,295 |
| 93 | 🇰🇿 Kazakhstan | 5,438 | 41,457 |
| 94 | 🇸🇬 Singapore | 5,244 | 306 |
| 95 | 🇨🇩 DRC | 5,195 | 228,665 |
| 96 | 🇱🇹 Lithuania | 5,138 | 96,152 |
| 97 | 🇿🇼 Zimbabwe | 5,058 | 22,734 |
| 98 | 🇦🇹 Austria | 4,920 | 350 |
| 99 | 🇩🇿 Algeria | 4,779 | 79,200 |
| 100 | 🇧🇳 Brunei Darussalam | 4,768 | 15,295 |
| 101 | 🇧🇯 Benin | 4,150 | 74,615 |
| 102 | 🇭🇰 Hong Kong | 3,909 | 115,179 |
| 103 | 🇧🇴 Bolivia | 3,853 | 7,600 |
| 104 | 🇧🇦 Bosnia & Herzegovina | 3,819 | 305 |
| 105 | 🇦🇷 Argentina | 3,687 | 852,566 |
| 106 | 🇲🇿 Mozambique | 3,200 | 373,563 |
| 107 | 🇲🇰 North Macedonia | 3,169 | 514 |
| 108 | 🇦🇴 Angola | 2,808 | 528,964 |
| 109 | 🇬🇪 Georgia | 2,790 | 217,575 |
| 110 | 🇩🇴 Dominican Republic | 2,730 | 17,667 |
| 111 | 🇦🇪 UAE | 2,663 | 61,189 |
| 112 | 🇨🇭 Switzerland | 2,364 | 1,486 |
| 113 | 🇸🇾 Syria | 2,350 | 4,310 |
| 114 | 🇲🇺 Mauritius | 2,316 | 30,640 |
| 115 | 🇸🇰 Slovak Republic | 2,304 | 1,815 |
| 116 | 🇯🇴 Jordan | 2,145 | 665 |
| 117 | 🇹🇯 Tajikistan | 2,039 | 2,350 |
| 118 | 🇲🇦 Morocco | 2,006 | 1,432,199 |
| 119 | 🇴🇲 Oman | 1,703 | 922,083 |
| 120 | 🇸🇮 Slovenia | 1,686 | 269 |
| 121 | 🇭🇹 Haiti | 1,610 | 16,220 |
| 122 | 🇵🇫 French Polynesia | 1,559 | 13,243 |
| 123 | 🇱🇸 Lesotho | 1,501 | 55 |
| 124 | 🇧🇮 Burundi | 1,490 | 19,550 |
| 125 | 🇳🇨 New Caledonia | 1,411 | 3,305 |
| 126 | 🇸🇳 Senegal | 1,151 | 513,957 |
| 127 | 🇬🇳 Guinea | 1,150 | 325,120 |
| 128 | 🇯🇪 Channel Islands | 1,145 | 2,188 |
| 129 | 🇹🇱 Timor-Leste | 1,091 | 4,933 |
| 130 | 🇨🇬 Congo | 911 | 69,419 |
| 131 | 🇱🇻 Latvia | 901 | 61,658 |
| 132 | 🇯🇲 Jamaica | 884 | 10,956 |
| 133 | 🇹🇬 Togo | 882 | 17,984 |
| 134 | 🇧🇫 Burkina Faso | 878 | 29,731 |
| 135 | 🇲🇪 Montenegro | 858 | 808 |
| 136 | 🇪🇪 Estonia | 849 | 72,236 |
| 137 | 🇱🇧 Lebanon | 778 | 2,580 |
| 138 | 🇪🇹 Ethiopia | 740 | 60,650 |
| 139 | 🇵🇸 West Bank & Gaza | 687 | 4,661 |
| 140 | 🇧🇿 Belize | 605 | 191,621 |
| 141 | 🇦🇿 Azerbaijan | 507 | 1,464 |
| 142 | 🇳🇪 Niger | 472 | 47,200 |
| 143 | 🇰🇼 Kuwait | 450 | 3,525 |
| 144 | 🇳🇦 Namibia | 321 | 410,849 |
| 145 | 🇱🇷 Liberia | 275 | 25,169 |
| 146 | 🇧🇪 Belgium | 223 | 17,937 |
| 147 | 🇨🇫 Central African Republic | 215 | 28,000 |
| 148 | 🇱🇨 St. Lucia | 211 | 1,414 |
| 149 | 🇫🇯 Fiji | 206 | 32,874 |
| 150 | 🇧🇹 Bhutan | 193 | 15 |
| 151 | 🇧🇼 Botswana | 163 | 38 |
| 152 | 🇹🇲 Turkmenistan | 160 | 15,042 |
| 153 | 🇬🇾 Guyana | 142 | 34,216 |
| 154 | 🇸🇱 Sierra Leone | 115 | 204,900 |
| 155 | 🇬🇺 Guam | 115 | 26 |
| 156 | 🇶🇦 Qatar | 114 | 16,555 |
| 157 | 🇹🇩 Chad | 110 | 103,000 |
| 158 | 🇺🇾 Uruguay | 103 | 66,300 |
| 159 | 🇹🇴 Tonga | 100 | 1,165 |
| 160 | 🇸🇿 Eswatini | 100 | 65 |
| 161 | 🇬🇦 Gabon | 65 | 29,860 |
| 162 | 🇸🇸 South Sudan | 45 | 32,500 |
| 163 | 🇲🇵 Northern Mariana Islands | 41 | 189 |
| 164 | 🇸🇷 Suriname | 40 | 32,130 |
| 165 | 🇬🇲 Gambia | 35 | 52,652 |
| 166 | 🇨🇻 Cabo Verde | 28 | 11,624 |
| 167 | 🇧🇧 Barbados | 26 | 847 |
| 168 | 🇬🇩 Grenada | 23 | 1,024 |
| 169 | 🇦🇬 Antigua & Barbuda | 20 | 3,205 |
| 170 | 🇦🇸 American Samoa | 20 | 1,059 |
| 171 | 🇹🇹 Trinidad & Tobago | 18 | 13,084 |
| 172 | 🇵🇼 Palau | 18 | 786 |
| 173 | 🇵🇷 Puerto Rico | 18 | 1,580 |
| 174 | 🇧🇭 Bahrain | 16 | 15,720 |
| 175 | 🇬🇶 Equatorial Guinea | 15 | 6,307 |
| 176 | 🇻🇨 St. Vincent & the Grenadines | 13 | 1,586 |
| 177 | 🇾🇪 Yemen | 10 | 131,307 |
| 178 | 🇬🇼 Guinea-Bissau | 10 | 63,221 |
| 179 | 🇱🇾 Libya | 10 | 31,951 |
| 180 | 🇼🇸 Samoa | 10 | 9,176 |
| 181 | 🇰🇾 Cayman Islands | 10 | 125 |
| 182 | 🇻🇮 Virgin Islands | 8 | 420 |
| 183 | 🇪🇷 Eritrea | 4 | 4,574 |
| 184 | 🇻🇺 Vanuatu | 3 | 55,932 |
| 185 | 🇰🇮 Kiribati | 2 | 191,166 |
| 186 | 🇰🇳 St. Kitts & Nevis | 2 | 369 |
| 187 | 🇦🇼 Aruba | 2 | 165 |
| 188 | 🇹🇻 Tuvalu | 1 | 31,096 |
| 189 | 🇻🇬 British Virgin Islands | 1 | 1,133 |
| 190 | 🇩🇲 Dominica | 1 | 288 |
| 191 | 🇳🇷 Nauru | 1 | 120,409 |
| 192 | 🇲🇭 Marshall Islands | 0 | 95,933 |
| 193 | 🇫🇲 Micronesia | 0 | 166,334 |
| 194 | 🇸🇨 Seychelles | 0 | 139,174 |
| 195 | 🇨🇼 Curacao | 0 | 25,027 |
| 196 | 🇧🇸 Bahamas | 0 | 8,705 |
| 197 | 🇹🇨 Turks & Caicos Islands | 0 | 2,277 |
| 198 | 🇲🇷 Mauritania | 0 | 860,217 |
| 199 | 🇬🇱 Greenland | 0 | 271,027 |
| 200 | 🇲🇻 Maldives | 0 | 144,993 |
| 201 | 🇸🇴 Somalia | 0 | 30,000 |
| 202 | 🇰🇲 Comoros | 0 | 19,356 |
| 203 | 🇸🇹 Sao Tome & Principe | 0 | 6,020 |
| 204 | 🇩🇯 Djibouti | 0 | 3,089 |
| 205 | 🇮🇲 Isle of Man | 0 | 3,041 |
| 206 | 🇲🇴 Macao | 0 | 1,500 |
| 207 | 🇧🇲 Bermuda | 0 | 419 |
| 208 | 🇸🇽 Sint Maarten | 0 | 253 |
| 209 | 🇫🇷 St. Martin | 0 | 90 |
| 210 | 🇬🇮 Gibraltar | 0 | 1 |
| 211 | 🇲🇨 Monaco | 0 | 1 |
| N/A | 🌐 World | 126,035,146 | 92,177,119 |
Source: World Bank.
Aquaculture makes up the majority of fish production for all the big Asian producers in the top 10. However the inverse is true for European, North American, and South American countries.
While the history of aquaculture goes back thousands of years, its use began to rise steeply in the 2000s, with production overtaking captured fish in 2014. First seen as a solution to overfishing and to make the industry more sustainable, aquaculture’s problems are now beginning to weigh on the industry.
From the pollution it causes—in the form of feces—to its dependence on wild catch for feeding the stock, makes it far less sustainable than what is assumed. In fact, about 25% of wild catch is turned into fish meal—a mixture of less appetizing fish like anchovies, menhaden and herring—used to feed farmed fish.
How Secure is the Ocean Fishing Industry?
Fish and seafood is one of the most accessible sources of meat in the world, accounting for 17% of animal protein consumed. However, almost 90% of the world’s fish stocks are fully depleted while demand only continues to grow.
Unregulated and illegal fishing not only adds a sustainability burden to the planet, but the industry is also rife with human rights abuses, including human trafficking and modern slavery.
Meanwhile, only 3% of the world’s oceans are designated as protected marine reserves and even they lack the safeguards to fully stop exploitative fishing.

This article was published as a part of Visual Capitalist's Creator Program, which features data-driven visuals from some of our favorite Creators around the world.


Green
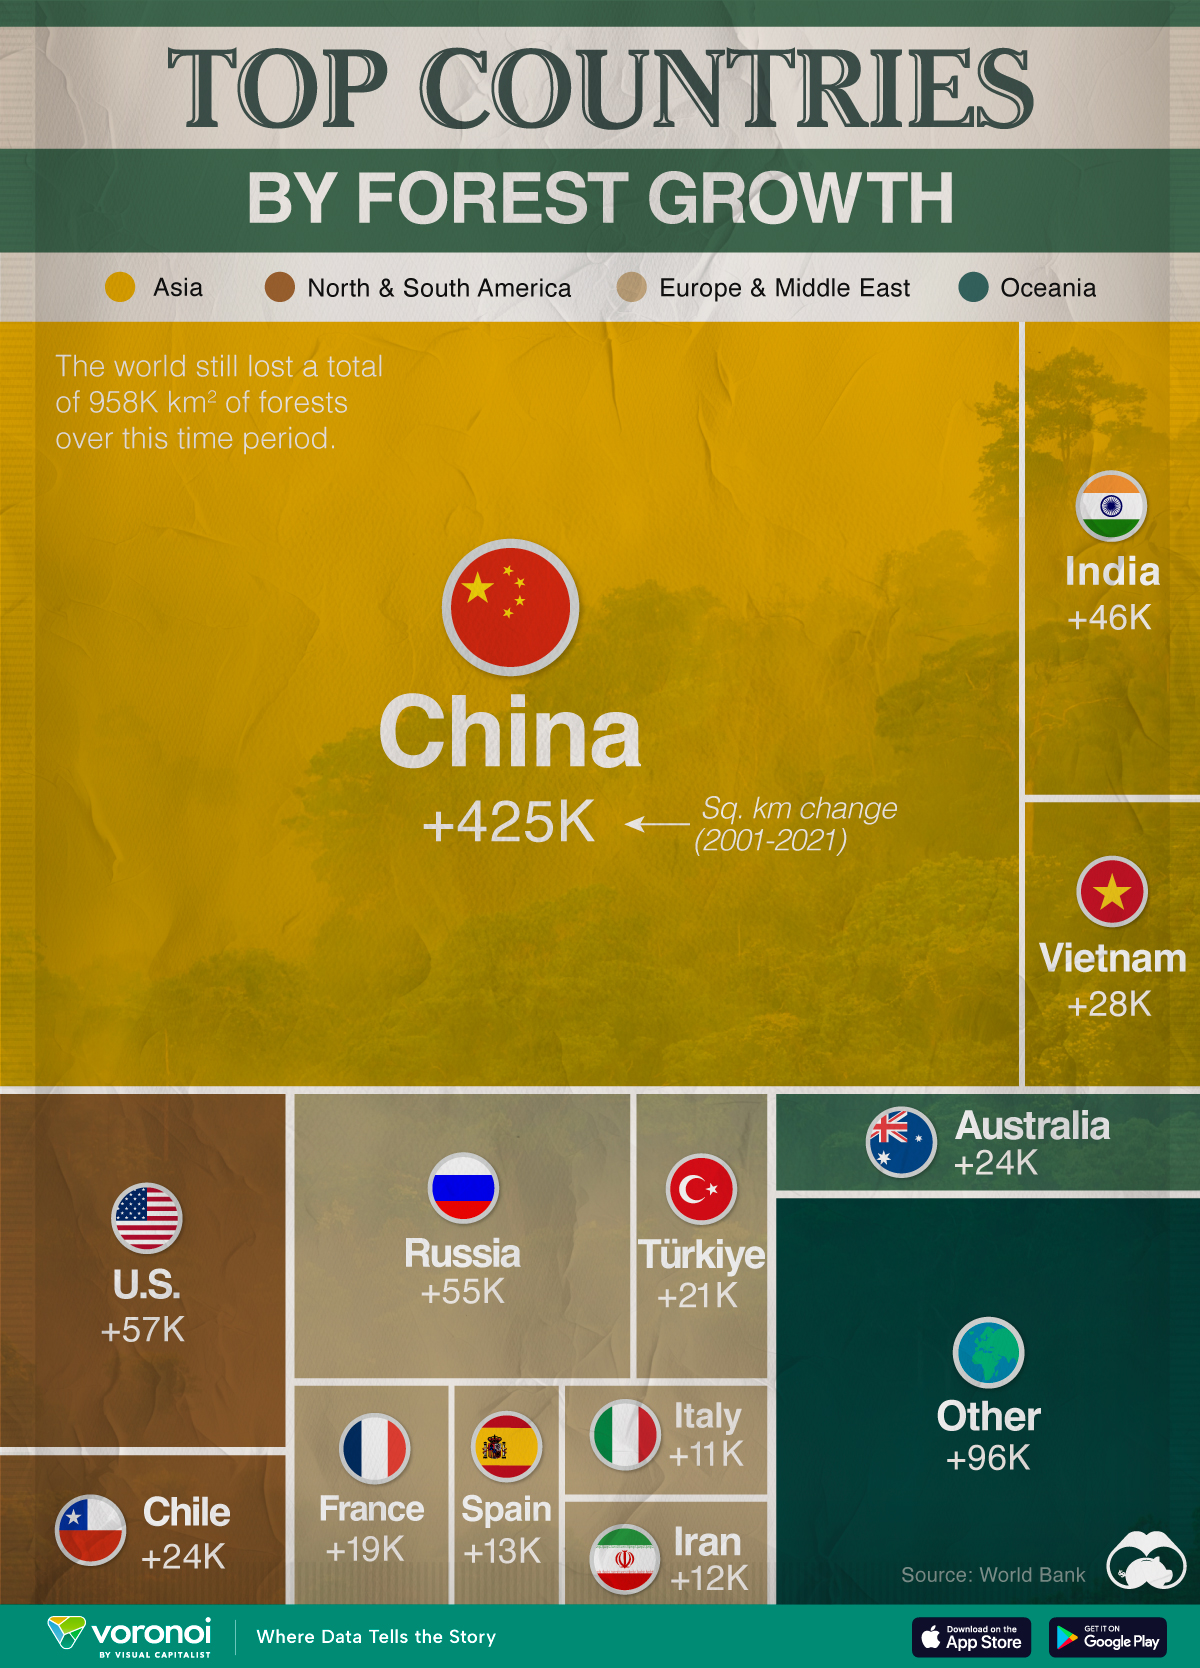
Top Countries By Forest Growth Since 2001
One country is taking reforestation very seriously, registering more than 400,000 square km of forest growth in two decades.
Ranked: Top Countries By Forest Growth Since 2001
This was originally posted on our Voronoi app. Download the app for free on Apple or Android and discover incredible data-driven charts from a variety of trusted sources.
Reforestation is tricky business: it’s expensive, difficult to plan, and even harder to execute. And this is without all the associated environmental obstacles: weather, pests, and natural calamities.
However, some countries have prioritized replanting their lost forests, especially in the last two decades as the climate movement has gathered steam.
We visualized forest growth around the world, ranking countries by their forest area increases between 2001–2021, measured in square kilometers (km²).
All of this data was sourced from the World Bank. Note that countries are ranked by forest growth in square kilometers, rather than percentage change.
Which Country Leads Forest Growth Since 2001?
China tops the list, expanding its forest area by nearly 425,000 km2 (roughly the size of Sweden) between 2001–21. This is more than the next 19 countries combined. Relatively speaking, China’s forests increased by almost one-fourth.
| Rank | Country | Region | 2001–21 Change (Km2) | % of Forest Growth |
|---|---|---|---|---|
| 1 | 🇨🇳 China | Asia | 424,962 | 24% |
| 2 | 🇺🇸 U.S. | North America | 57,406 | 2% |
| 3 | 🇷🇺 Russia | Europe | 54,564 | 1% |
| 4 | 🇮🇳 India | Asia | 46,449 | 7% |
| 5 | 🇻🇳 Vietnam | Asia | 27,745 | 23% |
| 6 | 🇨🇱 Chile | South America | 24,257 | 15% |
| 7 | 🇦🇺 Australia | Oceania | 24,178 | 2% |
| 8 | 🇹🇷 Turkiye | Middle East | 21,345 | 11% |
| 9 | 🇫🇷 France | Europe | 19,353 | 13% |
| 10 | 🇪🇸 Spain | Europe | 13,374 | 8% |
| 11 | 🇮🇷 Iran | Middle East | 13,033 | 14% |
| 12 | 🇮🇹 Italy | Europe | 11,848 | 14% |
| 13 | 🇨🇺 Cuba | Central America | 7,573 | 30% |
| 14 | 🇹🇭 Thailand | Asia | 7,315 | 4% |
| 15 | 🇺🇿 Uzbekistan | Asia | 7,152 | 24% |
| 16 | 🇺🇾 Uruguay | South America | 6,468 | 46% |
| 17 | 🇷🇴 Romania | Europe | 5,482 | 9% |
| 18 | 🇧🇬 Bulgaria | Europe | 4,948 | 15% |
| 19 | 🇧🇾 Belarus | Europe | 4,734 | 6% |
| 20 | 🇵🇱 Poland | Europe | 4,090 | 5% |
| N/A | 🌍 World | -957,658 | -2% |
There are some other countries who have achieved similar relative levels of reforestation. Within Asia, Vietnam’s forests as a percentage of total land area have doubled since 1990. Since 2001, its forests have grown nearly 28,000 km², a 23% increase.
Uzbekistan similarly expanded its forested area by 24%, which amounts to about 7,000 km².
Meanwhile, Chile and Uruguay, are the only two South American countries that have managed to expand their forest cover in the last two decades—the latter by a staggering 46%. In contrast, the rest of South America is instead seeing significant deforestation.
It’s interesting to note that reforestation also comes with its own risks. Introducing non-native or monoculture tree species can reduce biodiversity and lead to soil erosion.
And despite global reforestation efforts, the world still lost close to a million square kilometers of forests since 2001.

-

 Debt1 week ago
How Debt-to-GDP Ratios Have Changed Since 2000
-

 Markets2 weeks ago
Ranked: The World’s Top Flight Routes, by Revenue
-

 Countries2 weeks ago
Population Projections: The World’s 6 Largest Countries in 2075
-

 Markets2 weeks ago
The Top 10 States by Real GDP Growth in 2023
-

 Demographics2 weeks ago
The Smallest Gender Wage Gaps in OECD Countries
-

 United States2 weeks ago
Where U.S. Inflation Hit the Hardest in March 2024
-

 Green2 weeks ago
Top Countries By Forest Growth Since 2001
-

 United States2 weeks ago
Ranked: The Largest U.S. Corporations by Number of Employees