Maps
Mapped: What Did the World Look Like in the Last Ice Age?
Article/Editing:
Click to view this graphic in a higher-resolution.

What Did the World Look Like in the Last Ice Age?
What did the world look like during the last ice age? Was it all endless glaciers and frozen ice? The answer is a partial yes—with some interesting caveats.
The Last Glacial Maximum (LGM), colloquially called the last ice age, was a period in Earth’s history that occurred roughly 26,000 to 19,000 years ago.
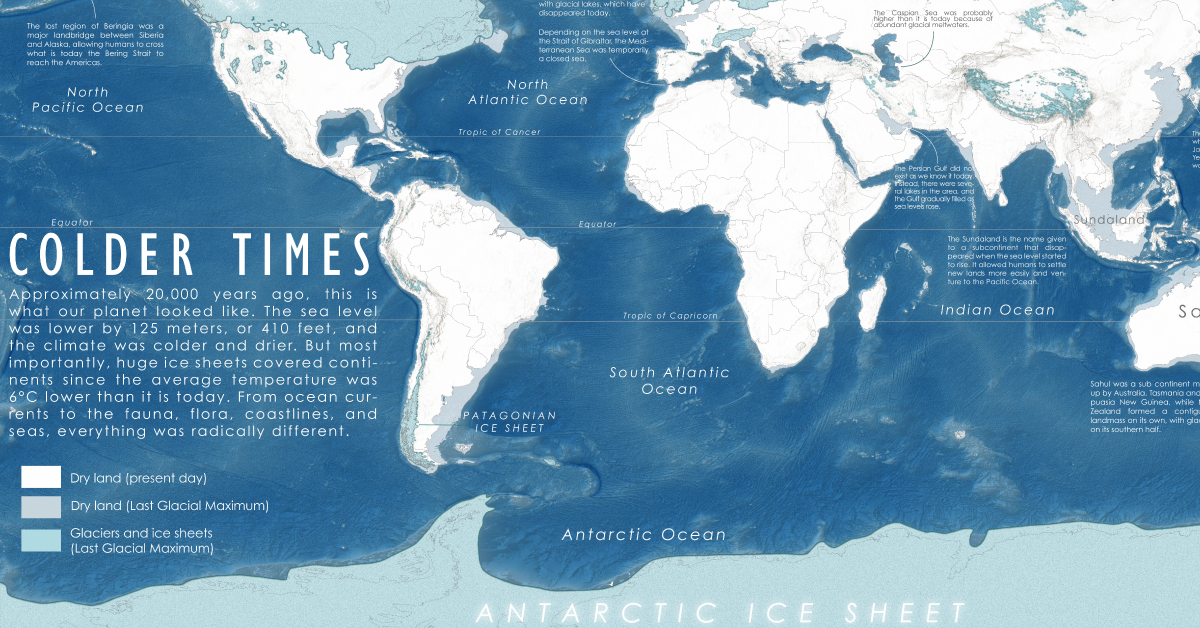
This map by cartographer Perrin Remonté offers a snapshot of the Earth from that time, using data of past sea levels and glaciers from research published in 2009, 2014, and 2021, alongside modern-day topographical data.
Let’s dive into the differences between the two Earths below.
The Last Ice Age: Low Seas, Exposed Landmasses
During an ice age, sea levels fall as ocean water that evaporates is stored on land on a large scale (ice sheets, ice caps, glaciers) instead of returning to the ocean.
| Earth's Ice Cover | 20,000 Years Ago | Today |
|---|---|---|
| Surface | 8% | 3% |
| Land | 25% | 11% |
At the time of the LGM, the climate was cold and dry with temperatures that were 6 °C (11 °F) lower on average. Water levels in the ocean were more than 400 feet below what they are now, exposing large areas of the continental shelf.
In the map above, these areas are represented as the gray, dry land most noticeable in a few big patches in Southeast Asia and between Russia and Alaska. Here are a few examples of regions of dry land from 20,000 years ago that are now under water:
- A “lost continent” called Sundaland, a southeastern extension of Asia which forms the island regions of Indonesia today. Some scholars see a connection with this location and the mythical site of Atlantis, though there are many other theories.
- The Bering land bridge, now a strait, connecting Asia and North America. It is central to the theory explaining how ancient humans crossed between the two continents.
- Another land bridge connected the island of Great Britain with the rest of continental Europe. The island of Ireland is in turn connected to Great Britain by a giant ice sheet.
- In Japan, the low water level made the Sea of Japan a lake, and a land bridge connected the region to the Asian mainland. The Yellow Sea—famous as a modern-day fishing location—was completely dry.
The cold temperatures also caused the polar parts of continents to be covered by massive ice sheets, with glaciers forming in mountainous areas.
Flora and Fauna in the Last Ice Age
The dry climate during the last ice age brought about the expansion of deserts and the disappearance of rivers, but some areas saw increased precipitation from falling temperatures.
Most of Canada and Northern Europe was covered with large ice sheets. The U.S. was a mix of ice sheets, alpine deserts, snow forests, semi-arid scrubland and temperate grasslands. Areas that are deserts today—like the Mojave—were filled with lakes. The Great Salt Lake in Utah is a remnant from this time.
Africa had a mix of grasslands in its southern half and deserts in the north—the Sahara Desert existed then as well—and Asia was a mix of tropical deserts in the west, alpine deserts in China, and grasslands in the Indian subcontinent.
Several large animals like the woolly mammoth, the mastodon, the giant beaver, and the saber-toothed tiger roamed the world in extremely harsh conditions, but sadly all are extinct today.
However, not all megafauna from the LGM disappeared forever; many species are still alive, including the Bactrian camel, the tapir, the musk ox, and the white rhinoceros—though the latter is now an endangered species.
Will There Be Another Ice Age?
In a technical sense, we’re still in an “ice age” called the Quaternary Glaciation, which began about 2.6 million years ago. That’s because a permanent ice sheet has existed for the entire time, the Antarctic, which makes geologists call this entire period an ice age.
We are currently in a relatively warmer part of that ice age, described as an interglacial period, which began 11,700 years ago. This geological epoch is known as the Holocene.
Over billions of years, the Earth has experienced numerous glacial and interglacial periods and has had five major ice ages:
| Major Ice Ages | Name | Time Period (Years Ago) |
|---|---|---|
| 1 | Huronian Glaciation | 2.4 billion - 2.1 billion |
| 2 | Cryogenian Glaciation | 720 million - 635 million |
| 3 | Andean-Saharan Glaciation | 450 million - 420 million |
| 4 | Late Paleozoic ice age | 335 million - 260 million |
| 5 | Quaternary Glaciation | 2.6 million - present |
It is predicted that temperatures will fall again in a few thousand years, leading to expansion of ice sheets. However there are a dizzying array of factors that are still not understood well enough to say comprehensively what causes (or ends) ice ages.
A popular explanation says the degree of the Earth’s axial tilt, its wobble, and its orbital shape, are the main factors heralding the start and end of this phenomenon.
The variations in all three lead to a change in how much prolonged sunlight parts of the world receive, which in turn can cause the creation or melting of ice sheets. But these take thousands of years to coincide and cause a significant change in climate.
Furthermore, current industrial activities have warmed the climate considerably and may in fact delay the next ice age by 50,000-100,000 years.

This article was published as a part of Visual Capitalist's Creator Program, which features data-driven visuals from some of our favorite Creators around the world.


Maps
The Largest Earthquakes in the New York Area (1970-2024)
The earthquake that shook buildings across New York in April 2024 was the third-largest quake in the Northeast U.S. over the past 50 years.


The Largest Earthquakes in the New York Area
This was originally posted on our Voronoi app. Download the app for free on Apple or Android and discover incredible data-driven charts from a variety of trusted sources.
The 4.8 magnitude earthquake that shook buildings across New York on Friday, April 5th, 2024 was the third-largest quake in the U.S. Northeast area over the past 50 years.
In this map, we illustrate earthquakes with a magnitude of 4.0 or greater recorded in the Northeastern U.S. since 1970, according to the United States Geological Survey (USGS).
Shallow Quakes and Older Buildings
The earthquake that struck the U.S. Northeast in April 2024 was felt by millions of people from Washington, D.C., to north of Boston. It even caused a full ground stop at Newark Airport.
The quake, occurring just 5 km beneath the Earth’s surface, was considered shallow, which is what contributed to more intense shaking at the surface.
According to the USGS, rocks in the eastern U.S. are significantly older, denser, and harder than those on the western side, compressed by time. This makes them more efficient conduits for seismic energy. Additionally, buildings in the Northeast tend to be older and may not adhere to the latest earthquake codes.
Despite disrupting work and school life, the earthquake was considered minor, according to the Michigan Technological University magnitude scale:
| Magnitude | Earthquake Effects | Estimated Number Each Year |
|---|---|---|
| 2.5 or less | Usually not felt, but can be recorded by seismograph. | Millions |
| 2.5 to 5.4 | Often felt, but only causes minor damage. | 500,000 |
| 5.5 to 6.0 | Slight damage to buildings and other structures. | 350 |
| 6.1 to 6.9 | May cause a lot of damage in very populated areas. | 100 |
| 7.0 to 7.9 | Major earthquake. Serious damage. | 10-15 |
| 8.0 or greater | Great earthquake. Can totally destroy communities near the epicenter. | One every year or two |
The largest earthquake felt in the area over the past 50 years was a 5.3 magnitude quake that occurred in Au Sable Forks, New York, in 2002. It damaged houses and cracked roads in a remote corner of the Adirondack Mountains, but caused no injuries.
| Date | Magnitude | Location | State |
|---|---|---|---|
| April 20, 2002 | 5.3 | Au Sable Forks | New York |
| October 7, 1983 | 5.1 | Newcomb | New York |
| April 5, 2024 | 4.8 | Whitehouse Station | New Jersey |
| October 16, 2012 | 4.7 | Hollis Center | Maine |
| January 16, 1994 | 4.6 | Sinking Spring | Pennsylvania |
| January 19, 1982 | 4.5 | Sanbornton | New Hampshire |
| September 25, 1998 | 4.5 | Adamsville | Pennsylvania |
| June 9, 1975 | 4.2 | Altona | New York |
| May 29, 1983 | 4.2 | Peru | Maine |
| April 23, 1984 | 4.2 | Conestoga | Pennsylvania |
| January 16, 1994 | 4.2 | Sinking Spring | Pennsylvania |
| November 3, 1975 | 4 | Long Lake | New York |
| June 17, 1991 | 4 | Worcester | New York |
The largest earthquake in U.S. history, however, was the 1964 Good Friday quake in Alaska, measuring 9.2 magnitude and killing 131 people.

-

 Real Estate2 weeks ago
Visualizing America’s Shortage of Affordable Homes
-

 Technology1 week ago
Ranked: Semiconductor Companies by Industry Revenue Share
-

 Money1 week ago
Which States Have the Highest Minimum Wage in America?
-

 Real Estate1 week ago
Ranked: The Most Valuable Housing Markets in America
-

 Business2 weeks ago
Charted: Big Four Market Share by S&P 500 Audits
-

 AI2 weeks ago
The Stock Performance of U.S. Chipmakers So Far in 2024
-

 Misc2 weeks ago
Almost Every EV Stock is Down After Q1 2024
-

 Money2 weeks ago
Where Does One U.S. Tax Dollar Go?