Science
Draining the World’s Oceans to Visualize Earth’s Surface
Article/Editing:
Draining the World’s Oceans to Visualize Earth’s Surface
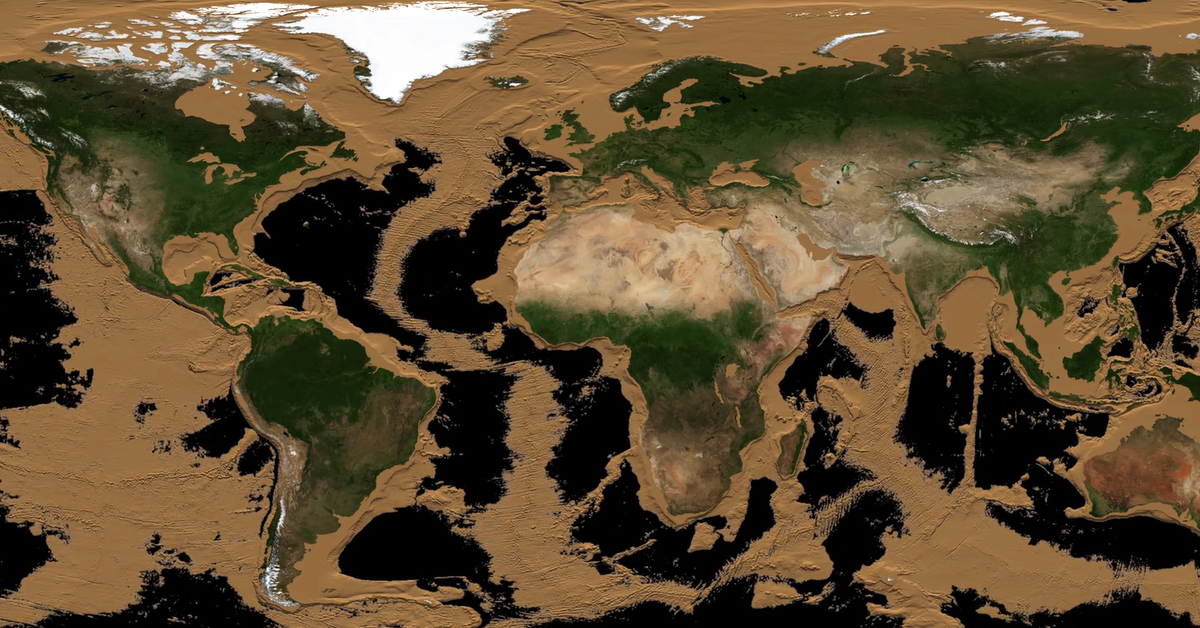
Although many maps of our planet go into great topographical detail on land, almost two-thirds of the Earth’s surface is covered by the world’s oceans.
Hidden from sight lie aquatic mountain ranges, continental shelves, and trenches that dive deep into the Earth’s crust. We might be familiar with a few of the well-known formations on the ocean floor, but there’s a whole detailed “world” that’s as rich as the surface, just waiting to be explored.
This animation from planetary researcher James O’Donoghue of the Japan Aerospace Exploration Agency (JAXA) and NASA simulates the draining the world’s oceans to quickly reveal the full extent of the Earth’s surface.
How Deep Does the Ocean Go?
Above sea level, Earth’s topography reaches all the way up to 8,849 meters (29,032 ft) to the top of Mt. Everest. But going below sea level, it actually goes deeper than the height of Everest.
Open ocean is called the pelagic zone, which can be broken down into five regions by depth:
- 0m–200m: Epipelagic (sunlight zone). Illuminated shallower waters that contain most of the ocean’s plants and animals.
- 200m–1,000m: Mesopelagic (twilight zone). Stretches from where 1% of surface light reaches to where surface light ends. Contains mainly bacteria, as well as some large organisms like the swordfish and the squid.
- 1,000m–4,000m: Bathypelagic (midnight zone). Pitch black outside of a few bioluminescent organisms, with no living plants. Smaller anglerfish, squid, and sharks live here, as well as a few large organisms like giant squid.
- 4,000m–6,000m: Abyssopelagic (abyssal zone). Long thought to be the bottomless end of the sea, the abyssal zone reaches to just above the ocean floor and contains little life due to extremely cold temperatures, high pressures, and complete darkness.
- 6,000m–11,000m: Hadopelagic (hadal zone). Named after Hades, the Greek god of the underworld, the hadal zone is the deepest part of the ocean. It can be found primarily in trenches below the ocean floor.
To put ocean depths into context, the bottom of the ocean is more than 2,000m greater than the peak of Mount Everest.
What “Draining” the World’s Oceans Reveals
For a long time, the ocean floor was believed to be less understood than the Moon.
The sheer depth of water made it difficult to map without newer technology, and the tremendous pressure and extreme temperatures make navigation grueling. A manned vehicle reached the deepest known point of the Mariana Trench—the Challenger Deep—in 1960, almost 90 years after it was first charted in 1872.
But over the last few decades, humanity’s understanding and exploration of the ocean floor has grown in leaps and bounds. O’Donoghue’s animation shows just how much detail we’ve been missing.
The first easily noticeable characteristic is the Earth’s continental shelves, which appear quickly. Most are visible by 140 meters, though the Arctic and Antarctic shelves are far deeper.
The animation then speeds up, as thousands of meters of depth reveal the tops of small mountain ridges and aquatic islands. From 2,000 to 3,000 meters, mid-ocean ridges appear that span the length of the Arctic, Pacific, and Indian oceans.
From 3,000 to 6,000 meters of ocean drained, these aquatic mountains slowly give way to the vast majority of the ocean floor. Little changes over the final 5,000 meters except to illustrate just how deep the ocean’s trenches reach.
Of course, technically the bottom of the Challenger deep is the deepest known point of the Mariana Trench. As satellite and imaging technology improves further, and aquatic mapping voyages become more possible, who knows what else we’ll discover beneath the waves.

This article was published as a part of Visual Capitalist's Creator Program, which features data-driven visuals from some of our favorite Creators around the world.


Science
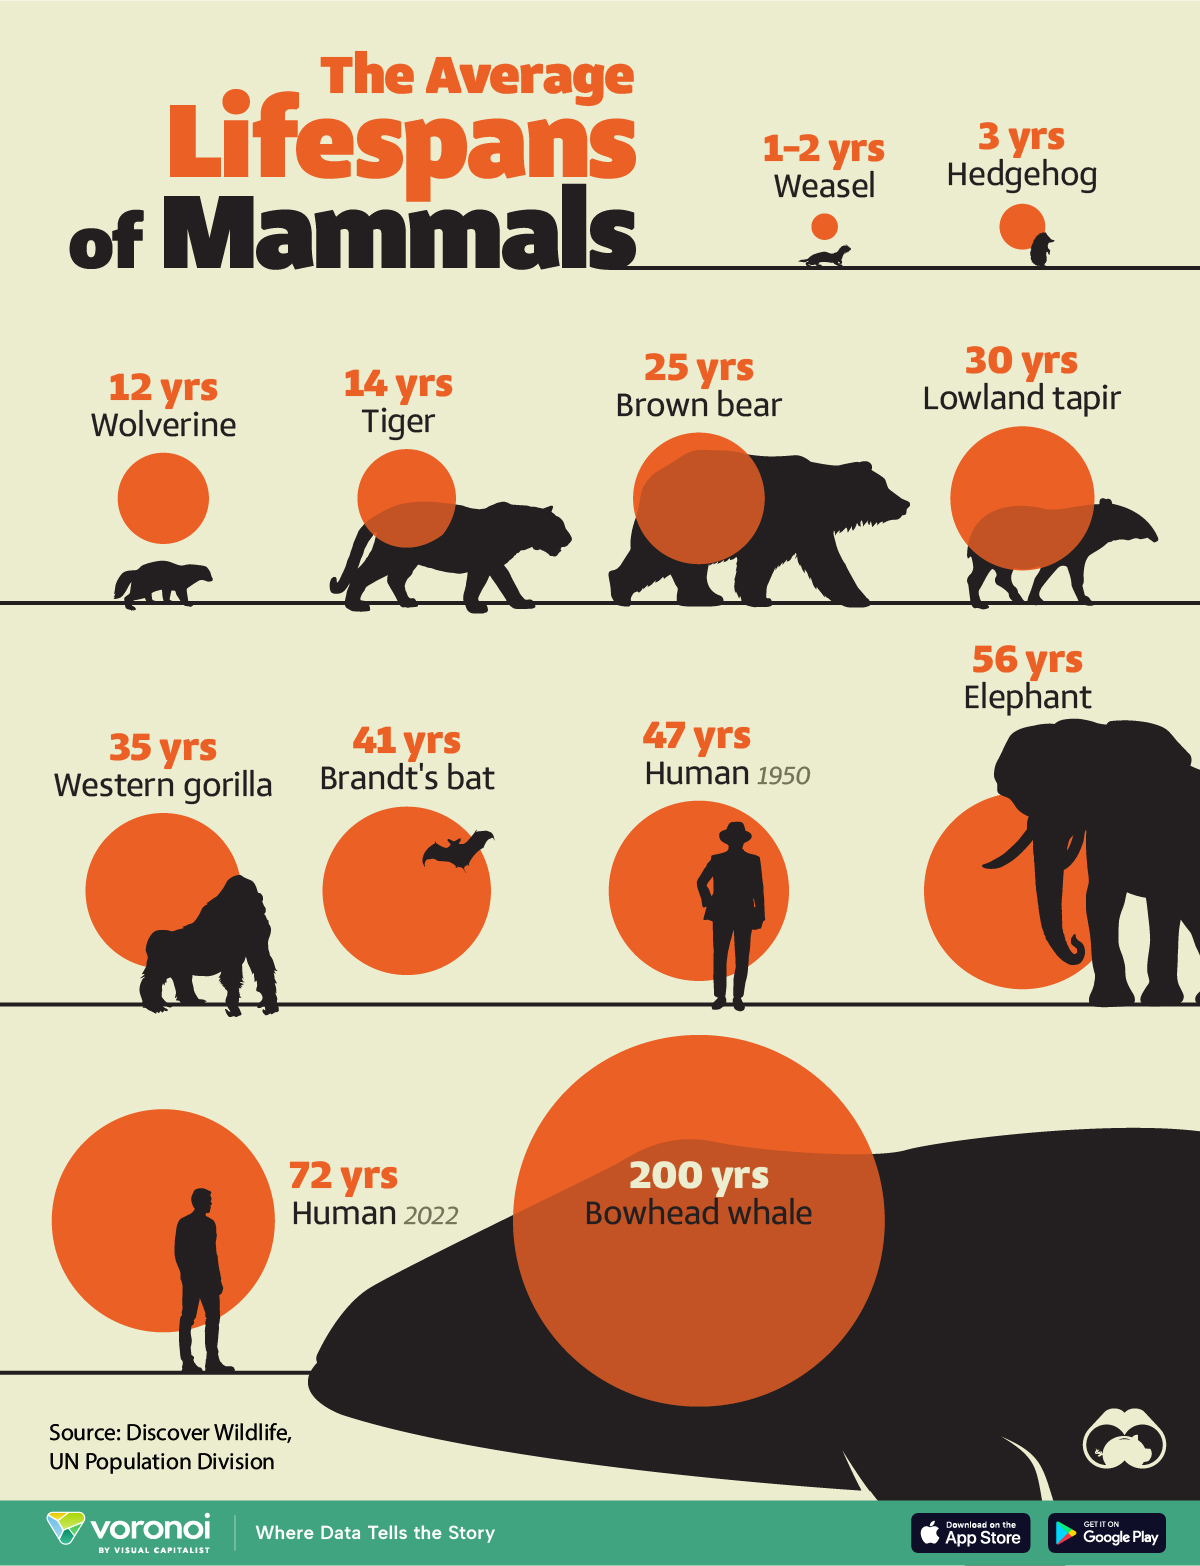
Visualizing the Average Lifespans of Mammals
While smaller animals such as weasels typically live 1-2 years, larger counterparts can thrive for decades.
Visualizing the Average Lifespans of Mammals
This was originally posted on our Voronoi app. Download the app for free on iOS or Android and discover incredible data-driven charts from a variety of trusted sources.
Mammals, though comprising a small fraction of Earth’s creatures, hold vital ecological roles globally. They are crucial for maintaining ecosystem health through services like pollination, seed dispersal, and predator-prey dynamics.
In this visualization, we depict the average lifespans of mammals, using data from Discover Wildlife and the United Nations.
Human Lifespans on the Rise
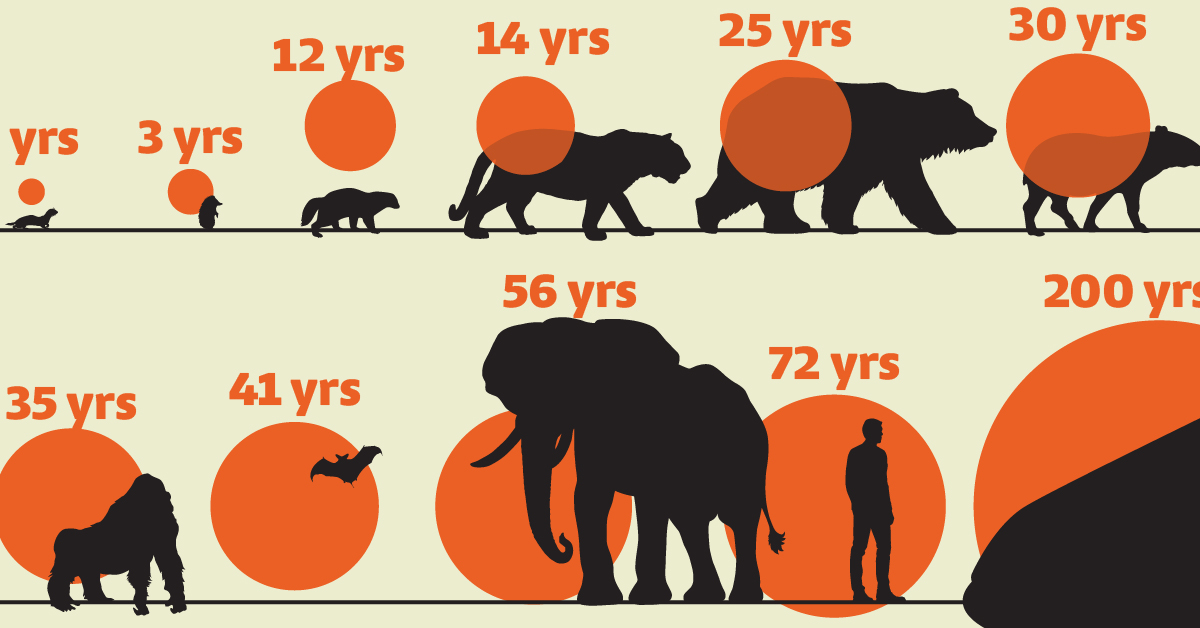
Defined as warm-blooded creatures with hair or fur, mammals nurse their young with milk from mammary glands. While smaller animals such as weasels typically live 1-2 years, larger counterparts like elephants can thrive for decades, and bowhead whales can live for 200 years, or even longer.
| Animal | Average lifespan (years) |
|---|---|
| Weasel | 1 to 2 |
| Hedgehog | 3 |
| Wolverine | 12 |
| Tiger | 14 |
| Brown bear | 25 |
| Lowland tapir | 30 |
| Western gorilla | 35 |
| Brandt's bat | 41 |
| Humans (1950) | 47 |
| Elephant | 56 |
| Humans (2022) | 72 |
| Bowhead whale | 200 |
Notably, human lifespans have experienced a remarkable surge. According to the UN Population Division, the global average life expectancy has surged from 47 years in 1950 to 72 years in 2022, marking a 25-year increase. This is attributed to advancements in nutrition, medication, and essential resources.
However, as human longevity flourishes, it can have an adverse effect on wildlife mammal populations. To put this into numbers, over the past 100,000 years, the surge in human population has precipitated an 85% reduction in wild mammal biomass.
Today, livestock dominates 62% of the world’s mammal biomass, with humans accounting for 34%, while wild mammals comprise only 4%.
Despite a decline in mammal diversity, the total biomass of terrestrial mammals has significantly increased, expanding approximately ninefold over the past 10,000 years.
Curious to learn more about mammals? Check out this graphic that shows the biomass of all the world’s mammals.

-

 Debt1 week ago
How Debt-to-GDP Ratios Have Changed Since 2000
-

 Markets2 weeks ago
Ranked: The World’s Top Flight Routes, by Revenue
-

 Countries2 weeks ago
Population Projections: The World’s 6 Largest Countries in 2075
-

 Markets2 weeks ago
The Top 10 States by Real GDP Growth in 2023
-

 Demographics2 weeks ago
The Smallest Gender Wage Gaps in OECD Countries
-

 United States2 weeks ago
Where U.S. Inflation Hit the Hardest in March 2024
-

 Green2 weeks ago
Top Countries By Forest Growth Since 2001
-

 United States2 weeks ago
Ranked: The Largest U.S. Corporations by Number of Employees