Green
Which Countries are Mapping the Ocean Floor?
Which Countries are Mapping the Ocean Floor?
Our vast and complex planet is becoming less mysterious with each passing day.
Consider the following:
- Thousands of satellites are now observing every facet of our planet
- Around three-quarters of Earth’s land surface is now influenced by human activity
- Aircraft-based LIDAR mapping is creating new models of the physical world in staggering detail
But, despite all of these impressive advances, our collective knowledge of the ocean floor still has some surprising blind spots.
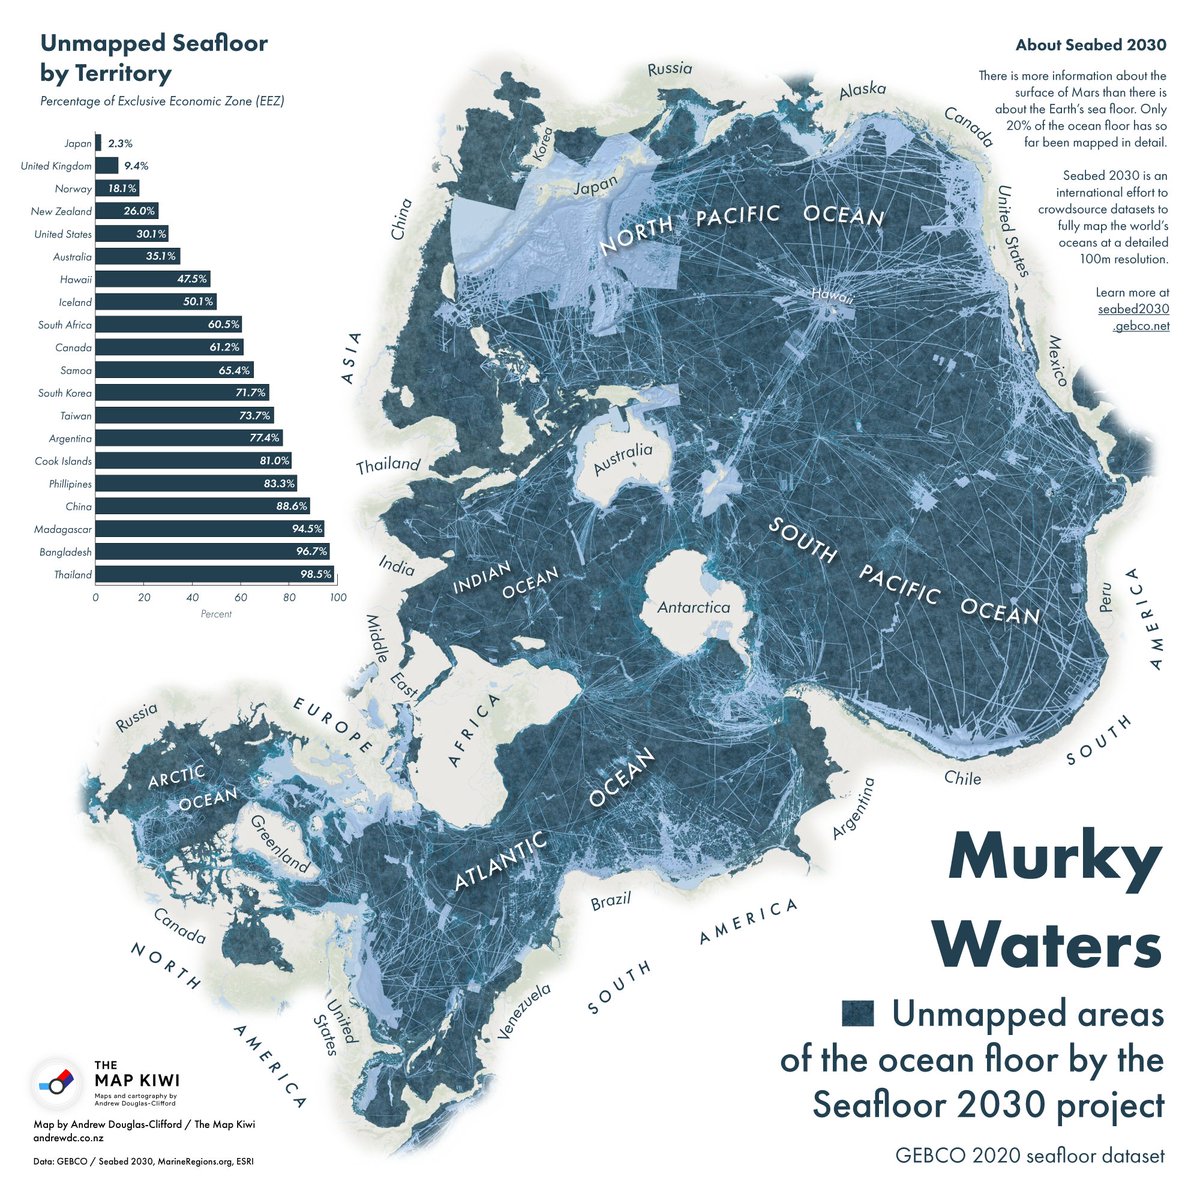
Today’s unique map from cartographer Andrew Douglas-Clifford (aka The Map Kiwi) focuses on ocean territory instead of land, highlighting the vast areas of the ocean floor that remain unmapped. Which countries are exploring their offshore territory, and how much of the ocean floor still remains a mystery to us? Let’s dive in.
What Do We Know Right Now?
Today, we have a surprisingly incomplete picture of what lies beneath the waves. In fact, if you were to fly from Los Angeles to Sydney, the bulk of your journey would take place over territory that is mapped in only the broadest sense.
Most of what we know about the ocean floor’s topography was pieced together from gravity data gathered by satellites. While useful as a starting point, the resulting spatial resolution is about two square miles (5km). By comparison, topographic maps of Mars and Venus have a resolution that’s 50x more detailed.
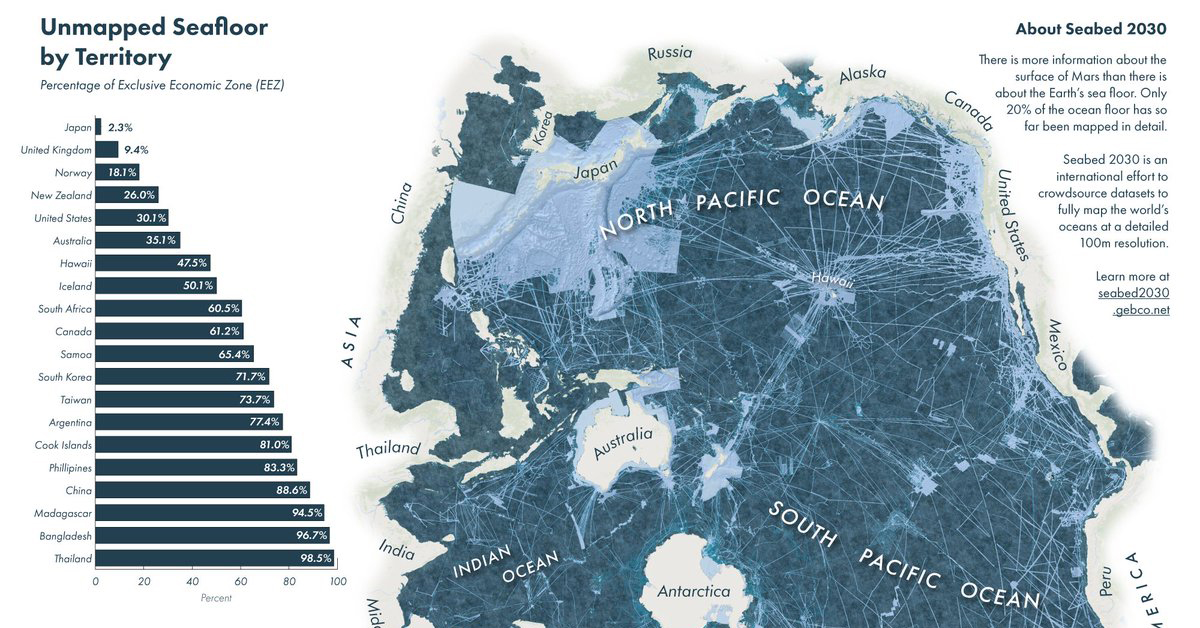
As the map above clearly illustrates, only a few large pieces of the ocean have been mapped—and not surprisingly, many of these higher resolution portions lie along the world’s shipping lanes.
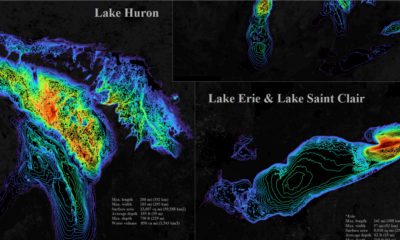
Another way to see this clear difference in resolution is through Google Maps:
As you can see above, these shipping lanes running through the Pacific Ocean have been mapped at a higher resolution that the surrounding ocean floor.
The Countries Mapping the Ocean Floor
The closer an area is to a population center, the higher the likelihood it has been mapped. That said, many countries still have a long way to go before they have a clear picture of their land beneath the waves.
Here is a snapshot of how far along countries are in their subsea mapping efforts:
| Countries/territories | Size of Exclusive Economic Zone* (EEZ) | Percentage of EEZ mapped |
|---|---|---|
| Japan | 1,729,501 mi² (4,479,388 km²) | 97.7% |
| United Kingdom | 2,627,651 mi² (6,805,586 km²) | 90.6% |
| Norway | 920,922 mi² (2,385,178 km²) | 81.9% |
| New Zealand | 1,576,742 mi² (4,083,744 km²) | 74.0% |
| United States | 4,382,645 mi² (11,351,000 km²) | 69.9% |
| Australia | 3,283,933 mi² (8,505,348 km²) | 64.9% |
| Iceland | 291,121 mi² (754,000 km²) | 49.9% |
| South Africa | 592,874 mi² (1,535,538 km²) | 39.5% |
| Canada | 2,161,815 mi² (5,599,077 km²) | 38.8% |
| Samoa | 49,401 mi² (127,950 km²) | 34.6% |
| South Korea | 183,579 mi² (475,469 km²) | 28.3% |
| Taiwan | 32,135 mi² (83,231 km²) | 26.3% |
| Argentina | 447,516 mi² (1,159,063 km²) | 22.6% |
| Cook Islands | 756,770 mi² (1,960,027 km²) | 29.0% |
| Phillippines | 614,203 mi² (1,590,780 km²) | 16.7% |
| China | 338,618 mi² (877,019 km²) | 11.4% |
| Madagascar | 473,075 mi² (1,225,259 km²) | 5.5% |
| Bangladesh | 45,873 mi² (118,813 km²) | 3.3% |
| Thailand | 115,597 mi² (299,397 km²) | 1.5% |
*An exclusive economic zone (EEZ) is the sea zone stretching 200 nautical miles (nmi) from the coast of a state.
Japan and the UK, which have the 5th and 8th largest EEZs respectively, are the clear leaders in mapping their ocean territory.
Piecing Together the Puzzle
Sometimes tragedy can have a silver lining. By the time the search for Malaysia Airlines Flight 370 concluded in 2014, scientists had gained access to more than 100,000 square miles of newly mapped sections of the Indian Ocean.
Of course, it will take a more systematic approach and sustained effort to truly map the world’s ocean floors. Thankfully, a project called Seabed 2030 has the ambitious goal of mapping the entire ocean floor by 2030. The organization is collaborating with existing mapping initiatives in various regions to compile bathymetric information (undersea map data).
It’s been said without hyperbole that we know more about the surface of Mars than we do about our own planet’s seabed, but thanks to the efforts of Seabed 2030 and other initiatives around the world, puzzle pieces are finally falling into place.


Green
The Carbon Footprint of Major Travel Methods
Going on a cruise ship and flying domestically are the most carbon-intensive travel methods.


The Carbon Footprint of Major Travel Methods
This was originally posted on our Voronoi app. Download the app for free on iOS or Android and discover incredible data-driven charts from a variety of trusted sources.
Did you know that transport accounts for nearly one-quarter of global energy-related carbon dioxide (CO₂) emissions?
This graphic illustrates the carbon footprints of major travel methods measured in grams of carbon dioxide equivalent (CO₂e) emitted per person to travel one kilometer. This includes both CO₂ and other greenhouse gases.
Data is sourced from Our World in Data, the UK Government’s Department for Energy Security and Net Zero, and The International Council on Clean Transportation, as of December 2022.
These figures should be interpreted as approximations, rather than exact numbers. There are many variables at play that determine the actual carbon footprint in any individual case, including vehicle type or model, occupancy, energy mix, and even weather.
Cruise Ships are the Most Carbon-Intensive Travel Method
According to these estimates, taking a cruise ship, flying domestically, and driving alone are some of the most carbon-intensive travel methods.
Cruise ships typically use heavy fuel oil, which is high in carbon content. The average cruise ship weighs between 70,000 to 180,000 metric tons, meaning they require large engines to get moving.
These massive vessels must also generate power for onboard amenities such as lighting, air conditioning, and entertainment systems.
Short-haul flights are also considered carbon-intensive due to the significant amount of fuel consumed during initial takeoff and climbing altitude, relative to a lower amount of cruising.
| Transportation method | CO₂ equivalent emissions per passenger km |
|---|---|
| Cruise Ship | 250 |
| Short-haul flight (i.e. within a U.S. state or European country) | 246 |
| Diesel car | 171 |
| Gas car | 170 |
| Medium-haul flight (i.e. international travel within Europe, or between U.S. states) | 151 |
| Long-haul flight (over 3,700 km, about the distance from LA to NY) | 147 |
| Motorbike | 113 |
| Bus (average) | 96 |
| Plug-in hybrid | 68 |
| Electric car | 47 |
| National rail | 35 |
| Tram | 28 |
| London Underground | 27 |
| Ferry (foot passenger) | 19 |
| Eurostar (International rail) | 4.5 |
Are EVs Greener?
Many experts agree that EVs produce a lower carbon footprint over time versus traditional internal combustion engine (ICE) vehicles.
However, the batteries in electric vehicles charge on the power that comes straight off the electrical grid—which in many places may be powered by fossil fuels. For that reason, the carbon footprint of an EV will depend largely on the blend of electricity sources used for charging.
There are also questions about how energy-intensive it is to build EVs compared to a comparable ICE vehicle.

-

 Debt1 week ago
How Debt-to-GDP Ratios Have Changed Since 2000
-

 Markets2 weeks ago
Ranked: The World’s Top Flight Routes, by Revenue
-

 Countries2 weeks ago
Population Projections: The World’s 6 Largest Countries in 2075
-

 Markets2 weeks ago
The Top 10 States by Real GDP Growth in 2023
-

 Demographics2 weeks ago
The Smallest Gender Wage Gaps in OECD Countries
-

 United States2 weeks ago
Where U.S. Inflation Hit the Hardest in March 2024
-

 Green2 weeks ago
Top Countries By Forest Growth Since 2001
-

 United States2 weeks ago
Ranked: The Largest U.S. Corporations by Number of Employees