Green
Visualizing the Human Impact on the Earth’s Surface
Click here to view the full version of this graphic
Visualizing the Human Impact on the Earth’s Surface
View the high resolution version of this map by clicking here.
There is little doubt that human activity has impacted the Earth, but to what extent?
As it turns out, nearly 95% of the Earth’s surface shows some form of human modification, with 85% bearing evidence of multiple forms of human impact.
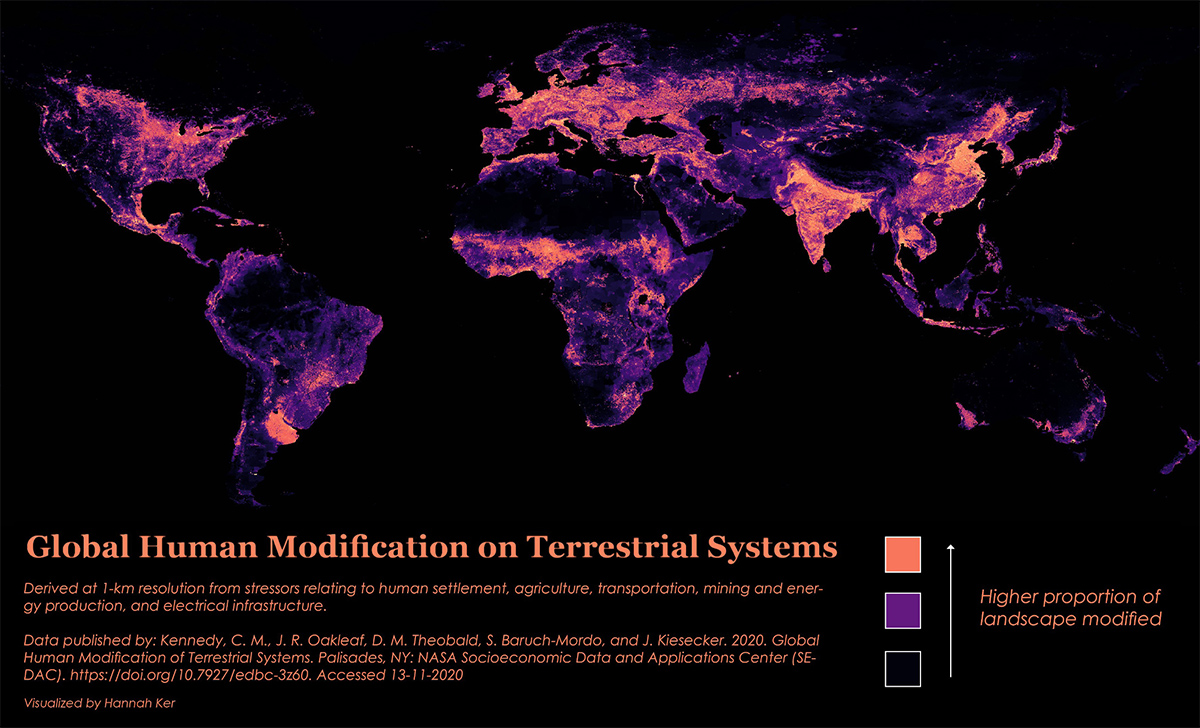
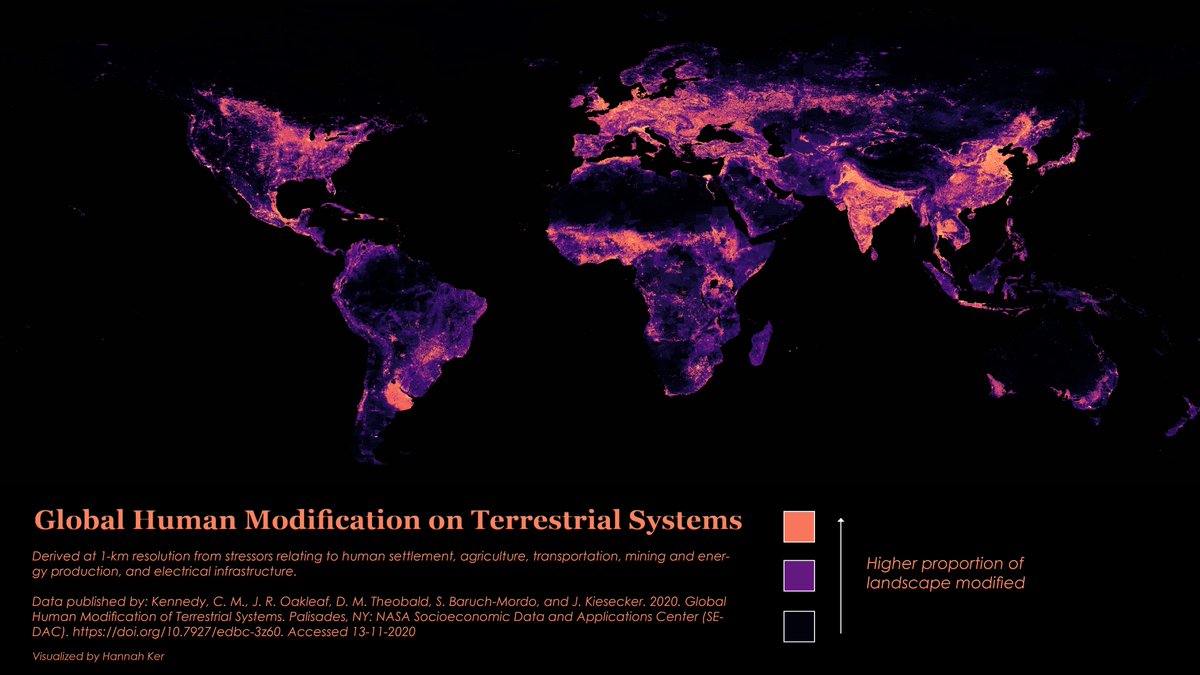
This map by data scientist Hannah Ker outlines the extent of humanity’s modification on terrestrial land ecosystems.
Measuring the Human Impact
This map relies on the Global Human Modification of Terrestrial Systems data set, which tracks the physical extent of 13 anthropogenic stressors across five categories.
- Human settlement: population density, built‐up areas
- Agriculture: cropland, livestock
- Transportation: major roads, minor roads, two tracks, railroads
- Mining and energy production: mining, oil wells, wind turbines
- Electrical infrastructure: powerlines, nighttime lights
Researchers compiled all these stress factors and scaled their impact from 0 to 1. Then, in order to map the impacts spatially, the surface of land was organized into cells of 1 kilometer in length creating “edges” of varying impact.
These impacts are further organized by biomes—distinct biological communities that have formed in response to a shared physical climate.
Digging into the Data
Only 5% of the world’s lands are unaffected by humans, which amounts to nearly 7 million km² of the Earth’s land, and 44% (59 million km²) is categorized as low modification.
The remainder of land has a moderate to high degree of modification: with 34% categorized as moderate (46 million km²), 13% categorized as high (17 million km²), and 4% categorized as very high modification (5.5 million km²). This latter category is the most visible on the map, with portions of China, India, and Italy serving as focal points.
Below is a look at how Earth’s various biomes fare under this ranking system:
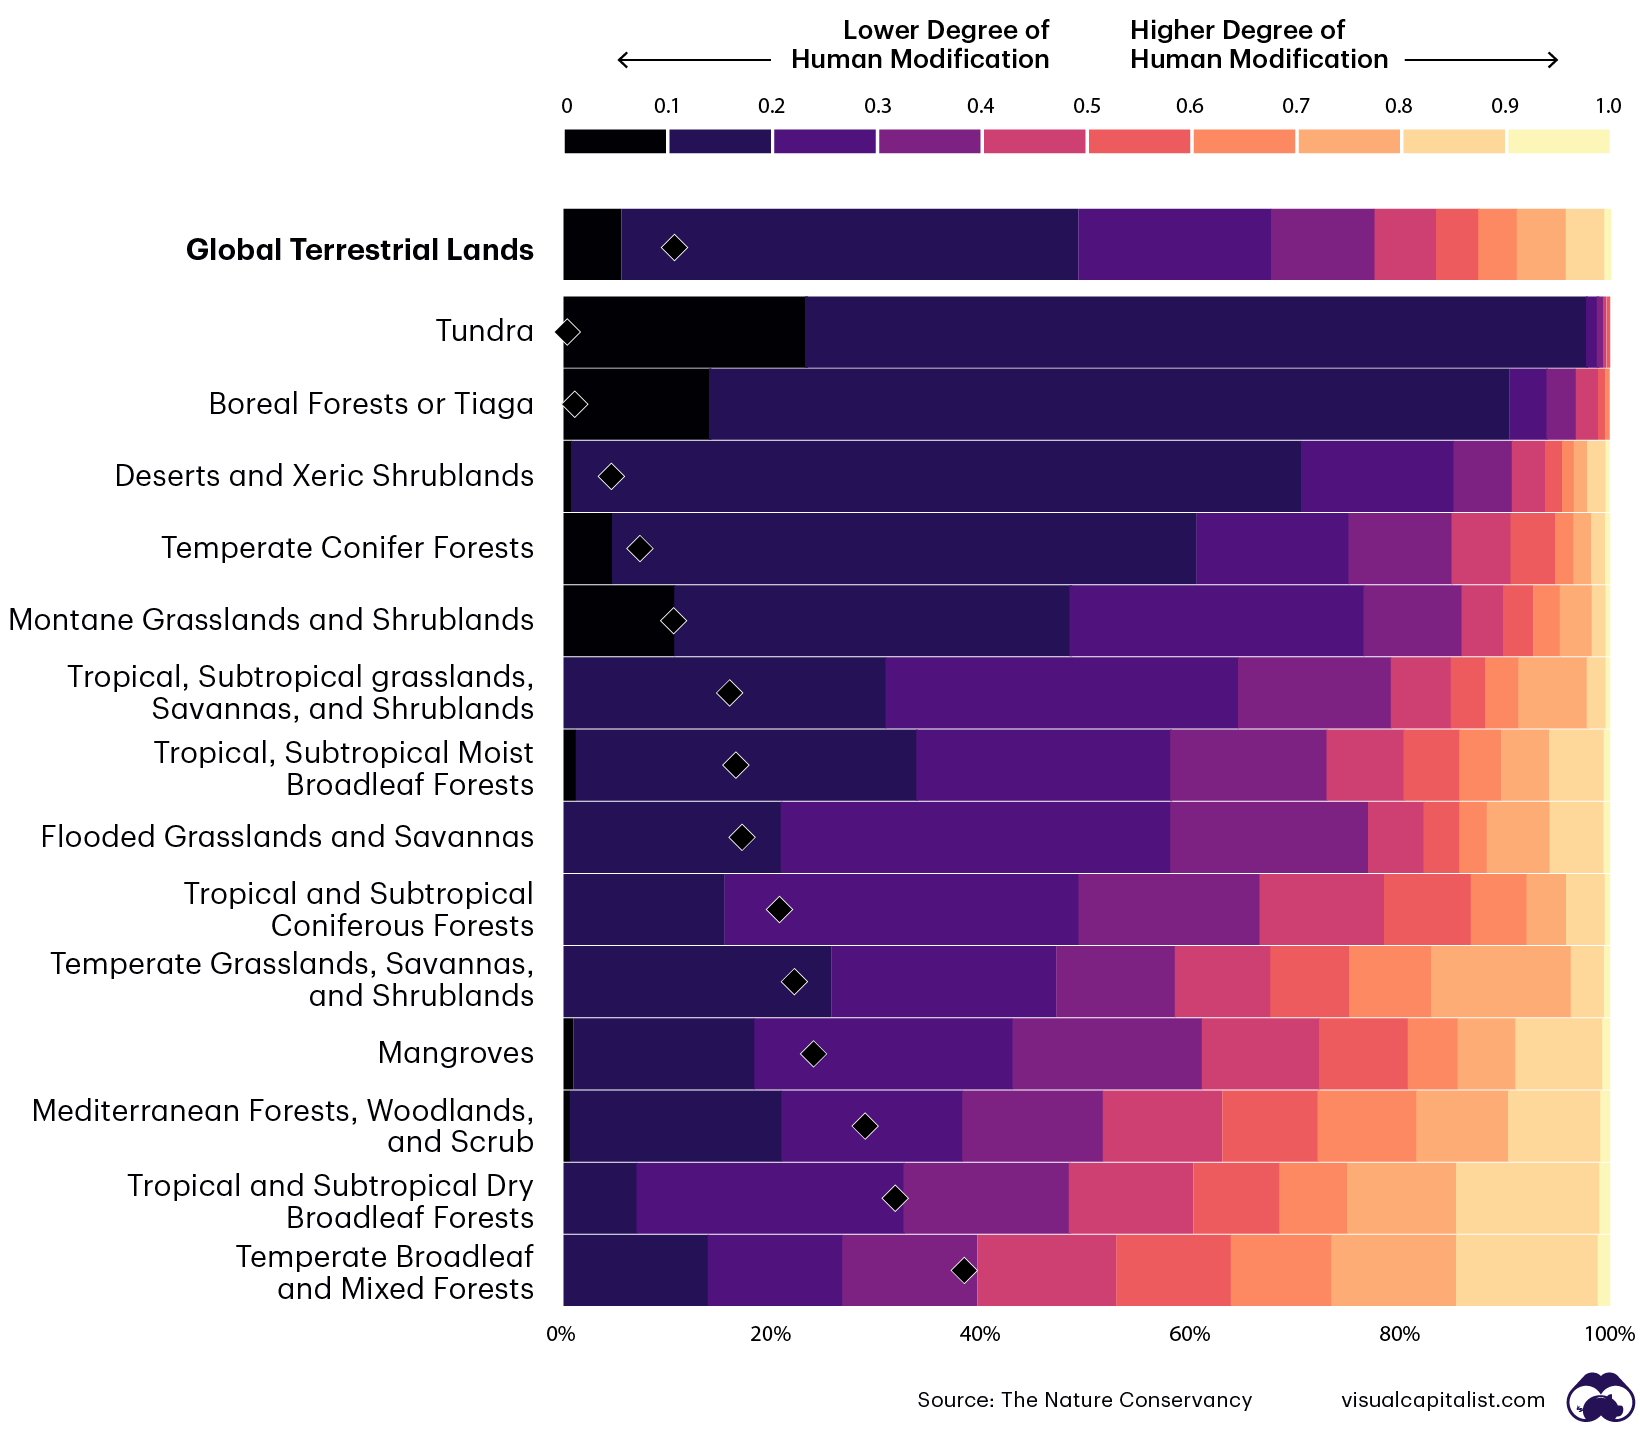
Out of the 14 biomes studied, the least modified biomes are tundra, boreal forests, deserts, temperate coniferous forests, and montane grasslands. Tropical dry broadleaf forests, temperate broadleaf forests, Mediterranean forests, mangroves, and temperate grasslands are the most modified biomes.
Dense human settlements, agricultural land uses, networks of infrastructure, and industrial activities dominate the more highly modified biomes. These lands are commonly subject to five or more human stressors simultaneously, threatening naturally-occurring ecosystem services.
What are Ecosystem Services?
An ecosystem service is any positive benefit that wildlife or ecosystems provide to people, and they can be sorted into four categories:
- Provisioning Services: This is the primary benefit of nature. Humans derive their food, water, and resources from nature.
- Regulating: Plants clean air and filter water, tree roots help to keep soil in place to prevent erosion, bees pollinate flowers, and bacterial colonies help to decompose waste.
- Cultural Services: Humans have long interacted with the “wild” and it in turn has influenced our social, intellectual, and cultural development. However, the built environment of a city or town separates man from nature and ancient patterns of life. Ecosystems have long served as inspiration for music, art, architecture, and recreation.
- Supporting Services: Ecosystems contain the fundamental natural processes that make life possible such as photosynthesis, nutrient cycling, soil creation, and the water cycle. These natural processes bring the Earth to life. Without these supporting services, provisional, regulating, and cultural services wouldn’t exist.
A Delicate Balance
With each encroachment upon habitat, the potential increases for humans to inadvertently upset the careful balance of ecosystem services that have nourished the processes of life on Earth.
As we become more aware of the human impact on the plant, we can make smarter decisions about how our society and economies function—ultimately ensuring that the same ecosystem services are there for future generations.


Green
The Carbon Footprint of Major Travel Methods
Going on a cruise ship and flying domestically are the most carbon-intensive travel methods.


The Carbon Footprint of Major Travel Methods
This was originally posted on our Voronoi app. Download the app for free on iOS or Android and discover incredible data-driven charts from a variety of trusted sources.
Did you know that transport accounts for nearly one-quarter of global energy-related carbon dioxide (CO₂) emissions?
This graphic illustrates the carbon footprints of major travel methods measured in grams of carbon dioxide equivalent (CO₂e) emitted per person to travel one kilometer. This includes both CO₂ and other greenhouse gases.
Data is sourced from Our World in Data, the UK Government’s Department for Energy Security and Net Zero, and The International Council on Clean Transportation, as of December 2022.
These figures should be interpreted as approximations, rather than exact numbers. There are many variables at play that determine the actual carbon footprint in any individual case, including vehicle type or model, occupancy, energy mix, and even weather.
Cruise Ships are the Most Carbon-Intensive Travel Method
According to these estimates, taking a cruise ship, flying domestically, and driving alone are some of the most carbon-intensive travel methods.
Cruise ships typically use heavy fuel oil, which is high in carbon content. The average cruise ship weighs between 70,000 to 180,000 metric tons, meaning they require large engines to get moving.
These massive vessels must also generate power for onboard amenities such as lighting, air conditioning, and entertainment systems.
Short-haul flights are also considered carbon-intensive due to the significant amount of fuel consumed during initial takeoff and climbing altitude, relative to a lower amount of cruising.
| Transportation method | CO₂ equivalent emissions per passenger km |
|---|---|
| Cruise Ship | 250 |
| Short-haul flight (i.e. within a U.S. state or European country) | 246 |
| Diesel car | 171 |
| Gas car | 170 |
| Medium-haul flight (i.e. international travel within Europe, or between U.S. states) | 151 |
| Long-haul flight (over 3,700 km, about the distance from LA to NY) | 147 |
| Motorbike | 113 |
| Bus (average) | 96 |
| Plug-in hybrid | 68 |
| Electric car | 47 |
| National rail | 35 |
| Tram | 28 |
| London Underground | 27 |
| Ferry (foot passenger) | 19 |
| Eurostar (International rail) | 4.5 |
Are EVs Greener?
Many experts agree that EVs produce a lower carbon footprint over time versus traditional internal combustion engine (ICE) vehicles.
However, the batteries in electric vehicles charge on the power that comes straight off the electrical grid—which in many places may be powered by fossil fuels. For that reason, the carbon footprint of an EV will depend largely on the blend of electricity sources used for charging.
There are also questions about how energy-intensive it is to build EVs compared to a comparable ICE vehicle.

-

 Debt1 week ago
How Debt-to-GDP Ratios Have Changed Since 2000
-

 Countries2 weeks ago
Population Projections: The World’s 6 Largest Countries in 2075
-

 Markets2 weeks ago
The Top 10 States by Real GDP Growth in 2023
-

 Demographics2 weeks ago
The Smallest Gender Wage Gaps in OECD Countries
-

 United States2 weeks ago
Where U.S. Inflation Hit the Hardest in March 2024
-

 Green2 weeks ago
Top Countries By Forest Growth Since 2001
-

 United States2 weeks ago
Ranked: The Largest U.S. Corporations by Number of Employees
-

 Maps2 weeks ago
The Largest Earthquakes in the New York Area (1970-2024)