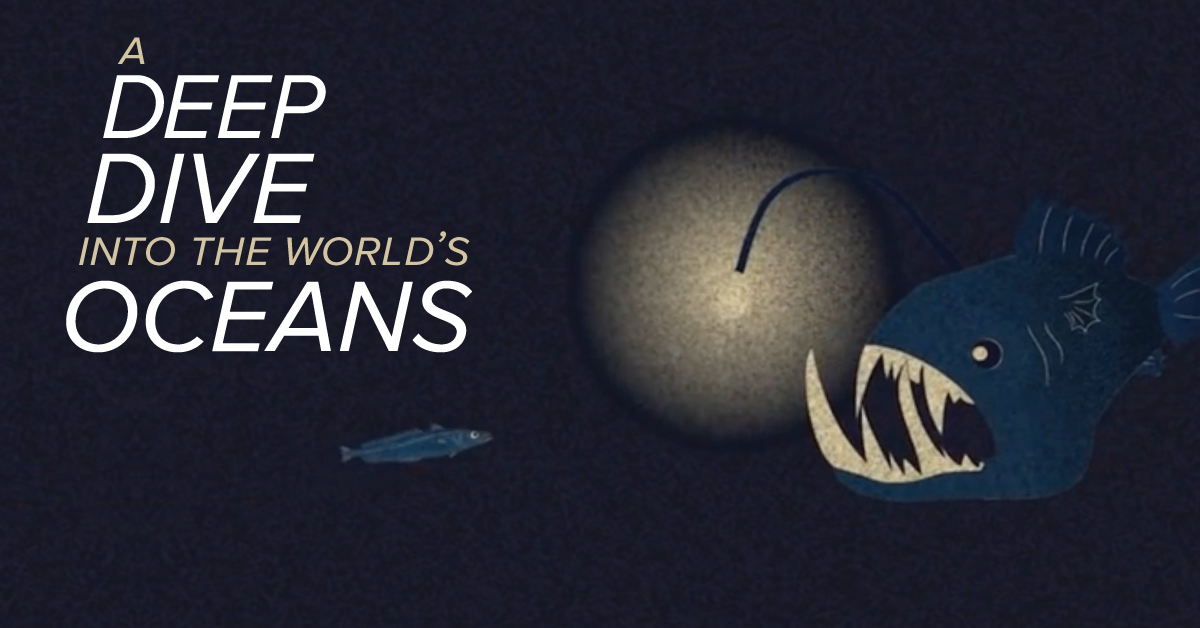
In the battle for mind-share, space vs. sea is no contest.
From the epic race to reach the surface of the moon, to the well-documented trials and tribulations of SpaceX’s rocket launches, space is widely regarded as mankind’s natural next step.
For centuries, we’ve gazed at the night sky attempting to decode the messages of the cosmos, but we’ve treated the ocean as a dumping ground or as a nemesis. In the era of big data, it’s strange to note that an estimated 95% of the world’s oceans still remain unexplored.
A Deep Dive Into the World’s Oceans
Today’s video, from Tech Insider, helps shed some light on just how deep the ocean is, and put that depth into a context us surface-dwellers can understand.
The ocean is vast, but looking at it in terms of light and food supply allows us to better understand the structure of that ecosystem.
There are five main oceanic divisions:
Ocean Zone
Depth (m)
Depth (ft)
epipelagic
Surface to 200 m
Surface to 650 ft
mesopelagic
200 to 1,000 m
650 to 3,300 ft
bathypelagic
1,000 to 4000 m
3,300 to 13,000 ft
abyssopelagic
4,000 to 6,000 m
13,000 to 20,000 ft
hadopelagic
6,000 to 11,000 m
20,000 to 36,000 ft
Let’s take a look at each layer in more detail.
Scratching the Surface
The surface layer of the ocean, or epipelagic zone, is the portion we’re most familiar with. This portion of the ocean is amply lit by the sun, and though it’s the smallest zone by volume, it contains much of the ocean’s life. In fact, the phytoplankton living at this level produce half of the world’s oxygen.
One of the chief concerns about climate change is that acidification and temperature changes may dramatically influence levels of phytoplankton in the ocean, thus putting Earth’s largest source of oxygen in jeopardy.
Due to its proximity to sunlight, this layer of the ocean is the fuel that feeds the rest of the ocean. As organisms die, they begin to sink to the lower depths in the form of “marine snow”. This is vital since plant life cannot survive beyond this thin, top layer of water. Put simply, the epipelagic zone feeds the rest of the ocean.
The Twilight Zone
The next layer, called the mesopelagic zone, begins 200m below the surface and extends down to the 1km level. At this point, sunlight illuminating the water begins to wane and water pressure already begins to push beyond what the human body can tolerate.
This dimly lit zone is where we begin to see evolutionary adaptations such as bioluminescence. Large fish and whales also enter this zone to hunt for food.
Hello Darkness, My Old Friend
At 1km below the surface – in the bathypelagic zone – sunlight has faded completely and the ocean is nearly pitch black. This region accounts for 90% of the ocean’s volume and as the video below (via TEDed) explains, this is where things start to get really weird.
The Abyss
The aptly named abyssopelagic zone, begins at 4,000 meters below the surface and extends down to 6,000 meters (or the ocean floor). At this level, the water temperature is nearly at freezing level, and because no sunlight reaches this zone, many of the animals that live here are sightless. The Abyss is the largest zone in the ocean, accounting for about 75% of the ocean floor and 54% of the ocean’s volume.
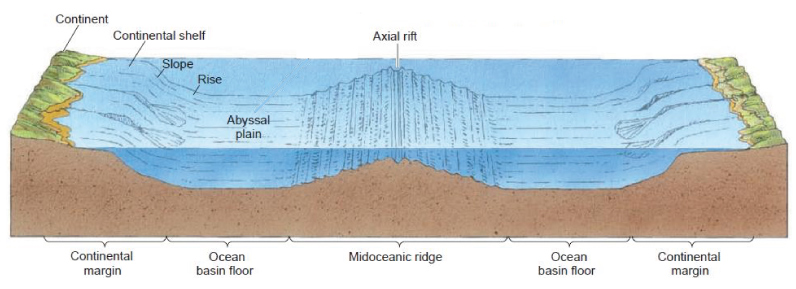
This region of the ocean is the home of the Abyssal plains. The plains are the upper surface of sediment that has accumulated in abyssal depressions, smoothing out what would otherwise by irregular topography. By this depth the consistent flow of marine snow has decreased dramatically, so organisms depend on occasional “feasts” to survive. Occasionally, events such as large algae blooms near the surface end up delivering huge amounts of food to the ocean floor once those blooms die off.
Abyssal plains could eventually become a big deal economically due to hydrocarbon exploration and mineral extraction. An example of the latter is polymetallic nodules. These potato-sized concretions are scattered around the seafloor at depths greater than 4,000 meters. If it becomes economically viable to harvest these nodules (comprised of manganese, iron, nickel, cobalt, and copper), companies could generate considerable revenue. Currently, there are eight commercial contractors licensed by the International Seabed Authority to explore the extraction of nodule resources.
Earth’s Final Frontier
The hadopelagic zone comprises less than 1% of ocean volume and 0.2% of the seafloor, but looms large as one of Earth’s least understood ecosystems. In fact, more humans have been on the moon than have visited this area of the ocean, and most of this zone only exists within deep water trenches and canyons that extend well beyond the Abyssal plains. There are 33 “hadal trenches” and five of them exceed 10,000 meters – including the world’s deepest oceanic point, the Mariana Trench.
The water pressure here can reach a mind-bending eight tons per square inch, but in spite of the extreme pressure, lack of food, and near-freezing temperatures, life can still be found. Most of the creatures that inhabit the hadal zone are literally bottom feeders; they eat the very last bits of marine snow that reach the trench floor.
While nearly all organisms on Earth derive energy either directly or indirectly from the sun, certain organisms have adapted to survive by using hydrothermal vents as an energy source. Many of the creatures living around vents contain symbiotic bacteria, which subsist off hydrogen sulphide emissions. This unique ecosystem provides clues for how life could exist on other planets with more extreme ecosystems.
Visualized: A Global Risk Assessment of 2021 And Beyond
Risk is all around us. After the events of 2020, it’s not surprising that the level and variety of risks we face have become more pronounced than ever.
Every year, the World Economic Forum analyzes the top risks in the world in its Global Risks Report. Risks were identified based on 800+ responses of surveyed leaders across various levels of expertise, organizations, and regional distribution.
Which risks are top of mind in 2021?
The World’s Top Risks by Likelihood and Impact
According to WEF’s risk assessment methodology, all the global risks in 2021 fall into the following broad categories:
🔵 Economic
🟢 Environmental
🟠 Geopolitical
🔴 Societal
🟣 Technological
It goes without saying that infectious diseases have now become one of the top societal risks on both metrics of likelihood and impact.
That said, environmental risks continue to dominate the leaderboard, accounting for five of the top 10 risks by impact, especially when it comes to climate action failure.
Several countries are off-track in meeting emissions goals set by the Paris Climate Agreement in 2015, while the pandemic has also delayed progress in the shift towards a carbon-neutral economy. Meanwhile, biodiversity loss is occurring at unprecedented rates.
Rank
Top Risks by Likelihood
Top Risks by Impact
#1
🟢Extreme weather
🔴Infectious diseases
#2
🟢Climate action failure
#3
🟢Human environmental damage
🟠Weapons of mass destruction
#4
🔴Infectious diseases
🟢Biodiversity loss
#5
🟢Biodiversity loss
🟢Natural resource crises
#6
🟣Digital power concentration
🟢Human environmental damage
#7
🟣Digital inequality
🔴Livelihood crises
#8
🟠Interstate relations fracture
🟢Extreme weather
#9
🟣Cybersecurity failure
🔵Debt crises
#10
🔴Livelihood crises
🟣IT Infrastructure breakdown
As for other risks, the prospect of weapons of mass destruction ranks in third place for potential impact. In the global arms race, a single misstep would trigger severe consequences on civil and political stability.
New Risks in 2021
While many of the risks included in the Global Risks Report 2021 are familiar to those who have read the editions of years past, there are a flurry of new entries to the list this year.
Here are some of the most interesting ones in the risk assessment, sorted by category:
Societal Risks
COVID-19 has resulted in a myriad of knock-on societal risks, from youth disillusionment and mental health deterioration to livelihood crises. The first two risks in particular go hand-in-hand, as “pandemials” (youth aged 15-24) are staring down a turbulent future. This generation is more likely to report high distress from disrupted educational and economic prospects.
At the same time, as countries prepare for widespread immunization against COVID-19, another related societal risk is the backlash against science. The WEF identifies vaccines and immunization as subjects susceptible to disinformation and denial of scientific evidence.
Economic Risks
As monetary stimulus was kicked into high gear to prop up markets and support many closed businesses and quarantined families, the economic outlook seems more fragile than ever. Debt-to-GDP ratios continue to rise across advanced economies—if GDP growth stagnates for too long, a potential debt crisis could see many businesses and major nations default on their debt.
With greater stress accumulating on a range of major industries such as travel and hospitality, the economy risks a build-up of “zombie” firms that drag down overall productivity. Despite this, market valuations and asset prices continue to rise, with equity markets rewarding investors betting on a swift recovery so far.
Technological Risks
Last but not least, COVID-19 has raised the alert on various technological risks. Despite the accelerated shift towards remote work and digitalization of entire industries, the reality is that digital inequality leaves those with lower digital literacy behind—worsening existing inequalities.
Big Tech is also bloating even further, growing its digital power concentration. The market share some companies hold in their respective sectors, such as Amazon in online retail, threatens to erode the agency of other players.
Assessing the Top 10 Risks On the Horizon
Back in mid-2020, the WEF attempted to quantify the biggest risks over an 18-month period, with a prolonged economic recession emerging on top.
In this report’s risk assessment, global risks are further classified by how soon their resulting threats are expected to occur. Weapons of mass destruction remain the top risk, though on a much longer scale of up to 10 years in the future.
Rank
Risk
%
Time Horizon
#1
🟠Weapons of mass destruction
62.7
Long-term (5-10 years)
#2
🔴Infectious diseases
58
Short-term risks (0-2 years)
#3
🔴Livelihood crises
55.1
Short-term risks (0-2 years)
#4
🔵Asset bubble burst
53.3
Medium-term risks (3-5 years)
#5
🟣 IT infrastructure breakdown
53.3
Medium-term risks (3-5 years)
#6
🔵Price instability
52.9
Medium-term risks (3-5 years)
#7
🟢Extreme weather events
52.7
Short-term risks (0-2 years)
#8
🔵Commodity shocks
52.7
Medium-term risks (3-5 years)
#9
🔵Debt crises
52.3
Medium-term risks (3-5 years)
#10
🟠State collapse
51.8
Long-term (5-10 years)
Through this perspective, COVID-19 (and its variants) remains high in the next two years as the world scrambles to return to normal.
It’s also clear that more economic risks are taking center stage, from an asset bubble burst to price instability that could have a profound effect over the next five years.
Thank you!
Given email address is already subscribed, thank you!
Please provide a valid email address.
Please complete the CAPTCHA.
Oops. Something went wrong. Please try again later.
There are over 510 million square kilometers of area on the surface of Earth, but less than 30% of this is covered by land. The rest is water, in the form of vast oceans.
Today’s visualization uses data primarily from the United Nations Statistics Division (UNSD) to rank the world’s countries by their share of Earth’s surface.
Breakdown of Countries Share of Earth’s Surface
The largest countries by surface area are Russia (3.35%), Canada (1.96%), and China (1.88%).
Together they occupy roughly 7.2% of Earth’s surface. Russia is so big that even if we divided the country between its Asian and European sections, those new regions would still be the largest in their respective continents.
Country / Dependency
Total in km² (mi²)
Percentage of Earth's Surface
Russia
17,098,246 (6,601,670)
3.352%
Antarctica
14,000,000 (5,400,000)
2.745%
Canada
9,984,670 (3,855,100)
1.958%
China
9,596,961 (3,705,407)
1.881%
United States
9,525,067 (3,677,649)
1.867%
Brazil
8,515,767 (3,287,956)
1.670%
Australia
7,692,024 (2,969,907)
1.508%
India
3,287,263 (1,269,219)
0.644%
Argentina
2,780,400 (1,073,500)
0.545%
Kazakhstan
2,724,900 (1,052,100)
0.534%
Algeria
2,381,741 (919,595)
0.467%
D.R. Congo
2,344,858 (905,355)
0.460%
Greenland (Denmark)
2,166,086 (836,330)
0.425%
Saudi Arabia
2,149,690 (830,000)
0.421%
Mexico
1,964,375 (758,449)
0.385%
Indonesia
1,910,931 (737,815)
0.375%
Sudan
1,861,484 (718,723)
0.365%
Libya
1,759,540 (679,360)
0.345%
Iran
1,648,195 (636,372)
0.323%
Mongolia
1,564,110 (603,910)
0.307%
Peru
1,285,216 (496,225)
0.252%
Chad
1,284,000 (496,000)
0.252%
Niger
1,267,000 (489,000)
0.248%
Angola
1,246,700 (481,400)
0.244%
Mali
1,240,192 (478,841)
0.243%
South Africa
1,221,037 (471,445)
0.239%
Colombia
1,141,748 (440,831)
0.224%
Ethiopia
1,104,300 (426,400)
0.216%
Bolivia
1,098,581 (424,164)
0.215%
Mauritania
1,030,700 (398,000)
0.202%
Egypt
1,002,450 (387,050)
0.197%
Tanzania
945,087 (364,900)
0.185%
Nigeria
923,768 (356,669)
0.181%
Venezuela
916,445 (353,841)
0.180%
Pakistan
907,843 (350,520)
0.178%
Namibia
825,615 (318,772)
0.162%
Mozambique
801,590 (309,500)
0.157%
Turkey
783,562 (302,535)
0.154%
Chile
756,102 (291,933)
0.148%
Zambia
752,612 (290,585)
0.148%
Myanmar
676,578 (261,228)
0.133%
Afghanistan
652,230 (251,830)
0.128%
South Sudan
644,329 (248,777)
0.126%
Somalia
637,657 (246,201)
0.125%
Central African Republic
622,984 (240,535)
0.122%
Ukraine
603,500 (233,000)
0.118%
Madagascar
587,041 (226,658)
0.115%
Botswana
581,730 (224,610)
0.114%
Kenya
580,367 (224,081)
0.114%
France
543,940 (210,020)
0.107%
Yemen
527,968 (203,850)
0.104%
Thailand
513,120 (198,120)
0.101%
Spain
505,992 (195,365)
0.099%
Turkmenistan
488,100 (188,500)
0.096%
Cameroon
475,442 (183,569)
0.093%
Papua New Guinea
462,840 (178,700)
0.091%
Sweden
450,295 (173,860)
0.088%
Uzbekistan
447,400 (172,700)
0.088%
Morocco
446,550 (172,410)
0.088%
Iraq
438,317 (169,235)
0.086%
Paraguay
406,752 (157,048)
0.080%
Zimbabwe
390,757 (150,872)
0.077%
Norway
385,207 (148,729)
0.076%
Japan
377,976 (145,937)
0.074%
Germany
357,114 (137,882)
0.070%
Republic of the Congo
342,000 (132,000)
0.067%
Finland
338,424 (130,666)
0.066%
Vietnam
331,212 (127,882)
0.065%
Malaysia
330,803 (127,724)
0.065%
Ivory Coast
322,463 (124,504)
0.063%
Poland
312,696 (120,733)
0.061%
Oman
309,500 (119,500)
0.061%
Italy
301,339 (116,348)
0.059%
Philippines
300,000 (120,000)
0.059%
Ecuador
276,841 (106,889)
0.054%
Burkina Faso
274,222 (105,878)
0.054%
New Zealand
270,467 (104,428)
0.053%
Gabon
267,668 (103,347)
0.052%
Guinea
245,857 (94,926)
0.048%
United Kingdom
242,495 (93,628)
0.048%
Uganda
241,550 (93,260)
0.047%
Ghana
238,533 (92,098)
0.047%
Romania
238,397 (92,046)
0.047%
Laos
236,800 (91,400)
0.046%
Guyana
214,969 (83,000)
0.042%
Belarus
207,600 (80,200)
0.041%
Kyrgyzstan
199,951 (77,202)
0.039%
Senegal
196,722 (75,955)
0.039%
Syria
185,180 (71,500)
0.036%
Cambodia
181,035 (69,898)
0.035%
Uruguay
176,215 (68,037)
0.035%
Somaliland
176,120 (68,000)
0.035%
Suriname
163,820 (63,250)
0.032%
Tunisia
163,610 (63,170)
0.032%
Bangladesh
148,460 (57,320)
0.029%
Nepal
147,181 (56,827)
0.029%
Tajikistan
143,100 (55,300)
0.028%
Greece
131,957 (50,949)
0.026%
Nicaragua
130,373 (50,337)
0.026%
North Korea
120,540 (46,540)
0.024%
Malawi
118,484 (45,747)
0.023%
Eritrea
117,600 (45,400)
0.023%
Benin
114,763 (44,310)
0.022%
Honduras
112,492 (43,433)
0.022%
Liberia
111,369 (43,000)
0.022%
Bulgaria
111,002 (42,858)
0.022%
Cuba
109,884 (42,426)
0.022%
Guatemala
108,889 (42,042)
0.021%
Iceland
103,000 (40,000)
0.020%
South Korea
100,210 (38,690)
0.020%
Hungary
93,028 (35,918)
0.018%
Portugal
92,226 (35,609)
0.018%
Jordan
89,342 (34,495)
0.018%
Serbia
88,361 (34,116)
0.017%
Azerbaijan
86,600 (33,400)
0.017%
Austria
83,871 (32,383)
0.016%
United Arab Emirates
83,600 (32,300)
0.016%
Czech Republic
78,865 (30,450)
0.015%
Panama
75,417 (29,119)
0.015%
Sierra Leone
71,740 (27,700)
0.014%
Ireland
70,273 (27,133)
0.014%
Georgia
69,700 (26,900)
0.014%
Sri Lanka
65,610 (25,330)
0.013%
Lithuania
65,300 (25,200)
0.013%
Latvia
64,559 (24,926)
0.013%
Togo
56,785 (21,925)
0.011%
Croatia
56,594 (21,851)
0.011%
Bosnia and Herzegovina
51,209 (19,772)
0.010%
Costa Rica
51,100 (19,700)
0.010%
Slovakia
49,037 (18,933)
0.010%
Dominican Republic
48,671 (18,792)
0.010%
Estonia
45,227 (17,462)
0.009%
Denmark
43,094 (16,639)
0.008%
Netherlands
41,850 (16,160)
0.008%
Switzerland
41,284 (15,940)
0.008%
Bhutan
38,394 (14,824)
0.008%
Taiwan
36,193 (13,974)
0.007%
Guinea-Bissau
36,125 (13,948)
0.007%
Moldova
33,846 (13,068)
0.007%
Belgium
30,528 (11,787)
0.006%
Lesotho
30,355 (11,720)
0.006%
Armenia
29,743 (11,484)
0.006%
Solomon Islands
28,896 (11,157)
0.006%
Albania
28,748 (11,100)
0.006%
Equatorial Guinea
28,051 (10,831)
0.005%
Burundi
27,834 (10,747)
0.005%
Haiti
27,750 (10,710)
0.005%
Rwanda
26,338 (10,169)
0.005%
North Macedonia
25,713 (9,928)
0.005%
Djibouti
23,200 (9,000)
0.005%
Belize
22,966 (8,867)
0.005%
El Salvador
21,041 (8,124)
0.004%
Israel
20,770 (8,020)
0.004%
Slovenia
20,273 (7,827)
0.004%
Fiji
18,272 (7,055)
0.004%
Kuwait
17,818 (6,880)
0.003%
Eswatini
17,364 (6,704)
0.003%
East Timor
14,919 (5,760)
0.003%
The Bahamas
13,943 (5,383)
0.003%
Montenegro
13,812 (5,333)
0.003%
Vanuatu
12,189 (4,706)
0.002%
Qatar
11,586 (4,473)
0.002%
The Gambia
11,295 (4,361)
0.002%
Jamaica
10,991 (4,244)
0.002%
Kosovo
10,887 (4,203)
0.002%
Lebanon
10,452 (4,036)
0.002%
Cyprus
9,251 (3,572)
0.002%
State of Palestine
6,020 (2,320)
0.001%
Brunei
5,765 (2,226)
0.001%
Trinidad and Tobago
5,130 (1,980)
0.001%
Cape Verde
4,033 (1,557)
0.001%
Samoa
2,842 (1,097)
0.001%
Luxembourg
2,586 (998)
0.001%
Mauritius
2,040 (790)
0.000%
Comoros
1,862 (719)
0.000%
São Tomé and Príncipe
964 (372)
0.000%
Kiribati
811 (313)
0.000%
Bahrain
778 (300)
0.000%
Dominica
751 (290)
0.000%
Tonga
747 (288)
0.000%
Singapore
728 (281)
0.000%
Federated States of Micronesia
702 (271)
0.000%
Saint Lucia
616 (238)
0.000%
Andorra
468 (181)
0.000%
Palau
459 (177)
0.000%
Seychelles
452 (175)
0.000%
Antigua and Barbuda
442 (171)
0.000%
Barbados
430 (170)
0.000%
Saint Vincent and the Grenadines
389 (150)
0.000%
Grenada
344 (133)
0.000%
Malta
316 (122)
0.000%
Maldives
300 (120)
0.000%
Saint Kitts and Nevis
261 (101)
0.000%
Marshall Islands
181 (70)
0.000%
Liechtenstein
160 (62)
0.000%
San Marino
61 (24)
0.000%
Tuvalu
26 (10)
0.000%
Nauru
21 (8.1)
0.000%
Monaco
2.02 (0.78)
0.000%
Vatican City
0.49 (0.19)
0.000%
Antarctica, although not a country, covers the second largest amount of land overall at 2.75%. Meanwhile, the other nations that surpass the 1% mark for surface area include the United States (1.87%), Brazil (1.67%), and Australia (1.51%).
The remaining 195 countries and regions below 1%, combined, account for the other half of Earth’s land surface. Among the world’s smallest countries are the island nations of the Caribbean and the South Pacific Ocean. However, the tiniest of the tiny are Vatican City and Monaco, which combine for a total area of just 2.51 km².
The remaining 70% of Earth’s surface is water: 27% territorial waters and 43% international waters or areas beyond national jurisdiction.
Areas Beyond National Jurisdiction
In the past, nations adhered to the freedom-of-the-seas doctrine, a 17th century principle that limited jurisdiction over the oceans to a narrow area along a nation’s coastline. The rest of the seas did not belong to any nation and were free for countries to travel and exploit.
This situation lasted into the 20th century, but by mid-century there was an effort to extend national claims as competition for offshore resources became increasingly fierce and ocean pollution became an issue.
In 1982, the United Nations adopted the Law of the Sea Convention which extended international law over the extra-territorial waters. The convention established freedom-of-navigation rights and set territorial sea boundaries 12 miles (19 km) offshore with exclusive economic zones up to 200 miles (322 km) offshore, extending a country’s influence over maritime resources.
Does Size Matter?
The size of countries is the outcome of politics, economics, history, and geography. Put simply, borders can change over time.
In 1946, there were 76 independent countries in the world, and today there are 195. There are forces that push together or pull apart landscapes over time. While physical geography plays a role in the identity of nations, Sheikh Zayed bin Sultan Al Nahyan, the former ruler of UAE, a tiny Gulf nation, put it best:
“A country is not measured by the size of its area on the map. A country is truly measured by its heritage and culture.”
Thank you!
Given email address is already subscribed, thank you!
Please provide a valid email address.
Please complete the CAPTCHA.
Oops. Something went wrong. Please try again later.